Estimated zip code population in 2022: 44,209 Zip code population in 2010: 36,017 Zip code population in 2000: 27,391
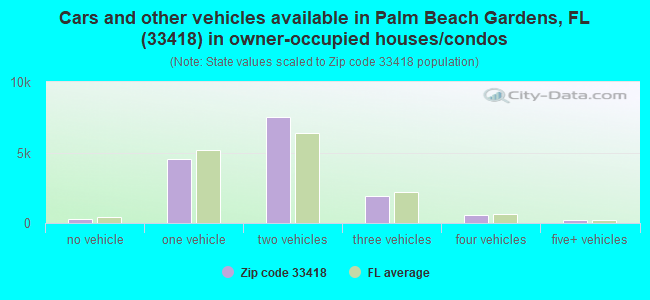
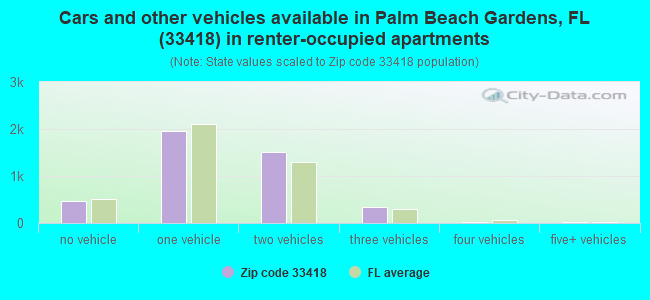
Houses and condos: 22,448 Renter-occupied apartments: 4,315
% of renters here:
22%
State:
33%
March 2022 cost of living index in zip code 33418: 102.3 (near average, U.S. average is 100)
Land area: 46.5 sq. mi. Water area: 0.3 sq. mi.
Population density: 950 people per square mile
(low).
OSM Map
General Map
Google Map
MSN Map
OSM Map
General Map
Google Map
MSN Map
OSM Map
General Map
Google Map
MSN Map
OSM Map
General Map
Google Map
MSN Map
Please wait while loading the map...
Real estate property taxes paid for housing units in 2022:
This zip code:
1.0% ($6,338)
Florida:
0.7% ($2,529)
Median real estate property taxes paid for housing units with mortgages in 2022: $6,107 (1.0%) Median real estate property taxes paid for housing units with no mortgage in 2022: $6,727 (0.9%)
Estimated median house/condo value in 2022: $653,061
33418:
$653,061
Florida:
$354,100
According to our research of Florida and other state lists, there were 8 registered sex offenders living in 33418 zip code as of April 26, 2024. The ratio of all residents to sex offenders in zip code 33418 is 4,782 to 1. The ratio of registered sex offenders to all residents in this zip code is much lower than the state average.
Median resident age:
This zip code:
52.4 years
Florida median age:
42.7 years
Average household size:
This zip code:
2.3 people
Florida:
2.5 people
Averages for the 2020 tax year for zip code 33418, filed in 2021:
Average Adjusted Gross Income (AGI) in 2020: $234,169 (Individual Income Tax Returns)
Here:
$234,169
State:
$82,200
Salary/wage: $122,879 (reported on 67.8% of returns)
Here:
$122,879
State:
$58,347
(% of AGI for various income ranges: 1194.3% for AGIs below $25k, 3586.5% for AGIs $25k-50k, 6750.9% for AGIs $50k-75k, 9413.5% for AGIs $75k-100k, 17402.0% for AGIs $100k-200k, 123739.3% for AGIs over 200k)
Taxable interest for individuals: $12,122 (reported on 47.4% of returns)
This zip code:
$12,122
Florida:
$4,272
(% of AGI for various income ranges: 66.2% for AGIs below $25k, 81.5% for AGIs $25k-50k, 136.8% for AGIs $50k-75k, 288.1% for AGIs $75k-100k, 567.6% for AGIs $100k-200k, 11222.7% for AGIs over 200k)
Ordinary dividends: $37,150 (reported on 45.5% of returns)
Here:
$37,150
State:
$15,863
(% of AGI for various income ranges: 131.9% for AGIs below $25k, 233.7% for AGIs $25k-50k, 492.1% for AGIs $50k-75k, 865.3% for AGIs $75k-100k, 2182.7% for AGIs $100k-200k, 32035.5% for AGIs over 200k)
Net capital gain/loss in AGI: +$133,910 (reported on 44.4% of returns)
Here:
+$133,910
State:
+$62,983
(% of AGI for various income ranges: 39.4% for AGIs below $25k, 153.7% for AGIs $25k-50k, 351.8% for AGIs $50k-75k, 624.6% for AGIs $75k-100k, 2033.7% for AGIs $100k-200k, 131825.0% for AGIs over 200k)
Profit/loss from business: +$32,577 (reported on 21.8% of returns)
Here:
+$32,577
State:
+$9,719
(% of AGI for various income ranges: 238.3% for AGIs below $25k, 276.0% for AGIs $25k-50k, 384.1% for AGIs $50k-75k, 551.9% for AGIs $75k-100k, 1121.5% for AGIs $100k-200k, 11524.0% for AGIs over 200k)
Taxable individual retirement arrangement distribution: $51,531 (reported on 16.7% of returns)
33418:
$51,531
Florida:
$24,823
(% of AGI for various income ranges: 106.0% for AGIs below $25k, 203.1% for AGIs $25k-50k, 428.2% for AGIs $50k-75k, 845.5% for AGIs $75k-100k, 2529.7% for AGIs $100k-200k, 12522.9% for AGIs over 200k)
Self-employed (Keogh) retirement plans: $41,748 (reported on 1.8% of returns)
33418:
$41,748
Florida:
$29,694
(% of AGI for various income ranges: 37.4% for AGIs $50k-75k, 77.1% for AGIs $100k-200k, 1491.9% for AGIs over 200k)
Total itemized deductions: $53,688 (reported on 21.5% of returns)
Here:
$53,688
State:
$45,393
(% of AGI for various income ranges: 238.4% for AGIs below $25k, 327.6% for AGIs $25k-50k, 705.9% for AGIs $50k-75k, 1106.1% for AGIs $75k-100k, 2473.0% for AGIs $100k-200k, 17914.7% for AGIs over 200k)
Charity contributions: $23,604 (reported on 18.8% of returns)
Here:
$23,604
State:
$20,178
(% of AGI for various income ranges: 14.2% for AGIs below $25k, 32.5% for AGIs $25k-50k, 99.2% for AGIs $50k-75k, 156.3% for AGIs $75k-100k, 408.2% for AGIs $100k-200k, 8991.5% for AGIs over 200k)
Taxes paid: $8,004 (reported on 21.4% of returns)
33418:
$8,004
State:
$6,967
(% of AGI for various income ranges: 41.2% for AGIs below $25k, 64.9% for AGIs $25k-50k, 144.7% for AGIs $50k-75k, 239.7% for AGIs $75k-100k, 501.5% for AGIs $100k-200k, 2175.0% for AGIs over 200k)
Earned income credit: $1,809 (reported on 7.5% of returns)
Here:
$1,809
State:
$2,306
(% of AGI for various income ranges: 67.6% for AGIs below $25k, 40.3% for AGIs $25k-50k)
Percentage of individuals using paid preparers for their 2020 taxes: 92.7%
Here:
93%
State:
92%
(% for various income ranges: 90.9% for AGIs below $25k, 93.0% for AGIs $25k-50k, 93.1% for AGIs $50k-75k, 92.6% for AGIs $75k-100k, 93.0% for AGIs $100k-200k, 94.0% for AGIs over 200k)
Averages for the 2012 tax year for zip code 33418, filed in 2013:
Average Adjusted Gross Income (AGI) in 2012: $155,985 (Individual Income Tax Returns)
Here:
$155,985
State:
$60,316
Salary/wage: $93,198 (reported on 70.4% of returns)
Here:
$93,198
State:
$45,277
(% of AGI for various income ranges: 67.1% for AGIs below $25k, 72.3% for AGIs $25k-50k, 65.4% for AGIs $50k-75k, 59.1% for AGIs $75k-100k, 53.9% for AGIs $100k-200k, 33.4% for AGIs over 200k)
Taxable interest for individuals: $11,223 (reported on 49.5% of returns)
This zip code:
$11,223
Florida:
$3,587
(% of AGI for various income ranges: 4.1% for AGIs below $25k, 2.0% for AGIs $25k-50k, 2.1% for AGIs $50k-75k, 2.4% for AGIs $75k-100k, 2.5% for AGIs $100k-200k, 4.1% for AGIs over 200k)
Ordinary dividends: $24,562 (reported on 42.0% of returns)
Here:
$24,562
State:
$12,831
(% of AGI for various income ranges: 6.9% for AGIs below $25k, 4.5% for AGIs $25k-50k, 4.7% for AGIs $50k-75k, 5.8% for AGIs $75k-100k, 6.3% for AGIs $100k-200k, 7.0% for AGIs over 200k)
Net capital gain/loss in AGI: +$56,112 (reported on 39.9% of returns)
Here:
+$56,112
State:
+$33,493
(% of AGI for various income ranges: 1.0% for AGIs $25k-50k, 1.0% for AGIs $50k-75k, 1.7% for AGIs $75k-100k, 2.9% for AGIs $100k-200k, 20.4% for AGIs over 200k)
Profit/loss from business: +$29,121 (reported on 19.6% of returns)
Here:
+$29,121
State:
+$10,012
(% of AGI for various income ranges: 11.8% for AGIs below $25k, 5.5% for AGIs $25k-50k, 3.9% for AGIs $50k-75k, 3.5% for AGIs $75k-100k, 4.0% for AGIs $100k-200k, 3.2% for AGIs over 200k)
Taxable individual retirement arrangement distribution: $49,081 (reported on 20.6% of returns)
33418:
$49,081
Florida:
$21,544
(% of AGI for various income ranges: 6.1% for AGIs below $25k, 4.4% for AGIs $25k-50k, 5.1% for AGIs $50k-75k, 6.8% for AGIs $75k-100k, 9.9% for AGIs $100k-200k, 5.9% for AGIs over 200k)
Self-employment retirement plans: $28,467 (reported on 1.4% of returns)
33418:
$28,467
Florida:
$20,611
(% of AGI for various income ranges: 0.3% for AGIs $50k-75k, 0.3% for AGIs $100k-200k, 0.3% for AGIs over 200k)
Total itemized deductions: $42,309 (16% of AGI, reported on 49.3% of returns)
Here:
$42,309
State:
$25,533
Here:
15.7% of AGI
State:
18.0% of AGI
(% of AGI for various income ranges: 27.1% for AGIs below $25k, 17.6% for AGIs $25k-50k, 16.9% for AGIs $50k-75k, 17.9% for AGIs $75k-100k, 16.4% for AGIs $100k-200k, 11.3% for AGIs over 200k)
Charity contributions: $8,804 (reported on 42.8% of returns)
Here:
$8,804
State:
$5,698
(% of AGI for various income ranges: 1.4% for AGIs below $25k, 1.5% for AGIs $25k-50k, 1.7% for AGIs $50k-75k, 1.9% for AGIs $75k-100k, 2.3% for AGIs $100k-200k, 2.6% for AGIs over 200k)
Taxes paid: $15,219 (reported on 48.7% of returns)
33418:
$15,219
State:
$6,203
(% of AGI for various income ranges: 6.3% for AGIs below $25k, 4.3% for AGIs $25k-50k, 4.2% for AGIs $50k-75k, 5.0% for AGIs $75k-100k, 5.2% for AGIs $100k-200k, 4.6% for AGIs over 200k)
Earned income credit: $1,851 (reported on 8.6% of returns)
Here:
$1,851
State:
$2,372
(% of AGI for various income ranges: 3.8% for AGIs below $25k, 0.6% for AGIs $25k-50k)
Percentage of individuals using paid preparers for their 2012 taxes: 63.2%
Here:
63%
State:
54%
(% for various income ranges: 55.1% for AGIs below $25k, 55.7% for AGIs $25k-50k, 59.2% for AGIs $50k-75k, 64.7% for AGIs $75k-100k, 68.9% for AGIs $100k-200k, 85.0% for AGIs over 200k)
Averages for the 2004 tax year for zip code 33418, filed in 2005:
Average Adjusted Gross Income (AGI) in 2004: $117,751 (Individual Income Tax Returns)
Here:
$117,751
State:
$50,523
Salary/wage: $76,441 (reported on 71.7% of returns)
Here:
$76,441
State:
$39,563
(% of AGI for various income ranges: 65.7% for AGIs $10k-25k, 71.6% for AGIs $25k-50k, 63.8% for AGIs $50k-75k, 60.7% for AGIs $75k-100k, 39.9% for AGIs over 100k)
Taxable interest for individuals: $7,197 (reported on 62.4% of returns)
This zip code:
$7,197
Florida:
$3,211
(% of AGI for various income ranges: 5.6% for AGIs $10k-25k, 3.5% for AGIs $25k-50k, 3.9% for AGIs $50k-75k, 3.9% for AGIs $75k-100k, 3.6% for AGIs over 100k)
Taxable dividends: $13,191 (reported on 47.7% of returns)
Here:
$13,191
State:
$6,129
(% of AGI for various income ranges: 5.8% for AGIs $10k-25k, 3.8% for AGIs $25k-50k, 4.1% for AGIs $50k-75k, 4.4% for AGIs $75k-100k, 5.4% for AGIs over 100k)
Net capital gain/loss: +$52,002 (reported on 45.0% of returns)
Here:
+$52,002
State:
+$27,205
(% of AGI for various income ranges: -0.1% for AGIs $10k-25k, 1.0% for AGIs $25k-50k, 2.4% for AGIs $50k-75k, 4.0% for AGIs $75k-100k, 24.5% for AGIs over 100k)
Profit/loss from business: +$25,838 (reported on 18.7% of returns)
Here:
+$25,838
State:
+$10,634
(% of AGI for various income ranges: 9.0% for AGIs $10k-25k, 4.7% for AGIs $25k-50k, 4.3% for AGIs $50k-75k, 4.1% for AGIs $75k-100k, 3.8% for AGIs over 100k)
IRA payment deduction: $3,697 (reported on 4.1% of returns)
33418:
$3,697
Florida:
$3,082
(% of AGI for various income ranges: 0.4% for AGIs $10k-25k, 0.4% for AGIs $25k-50k, 0.3% for AGIs $50k-75k, 0.2% for AGIs $75k-100k, 0.1% for AGIs over 100k)
Self-employed pension: $20,148 (reported on 1.8% of returns)
Here:
$20,148
Florida:
$15,857
(% of AGI for various income ranges: 0.1% for AGIs $10k-25k, 0.1% for AGIs $25k-50k, 0.1% for AGIs $50k-75k, 0.5% for AGIs $75k-100k, 0.3% for AGIs over 100k)
Total itemized deductions: $29,049 (16% of AGI, reported on 55.1% of returns)
Here:
$29,049
State:
$20,370
Here:
16.2% of AGI
State:
20.7% of AGI
(% of AGI for various income ranges: 27.3% for AGIs $10k-25k, 25.6% for AGIs $25k-50k, 23.4% for AGIs $50k-75k, 20.8% for AGIs $75k-100k, 10.3% for AGIs over 100k)
Charity contributions deductions: $6,284 (3% of AGI, reported on 49.9% of returns)
Here:
$6,284
State:
$4,064
Here:
3.3% of AGI
State:
3.8% of AGI
(% of AGI for various income ranges: 1.9% for AGIs $10k-25k, 2.2% for AGIs $25k-50k, 2.5% for AGIs $50k-75k, 2.8% for AGIs $75k-100k, 2.7% for AGIs over 100k)
Total tax: $27,304 (reported on 81.9% of returns)
33418:
$27,304
State:
$9,431
(% of AGI for various income ranges: 4.9% for AGIs $10k-25k, 7.4% for AGIs $25k-50k, 9.7% for AGIs $50k-75k, 11.0% for AGIs $75k-100k, 21.5% for AGIs over 100k)
Earned income credit: $1,325 (reported on 6.1% of returns)
Here:
$1,325
State:
$1,808
Percentage of individuals using paid preparers for their 2004 taxes: 66.5%
Here:
66%
State:
60%
(% for various income ranges: 60.6% for AGIs below $10k, 62.0% for AGIs $10k-25k, 60.9% for AGIs $25k-50k, 65.5% for AGIs $50k-75k, 65.9% for AGIs $75k-100k, 78.2% for AGIs over 100k)
Likely homosexual households (counted as self-reported same-sex unmarried-partner households)
Lesbian couples: 0.2% of all households
Gay men: 0.1% of all households
Household received Food Stamps/SNAP in the past 12 months: 354 Household did not receive Food Stamps/SNAP in the past 12 months: 19,159
Women who had a birth in the past 12 months: 418 (363 now married, 66 unmarried) Women who did not have a birth in the past 12 months: 7,763 (3,556 now married, 4,208 unmarried)
Housing units in zip code 33418 with a mortgage: 7,944 (773 second mortgage, 8 home equity loan, 611 both second mortgage and home equity loan) Houses without a mortgage: 458
Median monthly owner costs for units with a mortgage: $2,679 Median monthly owner costs for units without a mortgage: $1,174
Residents with income below the poverty level in 2022:
This zip code:
5.8%
Whole state:
12.7%
Residents with income below 50% of the poverty level in 2022:
This zip code:
3.0%
Whole state:
6.6%
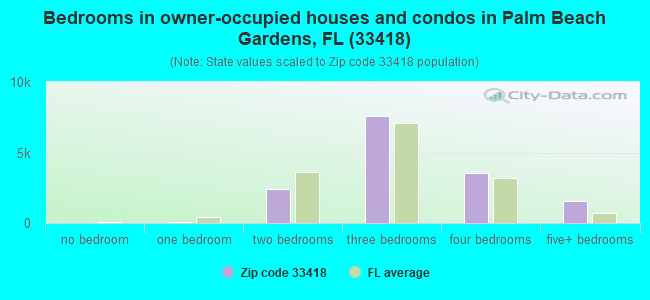
Median number of rooms in houses and condos:
Here:
6.2
State:
5.9
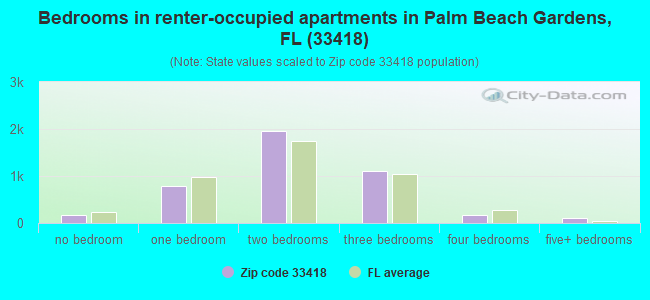
Median number of rooms in apartments:
Here:
4.3
State:
4.2
Notable locations in this zip code not listed on our city pages
Notable locations in zip code 33418: Riviera Country Club (A), Dyer Railroad Station (B), PGA Boulevard Plaza (C), Fire Station Number 61 (D), Fire Station Number 63 (E), Riviera Beach Fire Rescue Station 4 (F), Palm Beach Gardens Fire / Rescue Station 3 (G), Palm Beach Gardens Fire / Rescue Station 4 (H). Display/hide their locations on the map
5,930 married couples with children.
1,874 single-parent households (527 men, 1,347 women).
83.3% of residents of 33418 zip code speak English at home.
6.4% of residents speak Spanish at home (68% very well, 18% well, 11% not well, 3% not at all).
6.8% of residents speak other Indo-European language at home (90% very well, 6% well, 3% not well).
2.8% of residents speak Asian or Pacific Island language at home (55% very well, 17% well, 19% not well, 9% not at all).
0.9% of residents speak other language at home (72% very well, 28% well).
Foreign born population: 7,094 (16.0%) (68.3% of them are naturalized citizens)
Major facilities with environmental interests located in this zip code:
PALM CITY POOL & SPA (13550 SAND RIDGE RD in PALM BEACH GARDENS, FL)
(Integrated Compliance Information System) - ICIS-04-2001-0084, FORMAL ENFORCEMENT ACTION COMPLIANCE ACTIVITY (Tracking inspections of insecticide, fungicide, and rodenticide, and toxic substances) Business SIC classification: MISCELLANEOUS RETAIL STORES
National Pollutant Discharge Elimination System NON-MAJOR (Tracking pollutant discharge elimination systems) - permit Organizations: AL VOELKEL (CONTACT/OWNER)
MIRASOL-PARCEL 17 (TERRA LINDA PLACE - PGA BLVD & in PALM BEACH GARDENS, FL)
National Pollutant Discharge Elimination System NON-MAJOR (Tracking pollutant discharge elimination systems) - permit Organizations: KEN ENDELSON (CONTACT/OWNER)
PALM BEACH GARDENS - STUART TR (SR 710, PARK OF COMMERCE BLVD, in PALM BEACH GARDENS, FL)
National Pollutant Discharge Elimination System NON-MAJOR (Tracking pollutant discharge elimination systems) - permit Organizations: BARBARA BALL (CONTACT/OWNER)
PALOMA, S 36, T42S, R42E (SW CORNER OF MILITARY TRAIL AN in PALM BEACH GARDENS, FL)
National Pollutant Discharge Elimination System NON-MAJOR (Tracking pollutant discharge elimination systems) - permit Organizations: MARK WELCH (CONTACT/OWNER)
PGA NATIONAL CHAMPIONSHIP GOLF (S OF PGA BLVD, N OF NORTH LAKE in PALM BEACH GARDENS, FL)
National Pollutant Discharge Elimination System NON-MAJOR (Tracking pollutant discharge elimination systems) - permit Organizations: NANNETTE GAMMON (CONTACT/OWNER)
CHRIST FELLOWSHIP CHURCH - NOR (5343 NORTHLAKE BLVD in PALM BEACH GARDENS, FL)
National Pollutant Discharge Elimination System NON-MAJOR (Tracking pollutant discharge elimination systems) - permit Organizations: TIMOTHY MESSLER (CONTACT/OWNER)
CIMARRON COVE, S 35 & 36, T 41 (SW CORNER OF MILITARY TRAIL & in PALM BEACH GARDENS, FL)
National Pollutant Discharge Elimination System NON-MAJOR (Tracking pollutant discharge elimination systems) - permit Organizations: JACK PECHTER (CONTACT/OWNER)
Housing units lacking complete plumbing facilities: 0.3% Housing units lacking complete kitchen facilities: 0.6%
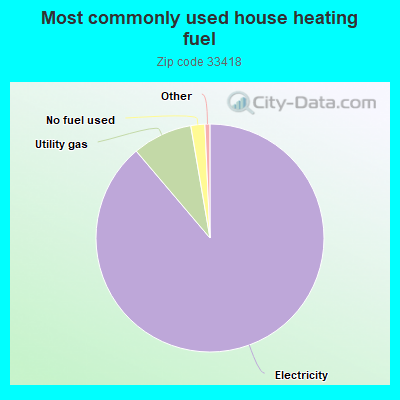
88.8%Electricity
8.5%Utility gas
2.0%No fuel used
Population in 1990: 15,974. Population change in the 1990s: +11,417 (+71.5%).
Place of birth for U.S.-born residents:
This state: 12,218
Northeast: 13,947
Midwest: 4,405
South: 4,099
West: 1,371
52% of the 33418 zip code residents lived in the same house 5 years ago. Out of people who lived in different houses, 57% lived in this county. Out of people who lived in different counties, 50% lived in Florida.
90% of the 33418 zip code residents lived in the same house 1 year ago. Out of people who lived in different houses, 41% moved from this county. Out of people who lived in different houses, 26% moved from different county within same state. Out of people who lived in different houses, 28% moved from different state. Out of people who lived in different houses, 7% moved from abroad.
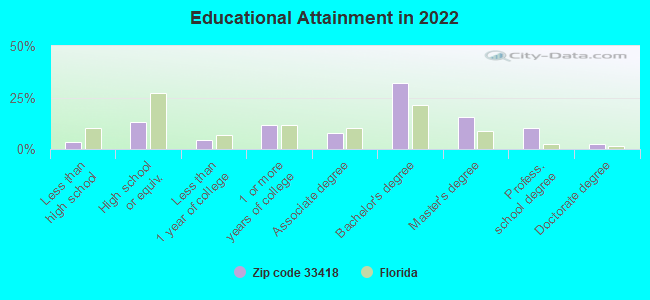
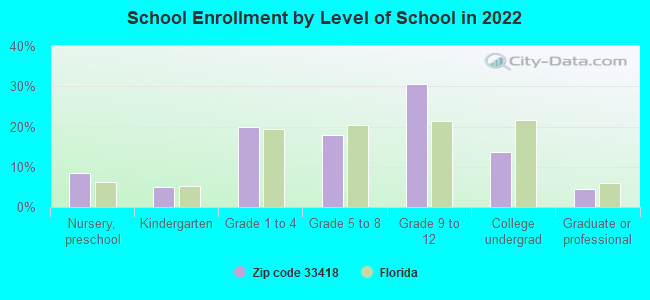
Private vs. public school enrollment:
Students in private schools in grades 1 to 8 (elementary and middle school): 1,003
Here:
33.1%
Florida:
15.8%
Students in private schools in grades 9 to 12 (high school): 805
Here:
32.9%
Florida:
12.9%
Students in private undergraduate colleges: 299
Here:
27.4%
Florida:
23.6%
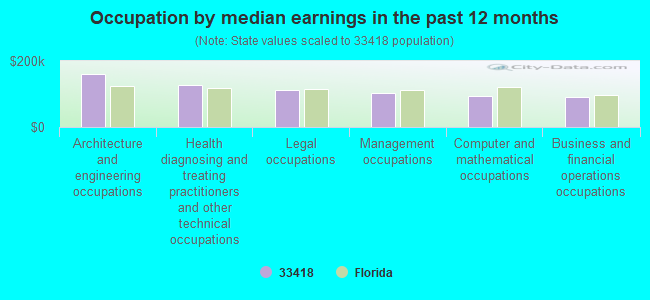
Occupation by median earnings in the past 12 months ($)
159,410Architecture and engineering occupations
126,906Health diagnosing and treating practitioners and other technical occupations
112,832Legal occupations
104,077Management occupations
93,821Computer and mathematical occupations
92,356Business and financial operations occupations
Companies with federal contracts located in this zip code:
SEAROBOTICS CORPORATION (1030 SHADY LAKES CIRCLE in PALM BEACH GAR, FL; small business) : $1,454,183 in 12 contractsfrom 2000 to 2006
Contracts for Other Defense -- Applied Research and Exploratory Development (R&D), Miscellaneous Ship and Marine Equipment, Miscellaneous Defense Hard Goods -- Engineering Development (R&D), Other Research and Development -- Advanced Development (R&D), and moreby Navy, Geological Survey Signed by year:2000: $695,438; 2001: $188,979; 2002: $0; 2003: $0; 2004: $80,000; 2005: $125,446; 2006: $364,320.
Biggest contracts:
$542,064 with Navy for Other Defense -- Applied Research and Exploratory Development (R&D). Signed on 2000-12-15. Completion date: 2001-12-31.
$235,326, same as above.Signed on 2006-04-06. Completion date: 2009-03-05.
$188,979, same as above.Signed on 2001-03-14. Completion date: 2001-12-31.
$153,374, same as above.Signed on 2000-11-06. Completion date: 2001-04-05.
RIDGECREST MOBILE HOME PARK (2251 N US HWY 1 in WEST PALM BEACH, FL; small business) : $80,070 in 5 contractsfrom 2005 to 2006
Contracts for Lease or Rental of Equipment -- Ground Effect Vehicles, Motor Vehicles, Trailers, and Cycles, Lease or Rental of Facilities -- Other Non-Building Facilities by Federal Emergency Management Agency Signed by year:2000: $0; 2001: $0; 2002: $0; 2003: $0; 2004: $0; 2005: $103,320; 2006: -$23,250.
Biggest contracts:
$103,320 with Federal Emergency Management Agency for Lease or Rental of Equipment -- Ground Effect Vehicles, Motor Vehicles, Trailers, and Cycles. Signed on 2005-12-09. Effective on 2005-10-01. Completion date: 2006-09-30.
$6,435 with Federal Emergency Management Agency for Lease or Rental of Facilities -- Other Non-Building Facilities. Signed on 2006-09-22. Effective on 2006-10-01. Completion date: 2006-12-31.
$0 with Federal Emergency Management Agency for Lease or Rental of Equipment -- Ground Effect Vehicles, Motor Vehicles, Trailers, and Cycles. Signed on 2006-04-19. Completion date: 2006-09-30.
-$2,153, same as above.Signed on 2006-08-23. Effective on 2006-04-15. Completion date: 2006-09-30.
ON-SITE ANALYSIS, INC (1708 FAIRWAY DRIVE in PALM BEACH GAR, FL; small business)
$35,000 with Army for Combination and Miscellaneous Instruments. Taking place in NV. Signed on 2005-09-09. Completion date: 2005-09-27.
lee. e. branscome (7338 155th Place North in Palm Beach Gardens, FL; small business)
$30,250 with Offices, Boards and Divisions (includes Attorney General, Deputy Attorney General, etc.) for Expert Witness. Taking place in DC. Signed on 2004-10-25. Completion date: 2005-12-31.
MOST ASSOCIATES LLP (13574 CROSSPOINTE DR in WEST PALM BEAC, FL; small business)
$24,344 with Army for Environmental Chambers and Related Equipment. Signed on 2002-09-05. Completion date: 2002-12-31.
LEPTON WAVE, INC (15816 85TH WAY N in WEST PALM BEAC, FL) : $20,712 in 4 contractsfrom 2005 to 2006
$7,629 with Air Force for Chemical Analysis Instruments. Signed on 2005-09-06. Completion date: 2005-10-06.
$6,344 with Air Force for ADP Software. Signed on 2006-03-21. Completion date: 2006-04-15.
$4,739 with Air Force for Chemical/Biological Studies and Analyses. Signed on 2005-09-07. Completion date: 2005-09-14.
$2,000, same as above.Signed on 2005-09-08. Completion date: 2005-09-14.
INTEGRATED MANAGEMENT SOLUTION (27 VIA DEL CORSO in PALM BEACH GAR, FL; small business)
$10,800 with Air Force for Maintenance, Repair or Alteration of Real Property -- Laboratories and Clinics. Taking place in GA. Signed on 2005-12-18. Completion date: 2006-01-17.
A1 CUSTOM MOUSE PAD IMAGING IN (4521 PGA BLVD STE 384 in PALM BEACH GAR, FL; small business) : $6,675 in 2 contractsfrom 2003 to 2004
$4,000 with Army for ADP Supplies. Signed on 2004-04-29. Completion date: 2004-05-12.
$2,675 with Army for ADP Supplies. Taking place in TX. Signed on 2003-05-01. Completion date: 2003-05-15.
A-1 AMERICAN ELECTRIC, INC (15773 85TH AVE N in PALM BEACH GAR, FL; small business)
$2,100 with Navy for Maintenance, Repair or Alteration of Real Property -- Miscellaneous Buildings. Signed on 2004-02-09. Completion date: 2004-03-07.
Top industries in this zip code by the number of employees in 2005:
2002 - 2018 National Fire Incident Reporting System (NFIRS) incidents
According to the data from the years 2002 - 2018 the average number of fires per year is 79. The highest number of reported fire incidents - 180 took place in 2004, and the least - 40 in 2013. The data has a declining trend.
When looking into fire subcategories, the most reports belonged to: Outside Fires (47.1%), and Mobile Property/Vehicle Fires (22.9%).
Fire incident types reported to NFIRS in Zip Code 33418

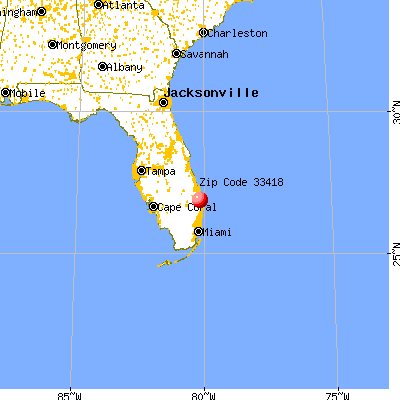


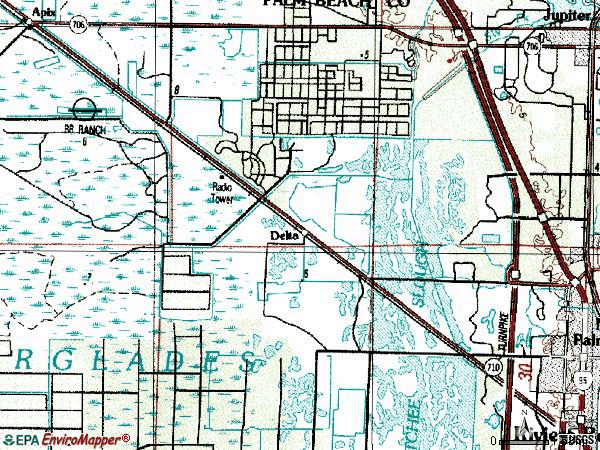
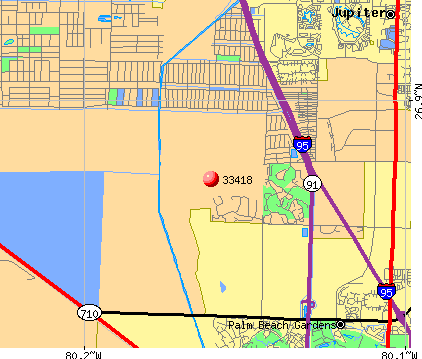 Nearest zip codes: 33458, 33410, 33412, 33477, 33478, 33403.


 According to the data from the years 2002 - 2018 the average number of fires per year is 79. The highest number of reported fire incidents - 180 took place in 2004, and the least - 40 in 2013. The data has a declining trend.
 When looking into fire subcategories, the most reports belonged to: Outside Fires (47.1%), and Mobile Property/Vehicle Fires (22.9%).