Estimated zip code population in 2022: 11,849 Zip code population in 2010: 13,074 Zip code population in 2000: 11,903
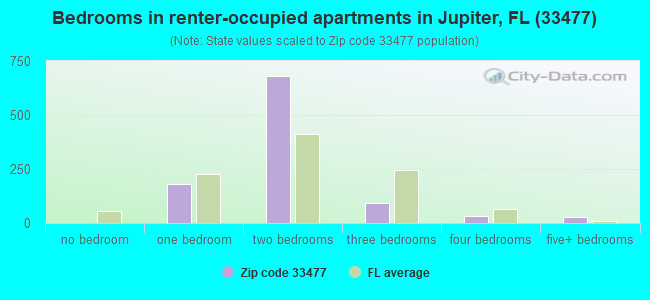
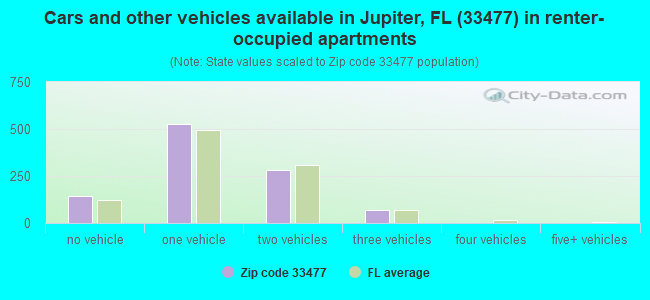
Houses and condos: 11,394 Renter-occupied apartments: 1,018
% of renters here:
15%
State:
33%
March 2022 cost of living index in zip code 33477: 103.8 (near average, U.S. average is 100)
Land area: 6.8 sq. mi. Water area: 1.6 sq. mi.
Population density: 1,753 people per square mile
(low).
OSM Map
General Map
Google Map
MSN Map
OSM Map
General Map
Google Map
MSN Map
OSM Map
General Map
Google Map
MSN Map
OSM Map
General Map
Google Map
MSN Map
Please wait while loading the map...
Real estate property taxes paid for housing units in 2022:
This zip code:
0.8% ($5,171)
Florida:
0.7% ($2,529)
Median real estate property taxes paid for housing units with mortgages in 2022: $4,913 (0.8%) Median real estate property taxes paid for housing units with no mortgage in 2022: $5,250 (0.8%)
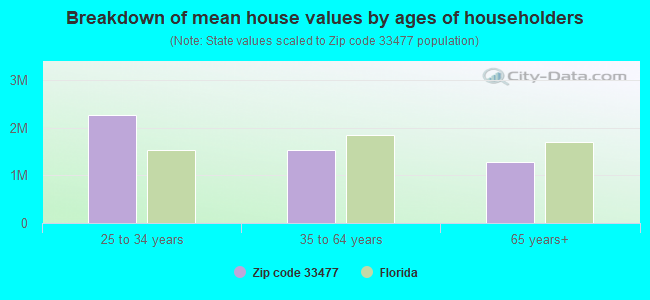
Estimated median house/condo value in 2022: $668,330
33477:
$668,330
Florida:
$354,100
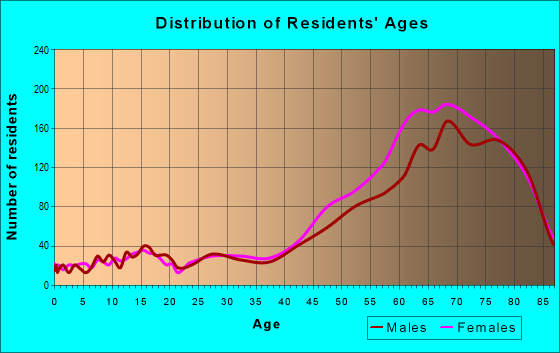
Median resident age:
This zip code:
68.4 years
Florida median age:
42.7 years
Average household size:
This zip code:
1.7 people
Florida:
2.5 people
Averages for the 2020 tax year for zip code 33477, filed in 2021:
Average Adjusted Gross Income (AGI) in 2020: $493,799 (Individual Income Tax Returns)
Here:
$493,799
State:
$82,200
Salary/wage: $201,572 (reported on 49.4% of returns)
Here:
$201,572
State:
$58,347
(% of AGI for various income ranges: 970.6% for AGIs below $25k, 2856.7% for AGIs $25k-50k, 4982.6% for AGIs $50k-75k, 7096.5% for AGIs $75k-100k, 12488.9% for AGIs $100k-200k, 184480.6% for AGIs over 200k)
Taxable interest for individuals: $26,938 (reported on 64.6% of returns)
This zip code:
$26,938
Florida:
$4,272
(% of AGI for various income ranges: 129.8% for AGIs below $25k, 241.5% for AGIs $25k-50k, 435.1% for AGIs $50k-75k, 581.2% for AGIs $75k-100k, 1022.5% for AGIs $100k-200k, 35816.1% for AGIs over 200k)
Ordinary dividends: $77,034 (reported on 62.6% of returns)
Here:
$77,034
State:
$15,863
(% of AGI for various income ranges: 328.4% for AGIs below $25k, 587.9% for AGIs $25k-50k, 1474.3% for AGIs $50k-75k, 1997.3% for AGIs $75k-100k, 3864.4% for AGIs $100k-200k, 96991.6% for AGIs over 200k)
Net capital gain/loss in AGI: +$265,662 (reported on 60.7% of returns)
Here:
+$265,662
State:
+$62,983
(% of AGI for various income ranges: 81.3% for AGIs below $25k, 310.6% for AGIs $25k-50k, 647.7% for AGIs $50k-75k, 1517.3% for AGIs $75k-100k, 3317.8% for AGIs $100k-200k, 355638.1% for AGIs over 200k)
Profit/loss from business: +$48,563 (reported on 18.9% of returns)
Here:
+$48,563
State:
+$9,719
(% of AGI for various income ranges: 289.7% for AGIs below $25k, 405.4% for AGIs $25k-50k, 619.1% for AGIs $50k-75k, 583.1% for AGIs $75k-100k, 1095.8% for AGIs $100k-200k, 16277.4% for AGIs over 200k)
Taxable individual retirement arrangement distribution: $75,974 (reported on 28.0% of returns)
33477:
$75,974
Florida:
$24,823
(% of AGI for various income ranges: 242.1% for AGIs below $25k, 499.6% for AGIs $25k-50k, 1431.7% for AGIs $50k-75k, 1926.9% for AGIs $75k-100k, 3897.1% for AGIs $100k-200k, 36558.4% for AGIs over 200k)
Self-employed (Keogh) retirement plans: $44,050 (reported on 2.3% of returns)
33477:
$44,050
Florida:
$29,694
(% of AGI for various income ranges: 33.5% for AGIs below $25k, 94.0% for AGIs $100k-200k, 2038.7% for AGIs over 200k)
Total itemized deductions: $126,919 (reported on 26.9% of returns)
Here:
$126,919
State:
$45,393
(% of AGI for various income ranges: 357.1% for AGIs below $25k, 750.8% for AGIs $25k-50k, 1613.1% for AGIs $50k-75k, 1727.3% for AGIs $75k-100k, 2503.6% for AGIs $100k-200k, 67272.9% for AGIs over 200k)
Charity contributions: $80,201 (reported on 24.6% of returns)
Here:
$80,201
State:
$20,178
(% of AGI for various income ranges: 18.9% for AGIs below $25k, 71.5% for AGIs $25k-50k, 209.4% for AGIs $50k-75k, 268.5% for AGIs $75k-100k, 493.6% for AGIs $100k-200k, 43002.9% for AGIs over 200k)
Taxes paid: $8,363 (reported on 26.9% of returns)
33477:
$8,363
State:
$6,967
(% of AGI for various income ranges: 74.6% for AGIs below $25k, 156.2% for AGIs $25k-50k, 288.9% for AGIs $50k-75k, 385.0% for AGIs $75k-100k, 588.9% for AGIs $100k-200k, 2964.5% for AGIs over 200k)
Earned income credit: $1,281 (reported on 3.7% of returns)
Here:
$1,281
State:
$2,306
(% of AGI for various income ranges: 38.4% for AGIs below $25k, 17.5% for AGIs $25k-50k)
Percentage of individuals using paid preparers for their 2020 taxes: 91.4%
Here:
91%
State:
92%
(% for various income ranges: 88.9% for AGIs below $25k, 89.4% for AGIs $25k-50k, 91.2% for AGIs $50k-75k, 92.2% for AGIs $75k-100k, 92.5% for AGIs $100k-200k, 93.3% for AGIs over 200k)
Averages for the 2012 tax year for zip code 33477, filed in 2013:
Average Adjusted Gross Income (AGI) in 2012: $277,795 (Individual Income Tax Returns)
Here:
$277,795
State:
$60,316
Salary/wage: $129,497 (reported on 51.0% of returns)
Here:
$129,497
State:
$45,277
(% of AGI for various income ranges: 43.9% for AGIs below $25k, 48.8% for AGIs $25k-50k, 40.8% for AGIs $50k-75k, 34.6% for AGIs $75k-100k, 33.6% for AGIs $100k-200k, 20.7% for AGIs over 200k)
Taxable interest for individuals: $22,333 (reported on 64.0% of returns)
This zip code:
$22,333
Florida:
$3,587
(% of AGI for various income ranges: 6.9% for AGIs below $25k, 3.5% for AGIs $25k-50k, 3.1% for AGIs $50k-75k, 3.3% for AGIs $75k-100k, 3.6% for AGIs $100k-200k, 5.5% for AGIs over 200k)
Ordinary dividends: $48,302 (reported on 57.4% of returns)
Here:
$48,302
State:
$12,831
(% of AGI for various income ranges: 12.7% for AGIs below $25k, 8.0% for AGIs $25k-50k, 7.7% for AGIs $50k-75k, 8.6% for AGIs $75k-100k, 10.2% for AGIs $100k-200k, 10.1% for AGIs over 200k)
Net capital gain/loss in AGI: +$150,141 (reported on 54.6% of returns)
Here:
+$150,141
State:
+$33,493
(% of AGI for various income ranges: 0.6% for AGIs $25k-50k, 2.2% for AGIs $50k-75k, 2.1% for AGIs $75k-100k, 5.5% for AGIs $100k-200k, 35.3% for AGIs over 200k)
Profit/loss from business: +$49,826 (reported on 17.5% of returns)
Here:
+$49,826
State:
+$10,012
(% of AGI for various income ranges: 11.2% for AGIs below $25k, 5.5% for AGIs $25k-50k, 3.2% for AGIs $50k-75k, 3.6% for AGIs $75k-100k, 3.6% for AGIs $100k-200k, 2.9% for AGIs over 200k)
Taxable individual retirement arrangement distribution: $55,176 (reported on 34.5% of returns)
33477:
$55,176
Florida:
$21,544
(% of AGI for various income ranges: 11.6% for AGIs below $25k, 8.0% for AGIs $25k-50k, 10.3% for AGIs $50k-75k, 11.0% for AGIs $75k-100k, 13.9% for AGIs $100k-200k, 5.7% for AGIs over 200k)
Self-employment retirement plans: $26,933 (reported on 1.4% of returns)
33477:
$26,933
Florida:
$20,611
(% of AGI for various income ranges: 0.7% for AGIs $25k-50k, 0.2% for AGIs $100k-200k, 0.1% for AGIs over 200k)
Total itemized deductions: $70,181 (15% of AGI, reported on 54.3% of returns)
Here:
$70,181
State:
$25,533
Here:
15.0% of AGI
State:
18.0% of AGI
(% of AGI for various income ranges: 37.6% for AGIs below $25k, 20.0% for AGIs $25k-50k, 19.3% for AGIs $50k-75k, 17.6% for AGIs $75k-100k, 17.6% for AGIs $100k-200k, 12.5% for AGIs over 200k)
Charity contributions: $21,788 (reported on 47.9% of returns)
Here:
$21,788
State:
$5,698
(% of AGI for various income ranges: 2.2% for AGIs below $25k, 1.6% for AGIs $25k-50k, 1.8% for AGIs $50k-75k, 1.8% for AGIs $75k-100k, 2.4% for AGIs $100k-200k, 4.1% for AGIs over 200k)
Taxes paid: $23,008 (reported on 53.7% of returns)
33477:
$23,008
State:
$6,203
(% of AGI for various income ranges: 9.9% for AGIs below $25k, 5.2% for AGIs $25k-50k, 5.8% for AGIs $50k-75k, 5.9% for AGIs $75k-100k, 6.6% for AGIs $100k-200k, 4.0% for AGIs over 200k)
Earned income credit: $1,497 (reported on 4.5% of returns)
Here:
$1,497
State:
$2,372
(% of AGI for various income ranges: 2.0% for AGIs below $25k, 0.2% for AGIs $25k-50k)
Percentage of individuals using paid preparers for their 2012 taxes: 69.9%
Here:
70%
State:
54%
(% for various income ranges: 59.9% for AGIs below $25k, 63.0% for AGIs $25k-50k, 68.2% for AGIs $50k-75k, 68.9% for AGIs $75k-100k, 73.5% for AGIs $100k-200k, 89.9% for AGIs over 200k)
Averages for the 2004 tax year for zip code 33477, filed in 2005:
Average Adjusted Gross Income (AGI) in 2004: $223,499 (Individual Income Tax Returns)
Here:
$223,499
State:
$50,523
Salary/wage: $89,899 (reported on 52.1% of returns)
Here:
$89,899
State:
$39,563
(% of AGI for various income ranges: 42.6% for AGIs $10k-25k, 46.5% for AGIs $25k-50k, 40.9% for AGIs $50k-75k, 38.8% for AGIs $75k-100k, 17.4% for AGIs over 100k)
Taxable interest for individuals: $19,477 (reported on 75.2% of returns)
This zip code:
$19,477
Florida:
$3,211
(% of AGI for various income ranges: 10.1% for AGIs $10k-25k, 6.7% for AGIs $25k-50k, 5.9% for AGIs $50k-75k, 6.0% for AGIs $75k-100k, 6.3% for AGIs over 100k)
Taxable dividends: $25,970 (reported on 63.5% of returns)
Here:
$25,970
State:
$6,129
(% of AGI for various income ranges: 9.6% for AGIs $10k-25k, 7.9% for AGIs $25k-50k, 6.8% for AGIs $50k-75k, 8.3% for AGIs $75k-100k, 7.0% for AGIs over 100k)
Net capital gain/loss: +$163,942 (reported on 59.5% of returns)
Here:
+$163,942
State:
+$27,205
(% of AGI for various income ranges: -3.4% for AGIs $10k-25k, 1.6% for AGIs $25k-50k, 3.1% for AGIs $50k-75k, 6.2% for AGIs $75k-100k, 48.0% for AGIs over 100k)
Profit/loss from business: +$33,105 (reported on 17.6% of returns)
Here:
+$33,105
State:
+$10,634
(% of AGI for various income ranges: 7.8% for AGIs $10k-25k, 6.1% for AGIs $25k-50k, 4.1% for AGIs $50k-75k, 3.7% for AGIs $75k-100k, 2.3% for AGIs over 100k)
IRA payment deduction: $3,772 (reported on 4.2% of returns)
33477:
$3,772
Florida:
$3,082
(% of AGI for various income ranges: 0.5% for AGIs $10k-25k, 0.5% for AGIs $25k-50k, 0.3% for AGIs $50k-75k, 0.3% for AGIs $75k-100k, 0.0% for AGIs over 100k)
Self-employed pension: $19,816 (reported on 2.3% of returns)
Here:
$19,816
Florida:
$15,857
Total itemized deductions: $43,008 (12% of AGI, reported on 57.7% of returns)
Here:
$43,008
State:
$20,370
Here:
12.5% of AGI
State:
20.7% of AGI
(% of AGI for various income ranges: 36.2% for AGIs $10k-25k, 27.3% for AGIs $25k-50k, 20.6% for AGIs $50k-75k, 20.7% for AGIs $75k-100k, 9.0% for AGIs over 100k)
Charity contributions deductions: $11,021 (3% of AGI, reported on 53.3% of returns)
Here:
$11,021
State:
$4,064
Here:
3.0% of AGI
State:
3.8% of AGI
(% of AGI for various income ranges: 2.7% for AGIs $10k-25k, 2.7% for AGIs $25k-50k, 2.5% for AGIs $50k-75k, 2.9% for AGIs $75k-100k, 2.6% for AGIs over 100k)
Total tax: $51,791 (reported on 82.2% of returns)
33477:
$51,791
State:
$9,431
(% of AGI for various income ranges: 4.2% for AGIs $10k-25k, 7.5% for AGIs $25k-50k, 10.4% for AGIs $50k-75k, 11.2% for AGIs $75k-100k, 19.9% for AGIs over 100k)
Earned income credit: $902 (reported on 3.5% of returns)
Here:
$902
State:
$1,808
Percentage of individuals using paid preparers for their 2004 taxes: 72.2%
Here:
72%
State:
60%
(% for various income ranges: 68.6% for AGIs below $10k, 65.5% for AGIs $10k-25k, 66.3% for AGIs $25k-50k, 71.1% for AGIs $50k-75k, 69.3% for AGIs $75k-100k, 83.4% for AGIs over 100k)
Likely homosexual households (counted as self-reported same-sex unmarried-partner households)
Lesbian couples: 0.0% of all households
Gay men: 0.0% of all households
Household received Food Stamps/SNAP in the past 12 months: 139 Household did not receive Food Stamps/SNAP in the past 12 months: 6,793
Women who had a birth in the past 12 months: 19 (20 now married, 0 unmarried) Women who did not have a birth in the past 12 months: 941 (284 now married, 656 unmarried)
Housing units in zip code 33477 with a mortgage: 2,186 (199 second mortgage, 183 both second mortgage and home equity loan) Houses without a mortgage: 83
Median monthly owner costs for units with a mortgage: $2,503 Median monthly owner costs for units without a mortgage: $1,238
Residents with income below the poverty level in 2022:
This zip code:
7.9%
Whole state:
12.7%
Residents with income below 50% of the poverty level in 2022:
This zip code:
3.4%
Whole state:
6.6%
Median number of rooms in houses and condos:
Here:
5.3
State:
5.9
Median number of rooms in apartments:
Here:
4.2
State:
4.2
Notable locations in this zip code not listed on our city pages
Notable locations in zip code 33477: Gallery Square North and South (A), Palm Beach County Fire Rescue Station 18 (B). Display/hide their locations on the map
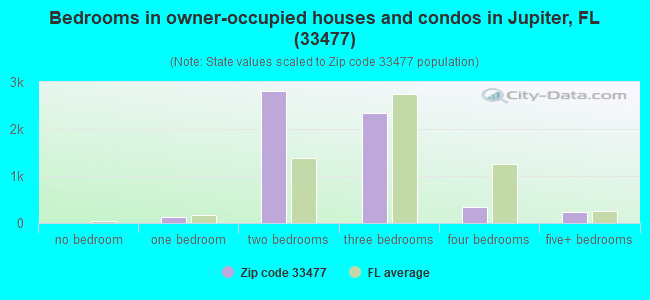
Size of family households: 2,878 2-persons, 222 3-persons, 217 4-persons, 47 5-persons, 64 7-or-more-persons
Size of nonfamily households: 3,064 1-person, 391 2-persons
287 married couples with children.
87 single-parent households (56 men, 31 women).
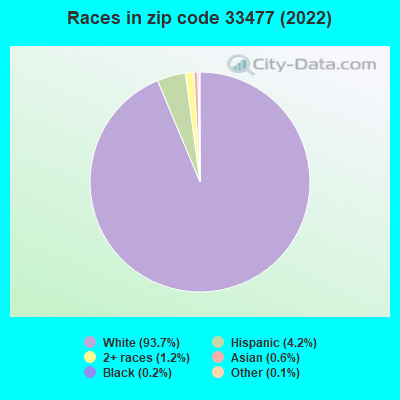
91.4% of residents of 33477 zip code speak English at home.
4.0% of residents speak Spanish at home (81% very well, 16% well, 3% not well).
5.0% of residents speak other Indo-European language at home (79% very well, 19% well, 2% not well).
0.2% of residents speak Asian or Pacific Island language at home (50% very well, 38% well, 12% not well).
0.4% of residents speak other language at home (100% very well).
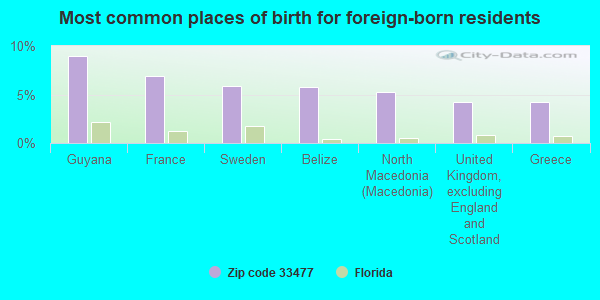
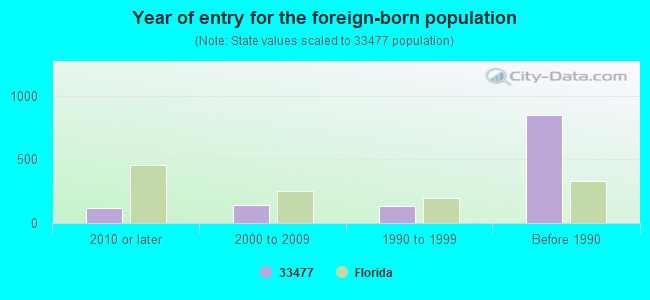
Foreign born population: 1,267 (10.7%) (58.5% of them are naturalized citizens)
This zip code:
10.7%
Whole state:
21.7%
9%Guyana
7%France
6%Sweden
6%Belize
5%North Macedonia (Macedonia)
4%United Kingdom, excluding England and Scotland
4%Greece
18%Italian
13%German
13%Irish
8%American
7%English
5%Polish
4%Greek
Year of entry for the foreign-born population
1142010 or later
1402000 to 2009
1301990 to 1999
849Before 1990
Facilities with environmental interests located in this zip code:
MANGROVE BAY PHASE II (S7&8/T41S/R43E in JUPITER, FL)
National Pollutant Discharge Elimination System NON-MAJOR (Tracking pollutant discharge elimination systems) - permit Organizations: ROBERT CANTERBURY (CONTACT/OWNER)
ABACOA EXECUTIVE CENTER (NW CORNER OF FREDRICK SMALL RD in JUPITER, FL)
National Pollutant Discharge Elimination System NON-MAJOR (Tracking pollutant discharge elimination systems) - permit Organizations: STEVEN MULLER (CONTACT/OWNER)
INTRACOASTAL POINTE (INTRACOASTAL POINTE DR in JUPITER, FL)
National Pollutant Discharge Elimination System NON-MAJOR (Tracking pollutant discharge elimination systems) - permit Organizations: KENT ILMERING (CONTACT/OWNER)
JUPITER SEASPORT MARINA (1095 N A1A in JUPITER, FL)
(Resource Conservation and Recovery Act (tracking hazardous waste)) Business NAICS classification: BOAT DEALERS. Organizations: DAVID HANES (CONTACT/OWNER)
ADMIRALS COVE WEST GOLF COURSE (INTERSECTION OF GOLF VILLAGE B in JUPITER, FL)
National Pollutant Discharge Elimination System NON-MAJOR (Tracking pollutant discharge elimination systems) - permit
AMOCO SERVICE STATION #60080 (2508 INDIANTOWN RD in JUPITER, FL)
Small Quantity Generators, between 100 kg and 1000 kg of hazardous waste/month (Resource Conservation and Recovery Act (tracking hazardous waste)) - notification Organizations: ACA MGMNT SERV, DEALER (CONTACT/OWNER)
JUPITER CHEVRON SERVICE INC (3 N ALTERNATE A1A in JUPITER, FL)
Small Quantity Generators, between 100 kg and 1000 kg of hazardous waste/month (Resource Conservation and Recovery Act (tracking hazardous waste)) - notification Organizations: WILLIAM BARRY LUNSFORD, DEALER (CONTACT/OWNER)
JUPITER SQUARE DRY CLEANERS (103 N US HWY H1 in JUPITER, FL)
Small Quantity Generators, between 100 kg and 1000 kg of hazardous waste/month (Resource Conservation and Recovery Act (tracking hazardous waste)) - notification Organizations: CHUNG KO, OWNER (CONTACT/OWNER)
MOBIL OIL CORP SS# BG2 (151 US HWY 1 in JUPITER, FL)
Small Quantity Generators, between 100 kg and 1000 kg of hazardous waste/month (Resource Conservation and Recovery Act (tracking hazardous waste)) - notification Organizations: DAN HORTON (CONTACT/OWNER)
Housing units lacking complete plumbing facilities: 0.4% Housing units lacking complete kitchen facilities: 0.4%
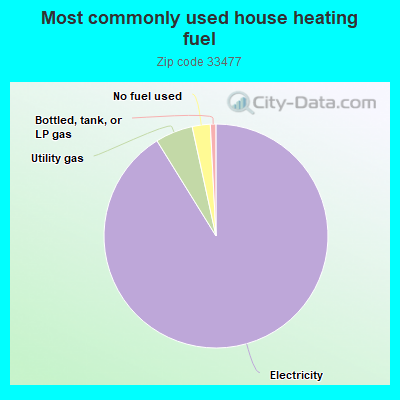
91.0%Electricity
5.4%Utility gas
2.6%No fuel used
0.8%Bottled, tank, or LP gas
Population in 1990: 7,748. Population change in the 1990s: +4,155 (+53.6%).
Place of birth for U.S.-born residents:
This state: 1,673
Northeast: 5,967
Midwest: 1,382
South: 1,077
West: 460
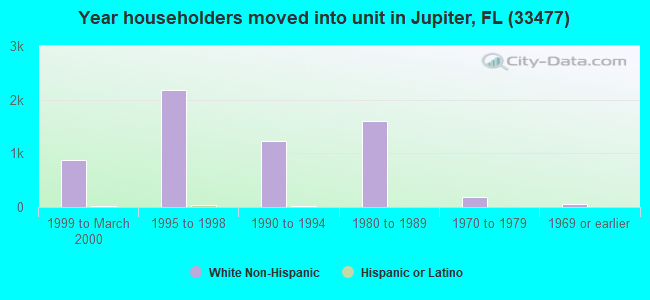
54% of the 33477 zip code residents lived in the same house 5 years ago. Out of people who lived in different houses, 40% lived in this county. Out of people who lived in different counties, 50% lived in Florida.
88% of the 33477 zip code residents lived in the same house 1 year ago. Out of people who lived in different houses, 43% moved from this county. Out of people who lived in different houses, 11% moved from different county within same state. Out of people who lived in different houses, 44% moved from different state. Out of people who lived in different houses, 1% moved from abroad.
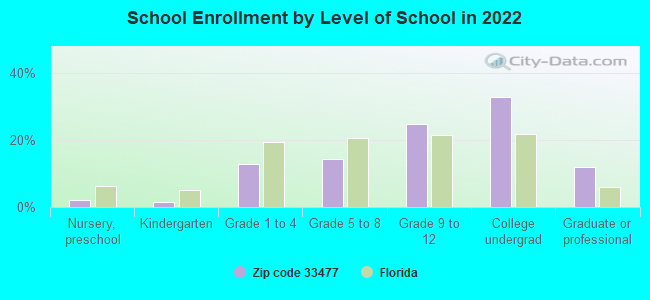
Private vs. public school enrollment:
Students in private schools in grades 1 to 8 (elementary and middle school): 55
Here:
22.3%
Florida:
15.8%
Students in private schools in grades 9 to 12 (high school): 50
Here:
22.3%
Florida:
12.9%
Students in private undergraduate colleges: 21
Here:
7.3%
Florida:
23.6%
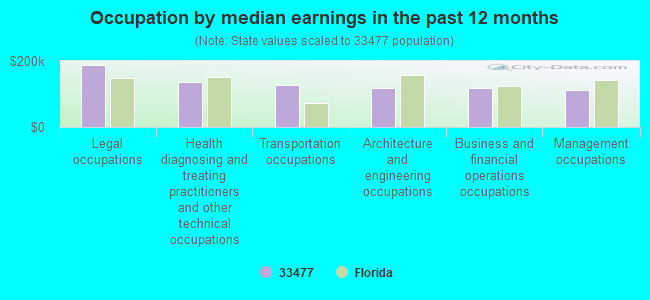
Occupation by median earnings in the past 12 months ($)
189,321Legal occupations
135,503Health diagnosing and treating practitioners and other technical occupations
126,100Transportation occupations
118,137Architecture and engineering occupations
117,309Business and financial operations occupations
110,864Management occupations
Companies with federal contracts located in this zip code (JUPITER, FL):
CONTINENTAL SHELF ASSOCIATES, (759 PARKWAY) : $15,015,958 in 52 contractsfrom 1999 to 2006
Contracts for Marine Architect and Engineering Services, Oceanological Studies, Other Special Studies and Analyses, Environmental Studies and Assessments, and moreby Navy, Minerals Management Service, Geological Survey, National Oceanic and Atmospheric Administration/Under Secretary for Oceans and Atmosphere, and others Signed by year:2000: $5,034,762; 2001: $932,439; 2002: $278,000; 2003: $8,301,835; 2004: $15,255; 2005: $43,667; 2006: $225,000.
Biggest contracts:
$5,850,000 with Navy for Marine Architect and Engineering Services. Signed on 2003-09-26. Completion date: 2004-09-23.
$3,182,000 with Minerals Management Service for Oceanological Studies. Signed on 2000-07-15. Completion date: 2002-06-15.
$1,399,998 with Minerals Management Service for Other Special Studies and Analyses. Signed on 2003-09-15. Completion date: 2006-10-15.
$648,791 with Navy for Marine Architect and Engineering Services. Signed on 2003-06-18. Completion date: 2004-01-18.
FLORIDA TURBINE TECHNOLOGIES (140 INTRACOASTAL POINTE DR; small business) : $5,513,665 in 17 contractsfrom 2000 to 2006
Contracts for Defense Missile and Space Systems -- Advanced Development (R&D), Defense Aircraft -- Applied Research and Exploratory Development (R&D), Engineering and Technical Services, Defense Missile and Space Systems -- Basic Research (R&D), and moreby Army, Air Force, NASA Signed by year:2000: $49,000; 2001: $0; 2002: $0; 2003: $324,698; 2004: $804,116; 2005: $2,023,377; 2006: $2,312,474.
Biggest contracts:
$2,200,000 with Army for Defense Missile and Space Systems -- Advanced Development (R&D). Signed on 2006-04-13. Completion date: 2006-09-30.
$1,655,208, same as above.Signed on 2005-10-14. Completion date: 2009-09-30.
$269,000 with Air Force for Defense Aircraft -- Applied Research and Exploratory Development (R&D). Signed on 2005-11-03. Completion date: 2011-09-30.
$249,968 with Army for Defense Missile and Space Systems -- Advanced Development (R&D). Signed on 2004-10-27. Completion date: 2005-09-30.
CZR INCORPORATED (1061 EAST INDIANTOWN ROAD; small business) : $4,351,444 in 38 contractsfrom 1999 to 2004
Contracts for Other Architect and Engineering Services, Architect - Engineer Services (including landscaping, interior layout, and designing), Environmental Studies and Assessments, Other Environmental Services, Studies, and Analytical Support by Navy, U.S. Army Corps of Engineers - civil program financing only, Army Signed by year:2000: $215,871; 2001: $312,771; 2002: $1,568,111; 2003: $776,056; 2004: $999,528; 2005: $0; 2006: $0.
Biggest contracts:
$1,074,961 with Navy for Other Architect and Engineering Services. Signed on 2002-07-17. Completion date: 2003-05-23.
$323,976 with Navy for Architect - Engineer Services (including landscaping, interior layout, and designing). Taking place in DC. Signed on 2004-08-09. Completion date: 2004-09-30.
$307,296 with U.S. Army Corps of Engineers - civil program financing only for Environmental Studies and Assessments. Taking place in NC. Signed on 1999-11-22. Completion date: 2000-09-30.
$255,469 with Navy for Architect - Engineer Services (including landscaping, interior layout, and designing). Taking place in SC. Signed on 2004-09-24. Completion date: 2005-09-30.
FATIGUE MANAGEMENT ASSOC LLC (1000 NORTH US HWY 1, SUITE; small business) : $1,264,011 in 5 contractsfrom 2000 to 2003
Contracts for Other Defense -- Management and Support (R&D) by Air Force Signed by year:2000: $899,499; 2001: $349,512; 2002: $0; 2003: $15,000; 2004: $0; 2005: $0; 2006: $0.
Biggest contracts:
$600,000 with Air Force for Other Defense -- Management and Support (R&D). Taking place in CA. Signed on 2000-02-03. Completion date: 2001-02-01.
$349,512, same as above.Signed on 2001-03-12. Completion date: 2002-04-23.
$249,499, same as above.Signed on 2000-05-10. Completion date: 2001-02-01.
$50,000, same as above.Signed on 2000-02-29. Completion date: 2001-02-01.
NATIONAL GOLF FOUNDATION INC (1150 S US HIGHWAY 1 # 401) : $28,240 in 3 contractsfrom 2004 to 2005
$49,000 with Rural Housing Service for Feasibility Studies (non-construction). Signed on 2004-07-01. Completion date: 2005-06-30.
$23,000 with Navy for Feasibility Studies (non-construction). Taking place in GA. Signed on 2005-09-07. Completion date: 2005-11-01.
-$43,760 with Rural Housing Service for Feasibility Studies (non-construction). Signed on 2005-08-01. Effective on 2005-01-07. Completion date: 2005-06-29.
JUPITER INN COMPANY LTD (5 N A1A) : $9,717 in 2 contractsin 2003
$4,926 with Army for Lodging - Hotel/Motel. Signed on 2003-08-14. Completion date: 2003-08-15.
$4,791, same as above.Signed on 2003-08-22. Completion date: 2003-08-15.
Top industries in this zip code by the number of employees in 2005:
Management of Companies and Enterprises: Offices of Other Holding Companies (over 1000 employees: 1 establishment)
Arts, Entertainment, and Recreation: Golf Courses and Country Clubs (250-499: 1, 100-249: 1, 1-4: 1)
Accommodation and Food Services: Hotels (except Casino Hotels) and Motels (100-249: 1, 50-99: 1, 20-49: 1, 1-4: 1)
Professional, Scientific, and Technical Services: Research and Development in the Physical, Engineering, and Life Sciences (50-99: 1, 20-49: 1, 10-19: 2)
Accommodation and Food Services: Snack and Nonalcoholic Beverage Bars (20-49: 4)
Real Estate and Rental and Leasing: Offices of Real Estate Agents and Brokers (20-49: 1, 5-9: 3, 1-4: 36)
Management of Companies and Enterprises: Corporate, Subsidiary, and Regional Managing Offices (20-49: 3, 10-19: 1, 5-9: 1)
Health Care and Social Assistance: Offices of Physicians (except Mental Health Specialists) (10-19: 2, 5-9: 8, 1-4: 11)
Fatal accident statistics in 2014:
Fatal accident count: 1
Vehicles involved in fatal accidents: 2
Fatal accidents caused by drunken drivers: 0
Fatalities: 1
Persons involved in fatal accidents: 2
Pedestrians involved in fatal accidents: 0
Fatal accident statistics in 2013:
Fatal accident count: 1
Vehicles involved in fatal accidents: 1
Fatal accidents caused by drunken drivers: 0
Fatalities: 1
Persons involved in fatal accidents: 1
Pedestrians involved in fatal accidents: 0
Home Mortgage Disclosure Act Aggregated Statistics For Year 2009 (Based on 8 partial tracts)
A) FHA, FSA/RHS & VA Home Purchase Loans
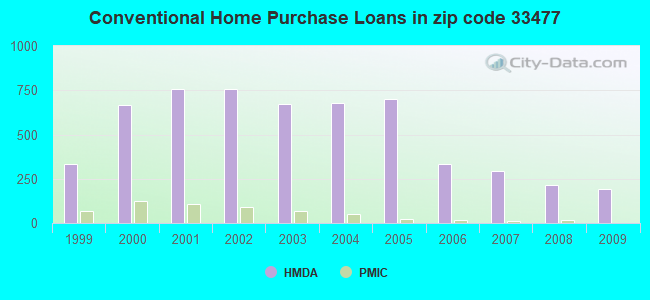
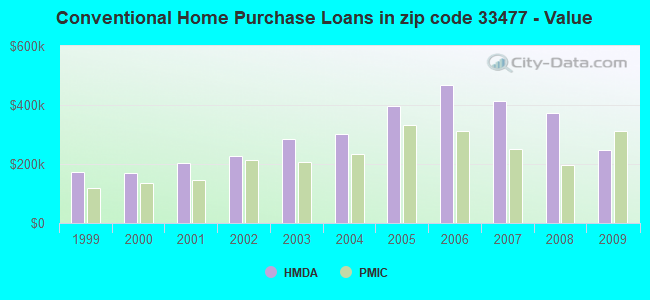
B) Conventional Home Purchase Loans
C) Refinancings
D) Home Improvement Loans
F) Non-occupant Loans on < 5 Family Dwellings (A B C & D)
G) Loans On Manufactured Home Dwelling (A B C & D)
Number
Average Value
Number
Average Value
Number
Average Value
Number
Average Value
Number
Average Value
Number
Average Value
LOANS ORIGINATED
8
$260,836
191
$248,950
294
$298,786
12
$149,216
213
$269,541
2
$16,670
APPLICATIONS APPROVED, NOT ACCEPTED
1
$192,210
11
$196,655
41
$286,578
0
$0
20
$212,731
0
$0
APPLICATIONS DENIED
6
$192,683
51
$205,708
173
$302,973
7
$77,046
85
$257,676
8
$94,410
APPLICATIONS WITHDRAWN
2
$262,960
22
$237,865
70
$266,291
0
$0
34
$309,991
2
$126,690
FILES CLOSED FOR INCOMPLETENESS
0
$0
4
$133,210
7
$374,876
0
$0
6
$156,263
0
$0
Aggregated Statistics For Year 2008 (Based on 8 partial tracts)
A) FHA, FSA/RHS & VA Home Purchase Loans
B) Conventional Home Purchase Loans
C) Refinancings
D) Home Improvement Loans
F) Non-occupant Loans on < 5 Family Dwellings (A B C & D)
G) Loans On Manufactured Home Dwelling (A B C & D)
Number
Average Value
Number
Average Value
Number
Average Value
Number
Average Value
Number
Average Value
Number
Average Value
LOANS ORIGINATED
10
$181,892
215
$374,287
177
$323,906
12
$326,181
206
$313,124
10
$73,884
APPLICATIONS APPROVED, NOT ACCEPTED
0
$0
35
$272,079
39
$296,489
1
$235,840
40
$218,488
0
$0
APPLICATIONS DENIED
2
$273,520
24
$297,078
101
$418,771
5
$74,480
40
$281,755
5
$58,622
APPLICATIONS WITHDRAWN
3
$205,903
31
$227,817
56
$453,336
2
$156,635
35
$223,059
2
$37,505
FILES CLOSED FOR INCOMPLETENESS
0
$0
10
$178,907
21
$264,710
0
$0
11
$229,715
0
$0
Aggregated Statistics For Year 2007 (Based on 8 partial tracts)
B) Conventional Home Purchase Loans
C) Refinancings
D) Home Improvement Loans
F) Non-occupant Loans on < 5 Family Dwellings (A B C & D)
G) Loans On Manufactured Home Dwelling (A B C & D)
Number
Average Value
Number
Average Value
Number
Average Value
Number
Average Value
Number
Average Value
LOANS ORIGINATED
291
$411,984
338
$340,737
21
$270,711
279
$333,733
4
$117,912
APPLICATIONS APPROVED, NOT ACCEPTED
30
$378,952
122
$238,650
9
$172,842
45
$231,087
5
$144,362
APPLICATIONS DENIED
51
$392,203
172
$413,922
20
$124,306
69
$274,294
7
$121,929
APPLICATIONS WITHDRAWN
22
$598,435
80
$391,261
6
$373,545
22
$247,036
2
$33,340
FILES CLOSED FOR INCOMPLETENESS
8
$295,111
27
$296,385
3
$1,163,260
12
$195,615
0
$0
Aggregated Statistics For Year 2006 (Based on 8 partial tracts)
B) Conventional Home Purchase Loans
C) Refinancings
D) Home Improvement Loans
F) Non-occupant Loans on < 5 Family Dwellings (A B C & D)
G) Loans On Manufactured Home Dwelling (A B C & D)
Number
Average Value
Number
Average Value
Number
Average Value
Number
Average Value
Number
Average Value
LOANS ORIGINATED
331
$468,045
462
$335,661
43
$146,156
333
$391,176
6
$81,787
APPLICATIONS APPROVED, NOT ACCEPTED
38
$536,850
102
$272,500
16
$175,841
42
$376,880
2
$48,345
APPLICATIONS DENIED
33
$563,150
156
$366,179
19
$189,981
65
$326,209
5
$79,056
APPLICATIONS WITHDRAWN
16
$665,808
138
$306,367
3
$83,080
38
$305,403
0
$0
FILES CLOSED FOR INCOMPLETENESS
19
$524,235
44
$395,155
2
$41,675
20
$419,747
0
$0
Aggregated Statistics For Year 2005 (Based on 8 partial tracts)
B) Conventional Home Purchase Loans
C) Refinancings
D) Home Improvement Loans
F) Non-occupant Loans on < 5 Family Dwellings (A B C & D)
G) Loans On Manufactured Home Dwelling (A B C & D)
Number
Average Value
Number
Average Value
Number
Average Value
Number
Average Value
Number
Average Value
LOANS ORIGINATED
698
$397,171
566
$318,809
37
$151,542
602
$337,925
2
$137,965
APPLICATIONS APPROVED, NOT ACCEPTED
54
$343,543
76
$327,660
5
$79,968
54
$320,861
4
$88,842
APPLICATIONS DENIED
92
$338,854
164
$375,128
21
$127,572
80
$340,680
1
$119,100
APPLICATIONS WITHDRAWN
64
$453,142
112
$346,107
7
$126,643
51
$310,973
0
$0
FILES CLOSED FOR INCOMPLETENESS
16
$309,427
70
$281,661
1
$76,650
13
$234,098
0
$0
Aggregated Statistics For Year 2004 (Based on 8 partial tracts)
A) FHA, FSA/RHS & VA Home Purchase Loans
B) Conventional Home Purchase Loans
C) Refinancings
D) Home Improvement Loans
E) Loans on Dwellings For 5+ Families
F) Non-occupant Loans on < 5 Family Dwellings (A B C & D)
G) Loans On Manufactured Home Dwelling (A B C & D)
Number
Average Value
Number
Average Value
Number
Average Value
Number
Average Value
Number
Average Value
Number
Average Value
Number
Average Value
LOANS ORIGINATED
1
$251,170
678
$303,255
619
$236,709
34
$180,771
2
$545,030
620
$252,679
5
$29,236
APPLICATIONS APPROVED, NOT ACCEPTED
0
$0
68
$419,548
112
$288,879
9
$112,073
0
$0
74
$295,225
0
$0
APPLICATIONS DENIED
0
$0
105
$413,604
168
$247,046
23
$135,921
0
$0
89
$279,016
5
$33,390
APPLICATIONS WITHDRAWN
0
$0
73
$468,564
124
$236,839
10
$95,215
2
$95,020
64
$275,954
0
$0
FILES CLOSED FOR INCOMPLETENESS
0
$0
30
$431,240
58
$223,709
3
$168,510
0
$0
15
$213,809
1
$101,410
Aggregated Statistics For Year 2003 (Based on 8 partial tracts)
A) FHA, FSA/RHS & VA Home Purchase Loans
B) Conventional Home Purchase Loans
C) Refinancings
D) Home Improvement Loans
E) Loans on Dwellings For 5+ Families
F) Non-occupant Loans on < 5 Family Dwellings (A B C & D)
Number
Average Value
Number
Average Value
Number
Average Value
Number
Average Value
Number
Average Value
Number
Average Value
LOANS ORIGINATED
5
$123,496
675
$285,337
1,522
$199,181
27
$57,997
2
$83,350
796
$229,132
APPLICATIONS APPROVED, NOT ACCEPTED
0
$0
78
$288,767
190
$164,565
6
$68,388
0
$0
73
$171,770
APPLICATIONS DENIED
2
$150,945
79
$242,891
273
$195,357
26
$50,983
0
$0
86
$208,722
APPLICATIONS WITHDRAWN
0
$0
64
$394,270
161
$214,790
4
$45,835
0
$0
65
$325,409
FILES CLOSED FOR INCOMPLETENESS
0
$0
31
$236,666
74
$230,548
3
$86,127
0
$0
35
$235,562
Aggregated Statistics For Year 2002 (Based on 8 partial tracts)
A) FHA, FSA/RHS & VA Home Purchase Loans
B) Conventional Home Purchase Loans
C) Refinancings
D) Home Improvement Loans
F) Non-occupant Loans on < 5 Family Dwellings (A B C & D)
Number
Average Value
Number
Average Value
Number
Average Value
Number
Average Value
Number
Average Value
LOANS ORIGINATED
3
$131,820
759
$226,170
1,084
$264,371
29
$65,086
671
$299,372
APPLICATIONS APPROVED, NOT ACCEPTED
1
$159,190
83
$294,243
144
$225,558
6
$41,813
70
$221,679
APPLICATIONS DENIED
0
$0
48
$253,429
161
$192,575
21
$74,019
40
$232,590
APPLICATIONS WITHDRAWN
0
$0
48
$205,292
126
$296,270
5
$86,184
42
$190,868
FILES CLOSED FOR INCOMPLETENESS
1
$148,580
18
$185,076
60
$223,969
0
$0
15
$158,517
Aggregated Statistics For Year 2001 (Based on 8 partial tracts)
A) FHA, FSA/RHS & VA Home Purchase Loans
B) Conventional Home Purchase Loans
C) Refinancings
D) Home Improvement Loans
F) Non-occupant Loans on < 5 Family Dwellings (A B C & D)
Number
Average Value
Number
Average Value
Number
Average Value
Number
Average Value
Number
Average Value
LOANS ORIGINATED
13
$138,781
756
$204,314
700
$188,493
36
$61,702
486
$191,760
APPLICATIONS APPROVED, NOT ACCEPTED
0
$0
67
$206,955
72
$194,241
6
$22,782
34
$212,120
APPLICATIONS DENIED
1
$140,320
61
$167,049
121
$202,558
13
$73,841
50
$191,480
APPLICATIONS WITHDRAWN
0
$0
52
$236,387
91
$185,589
3
$37,610
30
$223,960
FILES CLOSED FOR INCOMPLETENESS
0
$0
15
$210,395
45
$160,067
2
$21,435
7
$170,181
Aggregated Statistics For Year 2000 (Based on 8 partial tracts)
A) FHA, FSA/RHS & VA Home Purchase Loans
B) Conventional Home Purchase Loans
C) Refinancings
D) Home Improvement Loans
F) Non-occupant Loans on < 5 Family Dwellings (A B C & D)
Number
Average Value
Number
Average Value
Number
Average Value
Number
Average Value
Number
Average Value
LOANS ORIGINATED
5
$109,902
664
$168,578
104
$161,770
26
$56,940
283
$161,844
APPLICATIONS APPROVED, NOT ACCEPTED
0
$0
58
$179,661
40
$157,566
17
$32,422
32
$175,175
APPLICATIONS DENIED
0
$0
42
$231,115
66
$132,086
14
$107,281
21
$125,759
APPLICATIONS WITHDRAWN
3
$90,573
58
$188,116
51
$108,579
8
$41,436
18
$206,777
FILES CLOSED FOR INCOMPLETENESS
0
$0
15
$170,652
17
$110,460
1
$70,750
5
$337,336
Aggregated Statistics For Year 1999 (Based on 4 partial tracts)
A) FHA, FSA/RHS & VA Home Purchase Loans
B) Conventional Home Purchase Loans
C) Refinancings
D) Home Improvement Loans
F) Non-occupant Loans on < 5 Family Dwellings (A B C & D)
2005 - 2018 National Fire Incident Reporting System (NFIRS) incidents
According to the data from the years 2005 - 2018 the average number of fire incidents per year is 23. The highest number of fire incidents - 38 took place in 2011, and the least - 4 in 2005. The data has a rising trend.
When looking into fire subcategories, the most reports belonged to: Outside Fires (41.8%), and Structure Fires (31.0%).
Fire incident types reported to NFIRS in Zip Code 33477


 Nearest zip codes: 33458, 33410, 33469, 33408, 33418, 33403.
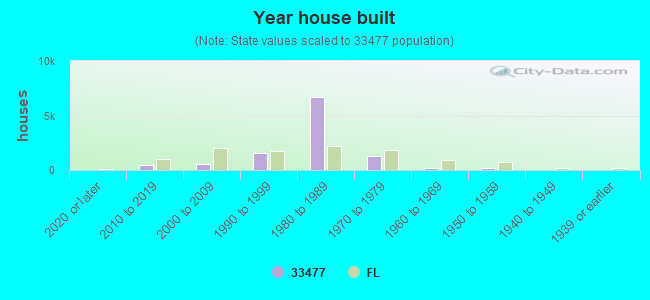


 According to the data from the years 2005 - 2018 the average number of fire incidents per year is 23. The highest number of fire incidents - 38 took place in 2011, and the least - 4 in 2005. The data has a rising trend.
 When looking into fire subcategories, the most reports belonged to: Outside Fires (41.8%), and Structure Fires (31.0%).