Estimated zip code population in 2022: 15,051 Zip code population in 2010: 14,449 Zip code population in 2000: 14,400
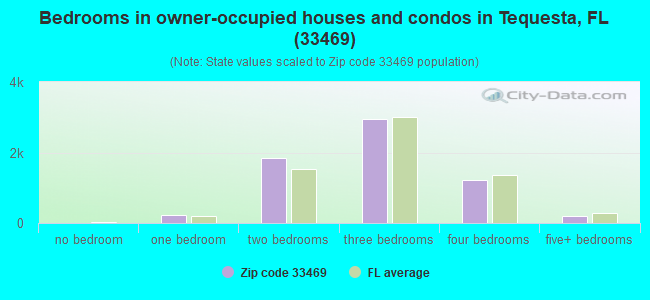
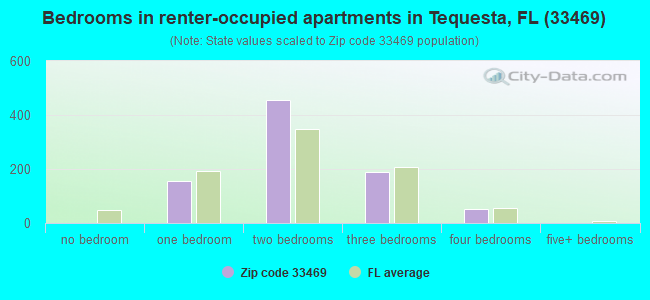
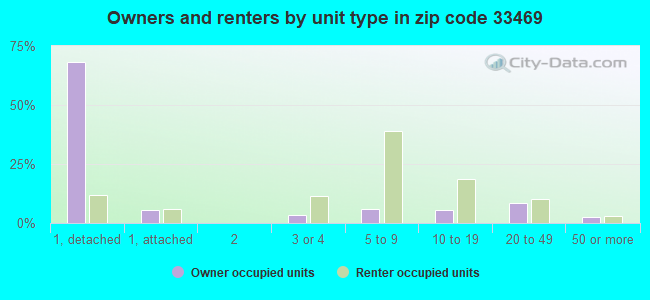
Houses and condos: 8,991 Renter-occupied apartments: 857
% of renters here:
12%
State:
33%
March 2022 cost of living index in zip code 33469: 92.5 (less than average, U.S. average is 100)
Land area: 11.4 sq. mi. Water area: 2.7 sq. mi.
Population density: 1,315 people per square mile
(low).
OSM Map
General Map
Google Map
MSN Map
OSM Map
General Map
Google Map
MSN Map
OSM Map
General Map
Google Map
MSN Map
OSM Map
General Map
Google Map
MSN Map
Please wait while loading the map...
Real estate property taxes paid for housing units in 2022:
This zip code:
0.8% ($4,372)
Florida:
0.7% ($2,529)
Median real estate property taxes paid for housing units with mortgages in 2022: $5,111 (0.8%) Median real estate property taxes paid for housing units with no mortgage in 2022: $3,174 (0.6%)
Estimated median house/condo value in 2022: $571,262
33469:
$571,262
Florida:
$354,100
According to our research of Florida and other state lists, there were 3 registered sex offenders living in 33469 zip code as of April 27, 2024. The ratio of all residents to sex offenders in zip code 33469 is 5,217 to 1. The ratio of registered sex offenders to all residents in this zip code is much lower than the state average.
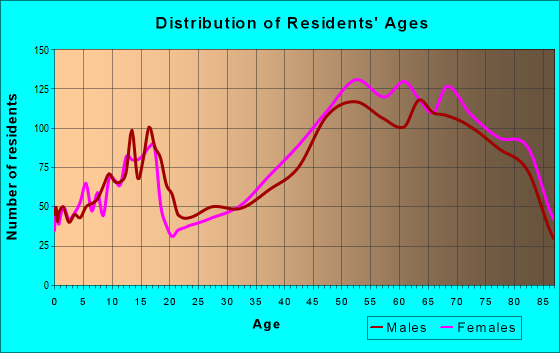
Median resident age:
This zip code:
57.2 years
Florida median age:
42.7 years
Average household size:
This zip code:
2.1 people
Florida:
2.5 people
Averages for the 2020 tax year for zip code 33469, filed in 2021:
Average Adjusted Gross Income (AGI) in 2020: $263,381 (Individual Income Tax Returns)
Here:
$263,381
State:
$82,200
Salary/wage: $125,490 (reported on 65.6% of returns)
Here:
$125,490
State:
$58,347
(% of AGI for various income ranges: 1095.2% for AGIs below $25k, 3568.3% for AGIs $25k-50k, 6078.1% for AGIs $50k-75k, 8699.2% for AGIs $75k-100k, 17526.6% for AGIs $100k-200k, 130360.0% for AGIs over 200k)
Taxable interest for individuals: $11,914 (reported on 49.3% of returns)
This zip code:
$11,914
Florida:
$4,272
(% of AGI for various income ranges: 47.8% for AGIs below $25k, 92.1% for AGIs $25k-50k, 164.1% for AGIs $50k-75k, 221.5% for AGIs $75k-100k, 551.2% for AGIs $100k-200k, 12286.4% for AGIs over 200k)
Ordinary dividends: $56,533 (reported on 46.7% of returns)
Here:
$56,533
State:
$15,863
(% of AGI for various income ranges: 169.5% for AGIs below $25k, 236.0% for AGIs $25k-50k, 515.9% for AGIs $50k-75k, 851.8% for AGIs $75k-100k, 2393.2% for AGIs $100k-200k, 56575.5% for AGIs over 200k)
Net capital gain/loss in AGI: +$158,715 (reported on 44.2% of returns)
Here:
+$158,715
State:
+$62,983
(% of AGI for various income ranges: 63.6% for AGIs below $25k, 184.6% for AGIs $25k-50k, 454.9% for AGIs $50k-75k, 684.5% for AGIs $75k-100k, 1732.3% for AGIs $100k-200k, 166537.9% for AGIs over 200k)
Profit/loss from business: +$41,866 (reported on 20.1% of returns)
Here:
+$41,866
State:
+$9,719
(% of AGI for various income ranges: 268.1% for AGIs below $25k, 280.7% for AGIs $25k-50k, 424.9% for AGIs $50k-75k, 658.5% for AGIs $75k-100k, 883.4% for AGIs $100k-200k, 15649.4% for AGIs over 200k)
Taxable individual retirement arrangement distribution: $35,867 (reported on 17.6% of returns)
33469:
$35,867
Florida:
$24,823
(% of AGI for various income ranges: 147.5% for AGIs below $25k, 285.6% for AGIs $25k-50k, 545.4% for AGIs $50k-75k, 824.5% for AGIs $75k-100k, 1925.5% for AGIs $100k-200k, 8151.5% for AGIs over 200k)
Self-employed (Keogh) retirement plans: $42,360 (reported on 1.2% of returns)
33469:
$42,360
Florida:
$29,694
(% of AGI for various income ranges: 61.7% for AGIs $50k-75k, 1173.3% for AGIs over 200k)
Total itemized deductions: $61,809 (reported on 21.1% of returns)
Here:
$61,809
State:
$45,393
(% of AGI for various income ranges: 247.0% for AGIs below $25k, 340.4% for AGIs $25k-50k, 760.2% for AGIs $50k-75k, 1049.0% for AGIs $75k-100k, 1938.9% for AGIs $100k-200k, 23509.7% for AGIs over 200k)
Charity contributions: $32,051 (reported on 18.5% of returns)
Here:
$32,051
State:
$20,178
(% of AGI for various income ranges: 16.0% for AGIs below $25k, 28.1% for AGIs $25k-50k, 109.8% for AGIs $50k-75k, 146.5% for AGIs $75k-100k, 360.1% for AGIs $100k-200k, 13279.4% for AGIs over 200k)
Taxes paid: $8,220 (reported on 20.7% of returns)
33469:
$8,220
State:
$6,967
(% of AGI for various income ranges: 38.3% for AGIs below $25k, 67.3% for AGIs $25k-50k, 169.8% for AGIs $50k-75k, 240.2% for AGIs $75k-100k, 440.4% for AGIs $100k-200k, 2332.1% for AGIs over 200k)
Earned income credit: $1,476 (reported on 6.2% of returns)
Here:
$1,476
State:
$2,306
(% of AGI for various income ranges: 50.6% for AGIs below $25k, 27.4% for AGIs $25k-50k)
Percentage of individuals using paid preparers for their 2020 taxes: 91.3%
Here:
91%
State:
92%
(% for various income ranges: 89.5% for AGIs below $25k, 89.8% for AGIs $25k-50k, 91.3% for AGIs $50k-75k, 92.0% for AGIs $75k-100k, 92.2% for AGIs $100k-200k, 93.3% for AGIs over 200k)
Averages for the 2012 tax year for zip code 33469, filed in 2013:
Average Adjusted Gross Income (AGI) in 2012: $164,278 (Individual Income Tax Returns)
Here:
$164,278
State:
$60,316
Salary/wage: $79,123 (reported on 65.9% of returns)
Here:
$79,123
State:
$45,277
(% of AGI for various income ranges: 57.7% for AGIs below $25k, 63.2% for AGIs $25k-50k, 56.6% for AGIs $50k-75k, 58.0% for AGIs $75k-100k, 50.5% for AGIs $100k-200k, 21.9% for AGIs over 200k)
Taxable interest for individuals: $10,664 (reported on 50.5% of returns)
This zip code:
$10,664
Florida:
$3,587
(% of AGI for various income ranges: 4.1% for AGIs below $25k, 2.2% for AGIs $25k-50k, 2.1% for AGIs $50k-75k, 2.0% for AGIs $75k-100k, 2.5% for AGIs $100k-200k, 3.6% for AGIs over 200k)
Ordinary dividends: $32,534 (reported on 43.0% of returns)
Here:
$32,534
State:
$12,831
(% of AGI for various income ranges: 7.6% for AGIs below $25k, 4.9% for AGIs $25k-50k, 5.7% for AGIs $50k-75k, 5.6% for AGIs $75k-100k, 7.1% for AGIs $100k-200k, 9.4% for AGIs over 200k)
Net capital gain/loss in AGI: +$101,115 (reported on 38.8% of returns)
Here:
+$101,115
State:
+$33,493
(% of AGI for various income ranges: 0.8% for AGIs $25k-50k, 1.5% for AGIs $50k-75k, 1.3% for AGIs $75k-100k, 4.4% for AGIs $100k-200k, 32.8% for AGIs over 200k)
Profit/loss from business: +$24,028 (reported on 18.3% of returns)
Here:
+$24,028
State:
+$10,012
(% of AGI for various income ranges: 10.7% for AGIs below $25k, 5.8% for AGIs $25k-50k, 2.9% for AGIs $50k-75k, 3.0% for AGIs $75k-100k, 3.3% for AGIs $100k-200k, 2.1% for AGIs over 200k)
Taxable individual retirement arrangement distribution: $46,919 (reported on 21.8% of returns)
33469:
$46,919
Florida:
$21,544
(% of AGI for various income ranges: 8.0% for AGIs below $25k, 5.1% for AGIs $25k-50k, 5.8% for AGIs $50k-75k, 6.2% for AGIs $75k-100k, 8.7% for AGIs $100k-200k, 5.8% for AGIs over 200k)
Self-employment retirement plans: $34,189 (reported on 1.2% of returns)
33469:
$34,189
Florida:
$20,611
(% of AGI for various income ranges: 0.4% for AGIs $25k-50k, 0.3% for AGIs $100k-200k, 0.3% for AGIs over 200k)
Total itemized deductions: $42,181 (14% of AGI, reported on 47.6% of returns)
Here:
$42,181
State:
$25,533
Here:
14.2% of AGI
State:
18.0% of AGI
(% of AGI for various income ranges: 26.3% for AGIs below $25k, 18.0% for AGIs $25k-50k, 17.0% for AGIs $50k-75k, 17.0% for AGIs $75k-100k, 16.8% for AGIs $100k-200k, 9.9% for AGIs over 200k)
Charity contributions: $9,514 (reported on 40.8% of returns)
Here:
$9,514
State:
$5,698
(% of AGI for various income ranges: 1.4% for AGIs below $25k, 1.5% for AGIs $25k-50k, 1.9% for AGIs $50k-75k, 1.7% for AGIs $75k-100k, 2.1% for AGIs $100k-200k, 2.6% for AGIs over 200k)
Taxes paid: $14,484 (reported on 47.1% of returns)
33469:
$14,484
State:
$6,203
(% of AGI for various income ranges: 6.9% for AGIs below $25k, 4.2% for AGIs $25k-50k, 4.7% for AGIs $50k-75k, 4.8% for AGIs $75k-100k, 5.2% for AGIs $100k-200k, 3.8% for AGIs over 200k)
Earned income credit: $1,617 (reported on 8.0% of returns)
Here:
$1,617
State:
$2,372
(% of AGI for various income ranges: 2.9% for AGIs below $25k, 0.4% for AGIs $25k-50k)
Percentage of individuals using paid preparers for their 2012 taxes: 62.8%
Here:
63%
State:
54%
(% for various income ranges: 53.0% for AGIs below $25k, 57.2% for AGIs $25k-50k, 62.2% for AGIs $50k-75k, 64.8% for AGIs $75k-100k, 70.5% for AGIs $100k-200k, 87.2% for AGIs over 200k)
Averages for the 2004 tax year for zip code 33469, filed in 2005:
Average Adjusted Gross Income (AGI) in 2004: $113,666 (Individual Income Tax Returns)
Here:
$113,666
State:
$50,523
Salary/wage: $75,953 (reported on 65.4% of returns)
Here:
$75,953
State:
$39,563
(% of AGI for various income ranges: 53.3% for AGIs $10k-25k, 60.9% for AGIs $25k-50k, 57.6% for AGIs $50k-75k, 60.1% for AGIs $75k-100k, 38.0% for AGIs over 100k)
Taxable interest for individuals: $9,390 (reported on 65.5% of returns)
This zip code:
$9,390
Florida:
$3,211
(% of AGI for various income ranges: 7.8% for AGIs $10k-25k, 4.0% for AGIs $25k-50k, 3.8% for AGIs $50k-75k, 3.4% for AGIs $75k-100k, 5.6% for AGIs over 100k)
Taxable dividends: $14,982 (reported on 50.8% of returns)
Here:
$14,982
State:
$6,129
(% of AGI for various income ranges: 6.8% for AGIs $10k-25k, 5.4% for AGIs $25k-50k, 5.4% for AGIs $50k-75k, 5.1% for AGIs $75k-100k, 6.8% for AGIs over 100k)
Net capital gain/loss: +$49,550 (reported on 46.2% of returns)
Here:
+$49,550
State:
+$27,205
(% of AGI for various income ranges: -0.1% for AGIs $10k-25k, 1.8% for AGIs $25k-50k, 3.1% for AGIs $50k-75k, 4.0% for AGIs $75k-100k, 25.3% for AGIs over 100k)
Profit/loss from business: +$22,483 (reported on 18.9% of returns)
Here:
+$22,483
State:
+$10,634
(% of AGI for various income ranges: 8.5% for AGIs $10k-25k, 5.5% for AGIs $25k-50k, 4.1% for AGIs $50k-75k, 4.5% for AGIs $75k-100k, 3.2% for AGIs over 100k)
IRA payment deduction: $3,627 (reported on 4.5% of returns)
33469:
$3,627
Florida:
$3,082
(% of AGI for various income ranges: 0.3% for AGIs $10k-25k, 0.4% for AGIs $25k-50k, 0.3% for AGIs $50k-75k, 0.3% for AGIs $75k-100k, 0.1% for AGIs over 100k)
Self-employed pension: $21,727 (reported on 1.5% of returns)
Here:
$21,727
Florida:
$15,857
(% of AGI for various income ranges: 0.2% for AGIs $25k-50k, 0.1% for AGIs $50k-75k, 0.3% for AGIs $75k-100k, 0.3% for AGIs over 100k)
Total itemized deductions: $31,756 (18% of AGI, reported on 53.1% of returns)
Here:
$31,756
State:
$20,370
Here:
17.6% of AGI
State:
20.7% of AGI
(% of AGI for various income ranges: 27.3% for AGIs $10k-25k, 22.6% for AGIs $25k-50k, 22.0% for AGIs $50k-75k, 19.6% for AGIs $75k-100k, 12.1% for AGIs over 100k)
Charity contributions deductions: $8,502 (4% of AGI, reported on 47.4% of returns)
Here:
$8,502
State:
$4,064
Here:
4.4% of AGI
State:
3.8% of AGI
(% of AGI for various income ranges: 1.8% for AGIs $10k-25k, 2.0% for AGIs $25k-50k, 2.3% for AGIs $50k-75k, 2.3% for AGIs $75k-100k, 3.9% for AGIs over 100k)
Total tax: $25,406 (reported on 81.7% of returns)
33469:
$25,406
State:
$9,431
(% of AGI for various income ranges: 4.8% for AGIs $10k-25k, 7.5% for AGIs $25k-50k, 9.2% for AGIs $50k-75k, 10.8% for AGIs $75k-100k, 21.1% for AGIs over 100k)
Earned income credit: $1,121 (reported on 5.4% of returns)
Here:
$1,121
State:
$1,808
Percentage of individuals using paid preparers for their 2004 taxes: 66.0%
Here:
66%
State:
60%
(% for various income ranges: 58.6% for AGIs below $10k, 60.5% for AGIs $10k-25k, 64.0% for AGIs $25k-50k, 65.0% for AGIs $50k-75k, 65.0% for AGIs $75k-100k, 78.7% for AGIs over 100k)
Likely homosexual households (counted as self-reported same-sex unmarried-partner households)
Lesbian couples: 0.0% of all households
Gay men: 0.1% of all households
Household received Food Stamps/SNAP in the past 12 months: 132 Household did not receive Food Stamps/SNAP in the past 12 months: 7,183
Women who had a birth in the past 12 months: 27 (28 now married, 0 unmarried) Women who did not have a birth in the past 12 months: 1,980 (992 now married, 988 unmarried)
Housing units in zip code 33469 with a mortgage: 2,725 (479 second mortgage, 16 home equity loan, 449 both second mortgage and home equity loan) Houses without a mortgage: 58
Median monthly owner costs for units with a mortgage: $2,516 Median monthly owner costs for units without a mortgage: $886
Residents with income below the poverty level in 2022:
This zip code:
7.7%
Whole state:
12.7%
Residents with income below 50% of the poverty level in 2022:
This zip code:
2.5%
Whole state:
6.6%
Median number of rooms in houses and condos:
Here:
6.0
State:
5.9
Median number of rooms in apartments:
Here:
4.3
State:
4.2
Notable locations in this zip code not listed on our city pages
Notable locations in zip code 33469: Tanah Keeta Scout Reservation (A), Hobe Sound Golf Club (B), Camp Murphy (C), Tropic Vista (D), Lighthouse Plaza (E), Tequesta Plaza (F), Village Square (G), Palm Beach County Public Library - North-County Branch (H), Tequesta Fire Rescue (I), Palm Beach County Fire Rescue Station 11 (J), Martin County Fire Rescue Station 36 (K), Tequesta Police Department (L), Jupiter Inlet Colony Police Department (M). Display/hide their locations on the map
In group quarters: 130 (-1 institutionalized population)
Size of family households: 3,082 2-persons, 636 3-persons, 618 4-persons, 131 5-persons, 21 6-persons, 5 7-or-more-persons
Size of nonfamily households: 2,224 1-person, 537 2-persons
1,822 married couples with children.
316 single-parent households (80 men, 236 women).
90.9% of residents of 33469 zip code speak English at home.
5.5% of residents speak Spanish at home (72% very well, 23% well, 6% not well).
3.5% of residents speak other Indo-European language at home (97% very well, 3% well).
0.4% of residents speak Asian or Pacific Island language at home (30% very well, 70% well).
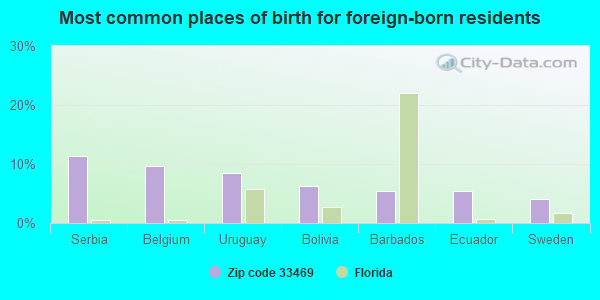
Foreign born population: 1,083 (7.2%) (79.8% of them are naturalized citizens)
This zip code:
7.2%
Whole state:
21.7%
11%Serbia
10%Belgium
8%Uruguay
6%Bolivia
5%Barbados
5%Ecuador
4%Sweden
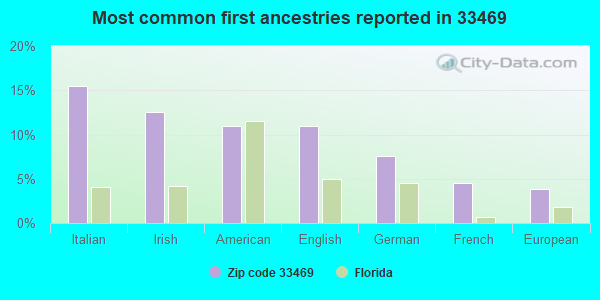
15%Italian
13%Irish
11%American
11%English
8%German
4%French
4%European
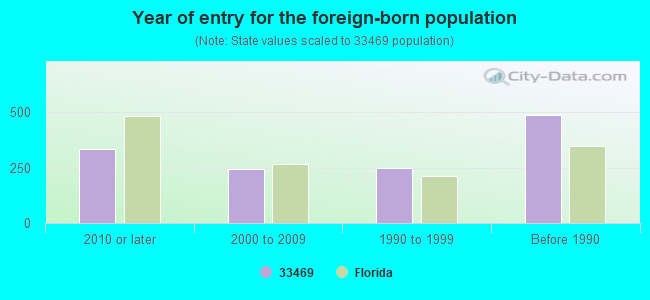
Year of entry for the foreign-born population
3332010 or later
2452000 to 2009
2461990 to 1999
487Before 1990
Major facilities with environmental interests located in this zip code:
SEAGATE MARINA (18753 SE FEDERAL HWY in TEQUESTA, FL)
(Integrated Compliance Information System) - ICIS-04-2000-0252, FORMAL ENFORCEMENT ACTION National Pollutant Discharge Elimination System NON-MAJOR (Tracking pollutant discharge elimination systems) - permit Business SIC classification: MARINAS Organizations: DAREN RUBENFELD (CONTACT/OWNER)
Alternative names: TEQUESTA MARINE INC
IMPERIAL CLEANERS & TAILORING (351 CYPRESS DR in TEQUESTA, FL)
AIR MINOR (AIRS/AFS) (Resource Conservation and Recovery Act (tracking hazardous waste)) Business SIC classification: DRYCLEANING PLANTS, EXCEPT RUG CLEANING Organizations: MANARA CARMINE (CONTACT/OWNER)
PUBLIX # 312 AT COUNTY LINE PL (NWC US HWY 1/VILLAGE BLVD in TEQUESTA, FL)
National Pollutant Discharge Elimination System NON-MAJOR (Tracking pollutant discharge elimination systems) - permit Organizations: BARNEY DANZANSKY (CONTACT/OWNER)
SEA PLUM (425 INDIAN CREEK PKWY in JUPITER, FL)
National Pollutant Discharge Elimination System NON-MAJOR (Tracking pollutant discharge elimination systems) - permit Organizations: NELSON BENNETT (CONTACT/OWNER)
SHREEGI ENTERPRISES INC (121 NORTH US HIGHWAY 1 in TEQUESTA, FL)
AIR MINOR (AIRS/AFS) Small Quantity Generators, between 100 kg and 1000 kg of hazardous waste/month (Resource Conservation and Recovery Act (tracking hazardous waste)) - notification Business SIC classification: DRYCLEANING PLANTS, EXCEPT RUG CLEANING Alternative names: STAR CLEANERS
INTERMARINE (19157 SE FEDERAL HIGHWAY in JUPITER, FL)
(Resource Conservation and Recovery Act (tracking hazardous waste)) Organizations: NON NOTIFIER (CONTACT/OWNER)
OLD CYPRESS PUD ( in TEQUESTA, FL)
National Pollutant Discharge Elimination System NON-MAJOR (Tracking pollutant discharge elimination systems) - permit Organizations: ANTHONY PANEBIANCO (CONTACT/OWNER)
ALMAR/JACKSON POOLS, INC. (1461 CYPRESS DRIVE in JUPITER, FL)
COMPLIANCE ACTIVITY (Tracking inspections of insecticide, fungicide, and rodenticide, and toxic substances)
SATIN HANGERS INC (632 U S HIGHWAY 1 NORTH in TEQUESTA, FL)
AIR MINOR (AIRS/AFS) Business SIC classification: DRYCLEANING PLANTS, EXCEPT RUG CLEANING
HORIZON OIL CO (501 EAST N PARK ST in OKEECHOBEE, FL)
Small Quantity Generators, between 100 kg and 1000 kg of hazardous waste/month (Resource Conservation and Recovery Act (tracking hazardous waste)) - notification Organizations: WILLIAM SEAWAY, PRES (CONTACT/OWNER)
JUPITER HILLS CLUB (17800 SE FEDERAL HWY in TEQUESTA, FL)
Small Quantity Generators, between 100 kg and 1000 kg of hazardous waste/month (Resource Conservation and Recovery Act (tracking hazardous waste)) - notification Organizations: EDWIN MARTIN (CONTACT/OWNER)
LOGIC SYSTEMS CORP (1567 CYPRESS DRIVE in JUPITER, FL)
Small Quantity Generators, between 100 kg and 1000 kg of hazardous waste/month (Resource Conservation and Recovery Act (tracking hazardous waste)) - notification Organizations: FRANK ALDRIDGE, PRESIDENT (CONTACT/OWNER)
NORTON TIRE CO INC (160 BRIDGE ROAD in TEQUESTA, FL)
Small Quantity Generators, between 100 kg and 1000 kg of hazardous waste/month (Resource Conservation and Recovery Act (tracking hazardous waste)) - notification Organizations: RICHARD PAINE, STORE MGR (CONTACT/OWNER)
Housing units lacking complete kitchen facilities: 0.3%
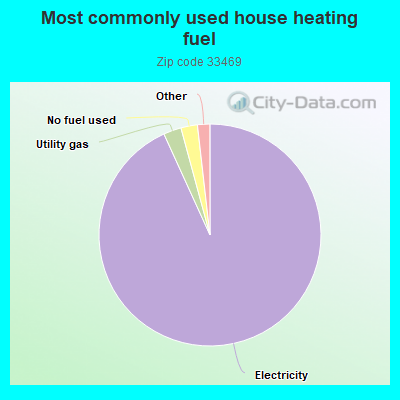
93.2%Electricity
2.6%Utility gas
2.4%No fuel used
0.9%Bottled, tank, or LP gas
0.7%Solar energy
Population in 1990: 11,781. Population change in the 1990s: +2,619 (+22.2%).
Place of birth for U.S.-born residents:
This state: 4,312
Northeast: 4,871
Midwest: 1,950
South: 1,984
West: 567
56% of the 33469 zip code residents lived in the same house 5 years ago. Out of people who lived in different houses, 38% lived in this county. Out of people who lived in different counties, 50% lived in Florida.
92% of the 33469 zip code residents lived in the same house 1 year ago. Out of people who lived in different houses, 34% moved from this county. Out of people who lived in different houses, 44% moved from different county within same state. Out of people who lived in different houses, 24% moved from different state. Out of people who lived in different houses, 0% moved from abroad.
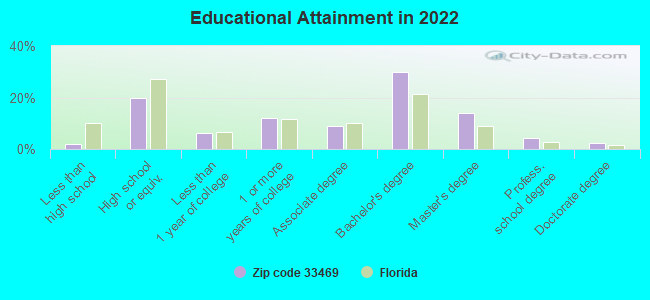
Private vs. public school enrollment:
Students in private schools in grades 1 to 8 (elementary and middle school): 269
Here:
28.7%
Florida:
15.8%
Students in private schools in grades 9 to 12 (high school): 170
Here:
29.4%
Florida:
12.9%
Students in private undergraduate colleges:
Here:
0.0%
Florida:
23.6%
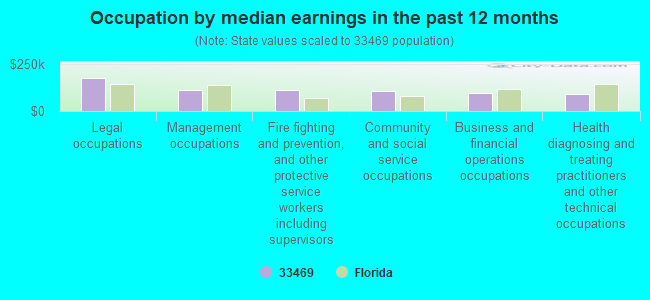
Occupation by median earnings in the past 12 months ($)
177,267Legal occupations
112,699Management occupations
111,868Fire fighting and prevention, and other protective service workers including supervisors
107,498Community and social service occupations
93,134Business and financial operations occupations
92,510Health diagnosing and treating practitioners and other technical occupations
Companies with federal contracts located in this zip code:
TURN-KEY MANAGEMENT, INC (102029 SE BANYON WAY in TEQUESTA, FL; small business) : $8,035,688 in 35 contractsfrom 1999 to 2005
Contracts for Non-Food Items For Resale, Food Items For Resale by Defense Commissary Agency, Department of Defense Signed by year:2000: $184,815; 2001: $220,347; 2002: $89,045; 2003: $419,734; 2004: $2,656,224; 2005: $4,336,867; 2006: $0.
Biggest contracts:
$2,302,235 with Defense Commissary Agency for Non-Food Items For Resale. Signed on 2005-10-01. Completion date: 2005-12-31.
$2,208,879 with Defense Commissary Agency for Food Items For Resale. Signed on 2004-10-01. Completion date: 2005-03-31.
$1,248,715, same as above.Signed on 2005-04-01. Completion date: 2005-09-30.
$425,395, same as above.Signed on 2005-01-01. Completion date: 2005-03-31.
GEAR SOFTWARE, INC (1 MAIN STREET in TEQUESTA, FL; small business) : $69,015 in 2 contractsfrom 2004 to 2005
$36,915 with Navy for Miscellaneous Items. Signed on 2005-07-07. Completion date: 2005-07-29.
$32,100 with Navy for Communication Training Devices. Signed on 2004-03-23. Completion date: 2005-07-01.
STANDARD WELDERS EQUIPMENT COR (1748 JUPITER COVE DRIVE in JUPITER, FL; small business) : $45,730 in 8 contractsfrom 2004 to 2006
Contracts for Electric Arc Welding Equipment, Gas Welding, Heat Cutting, and Metalizing Equipment, Miscellaneous Welding, Soldering, and Brazing Supplies and Accessories by Defense Logistics Agency, Navy Signed by year:2000: $0; 2001: $0; 2002: $0; 2003: $0; 2004: $5,512; 2005: $28,218; 2006: $12,000.
Biggest contracts:
$13,450 with Defense Logistics Agency for Electric Arc Welding Equipment. Signed on 2005-04-13. Completion date: 2005-05-12.
$6,726 with Defense Logistics Agency for Gas Welding, Heat Cutting, and Metalizing Equipment. Signed on 2006-06-17. Completion date: 2006-08-18.
$5,512 with Defense Logistics Agency for Miscellaneous Welding, Soldering, and Brazing Supplies and Accessories. Signed on 2004-10-30. Completion date: 2004-12-18.
$5,274 with Defense Logistics Agency for Electric Arc Welding Equipment. Signed on 2006-03-23. Completion date: 2006-05-08.
VILLAGE OF TEQUESTA, FLORIDA (250 TEQUESTA DRIVE, SUITE in TEQUESTA, FL) : $11,005 in 2 contractsin 2002
$11,005 with Air Force for Water Services. Signed on 2002-09-30. Completion date: 2002-09-30.
$0, same as above.Signed on 2002-09-30. Completion date: 2002-09-30.
Top industries in this zip code by the number of employees in 2005:
Arts, Entertainment, and Recreation: Golf Courses and Country Clubs (100-249: 1, 50-99: 2, 10-19: 1)
Health Care and Social Assistance: Residential Mental Health and Substance Abuse Facilities (100-249: 1)
Health Care and Social Assistance: Homes for the Elderly (50-99: 1, 20-49: 2)
Administrative and Support and Waste Management and Remediation Services: Landscaping Services (50-99: 1, 20-49: 1, 1-4: 10)
Other Services (except Public Administration): Other Similar Organizations (except Business, Professional, Labor, and Political Organizations) (20-49: 1, 10-19: 3, 5-9: 3, 1-4: 8)
Other Services (except Public Administration): Religious Organizations (20-49: 2, 10-19: 1, 5-9: 2, 1-4: 3)
Real Estate and Rental and Leasing: Offices of Real Estate Agents and Brokers (5-9: 4, 1-4: 28)
Construction: New Single-Family Housing Construction (except Operative Builders) (10-19: 2, 5-9: 3, 1-4: 15)
People in group quarters in 2010:
86 people in residential treatment centers for adults
People in group quarters in 2000:
68 people in nursing homes
Fatal accident statistics in 2014:
Fatal accident count: 2
Vehicles involved in fatal accidents: 4
Fatal accidents caused by drunken drivers: 0
Fatalities: 2
Persons involved in fatal accidents: 4
Pedestrians involved in fatal accidents: 0
Fatal accident statistics in 2013:
Fatal accident count: 2
Vehicles involved in fatal accidents: 3
Fatal accidents caused by drunken drivers: 0
Fatalities: 2
Persons involved in fatal accidents: 4
Pedestrians involved in fatal accidents: 1
Home Mortgage Disclosure Act Aggregated Statistics For Year 2009 (Based on 12 partial tracts)
A) FHA, FSA/RHS & VA Home Purchase Loans
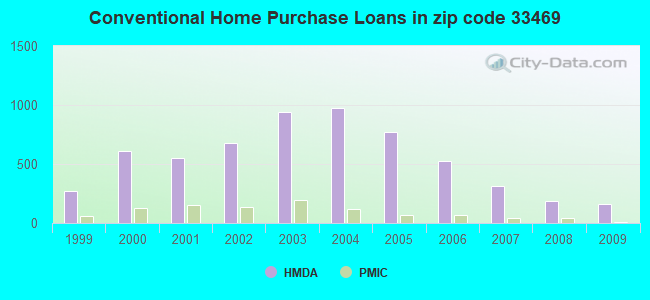
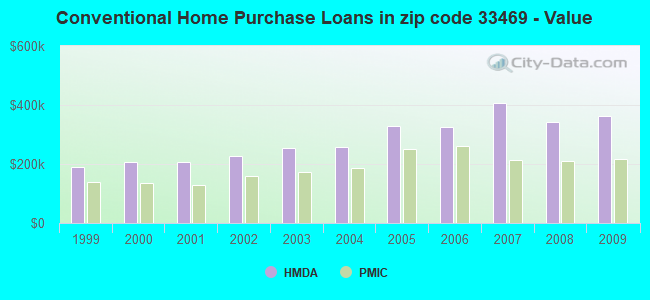
B) Conventional Home Purchase Loans
C) Refinancings
D) Home Improvement Loans
F) Non-occupant Loans on < 5 Family Dwellings (A B C & D)
Number
Average Value
Number
Average Value
Number
Average Value
Number
Average Value
Number
Average Value
LOANS ORIGINATED
67
$200,503
164
$363,468
331
$282,215
11
$262,505
84
$403,136
APPLICATIONS APPROVED, NOT ACCEPTED
3
$200,383
20
$320,902
33
$272,045
2
$101,880
3
$128,000
APPLICATIONS DENIED
12
$234,433
38
$347,838
220
$400,444
8
$83,158
63
$284,698
APPLICATIONS WITHDRAWN
11
$218,180
28
$565,726
105
$297,171
1
$45,560
18
$240,477
FILES CLOSED FOR INCOMPLETENESS
0
$0
9
$767,529
20
$273,826
0
$0
7
$284,631
Aggregated Statistics For Year 2008 (Based on 12 partial tracts)
A) FHA, FSA/RHS & VA Home Purchase Loans
B) Conventional Home Purchase Loans
C) Refinancings
D) Home Improvement Loans
F) Non-occupant Loans on < 5 Family Dwellings (A B C & D)
G) Loans On Manufactured Home Dwelling (A B C & D)
Number
Average Value
Number
Average Value
Number
Average Value
Number
Average Value
Number
Average Value
Number
Average Value
LOANS ORIGINATED
53
$198,297
185
$342,315
222
$291,027
16
$108,041
67
$331,468
0
$0
APPLICATIONS APPROVED, NOT ACCEPTED
2
$206,680
35
$485,811
58
$247,673
3
$95,663
21
$441,396
0
$0
APPLICATIONS DENIED
14
$212,886
47
$455,311
158
$394,332
19
$146,136
43
$418,806
0
$0
APPLICATIONS WITHDRAWN
2
$215,590
26
$340,861
52
$304,320
4
$710,128
11
$427,756
0
$0
FILES CLOSED FOR INCOMPLETENESS
3
$196,267
7
$684,251
25
$390,320
1
$29,400
3
$1,007,230
1
$335,110
Aggregated Statistics For Year 2007 (Based on 12 partial tracts)
A) FHA, FSA/RHS & VA Home Purchase Loans
B) Conventional Home Purchase Loans
C) Refinancings
D) Home Improvement Loans
F) Non-occupant Loans on < 5 Family Dwellings (A B C & D)
Number
Average Value
Number
Average Value
Number
Average Value
Number
Average Value
Number
Average Value
LOANS ORIGINATED
5
$232,490
315
$406,202
474
$377,597
40
$186,012
156
$449,449
APPLICATIONS APPROVED, NOT ACCEPTED
0
$0
34
$339,050
132
$317,633
13
$132,369
25
$573,623
APPLICATIONS DENIED
1
$221,550
58
$423,839
218
$348,604
26
$105,967
43
$333,937
APPLICATIONS WITHDRAWN
1
$339,520
24
$367,623
106
$338,182
5
$137,248
20
$264,736
FILES CLOSED FOR INCOMPLETENESS
0
$0
17
$432,098
42
$523,288
0
$0
5
$330,864
Aggregated Statistics For Year 2006 (Based on 12 partial tracts)
A) FHA, FSA/RHS & VA Home Purchase Loans
B) Conventional Home Purchase Loans
C) Refinancings
D) Home Improvement Loans
F) Non-occupant Loans on < 5 Family Dwellings (A B C & D)
Number
Average Value
Number
Average Value
Number
Average Value
Number
Average Value
Number
Average Value
LOANS ORIGINATED
1
$322,200
528
$325,179
686
$325,453
58
$137,896
219
$327,193
APPLICATIONS APPROVED, NOT ACCEPTED
0
$0
56
$304,974
101
$327,936
17
$110,408
26
$416,335
APPLICATIONS DENIED
0
$0
51
$352,123
186
$339,265
33
$189,018
34
$289,384
APPLICATIONS WITHDRAWN
0
$0
87
$307,981
181
$426,733
8
$187,021
64
$361,183
FILES CLOSED FOR INCOMPLETENESS
0
$0
13
$276,200
79
$342,097
3
$151,880
11
$591,385
Aggregated Statistics For Year 2005 (Based on 12 partial tracts)
A) FHA, FSA/RHS & VA Home Purchase Loans
B) Conventional Home Purchase Loans
C) Refinancings
D) Home Improvement Loans
F) Non-occupant Loans on < 5 Family Dwellings (A B C & D)
G) Loans On Manufactured Home Dwelling (A B C & D)
Number
Average Value
Number
Average Value
Number
Average Value
Number
Average Value
Number
Average Value
Number
Average Value
LOANS ORIGINATED
2
$81,760
770
$329,599
749
$284,796
99
$190,432
374
$333,810
0
$0
APPLICATIONS APPROVED, NOT ACCEPTED
0
$0
61
$383,393
123
$283,196
13
$234,336
28
$296,181
2
$41,700
APPLICATIONS DENIED
0
$0
93
$326,651
219
$255,814
38
$106,909
29
$319,794
2
$71,155
APPLICATIONS WITHDRAWN
0
$0
71
$434,936
206
$264,703
23
$162,493
45
$282,667
0
$0
FILES CLOSED FOR INCOMPLETENESS
0
$0
23
$387,624
109
$248,963
2
$73,280
13
$235,999
0
$0
Aggregated Statistics For Year 2004 (Based on 12 partial tracts)
A) FHA, FSA/RHS & VA Home Purchase Loans
B) Conventional Home Purchase Loans
C) Refinancings
D) Home Improvement Loans
F) Non-occupant Loans on < 5 Family Dwellings (A B C & D)
G) Loans On Manufactured Home Dwelling (A B C & D)
Number
Average Value
Number
Average Value
Number
Average Value
Number
Average Value
Number
Average Value
Number
Average Value
LOANS ORIGINATED
3
$120,687
972
$258,762
717
$266,717
59
$164,403
445
$241,842
10
$56,881
APPLICATIONS APPROVED, NOT ACCEPTED
0
$0
128
$191,357
127
$211,069
17
$105,542
42
$249,303
59
$61,009
APPLICATIONS DENIED
3
$229,290
215
$210,881
252
$294,037
44
$88,861
73
$217,756
76
$57,315
APPLICATIONS WITHDRAWN
0
$0
100
$295,097
158
$264,440
14
$57,551
34
$317,256
0
$0
FILES CLOSED FOR INCOMPLETENESS
0
$0
33
$275,506
122
$265,284
5
$98,572
14
$335,615
3
$68,100
Aggregated Statistics For Year 2003 (Based on 12 partial tracts)
A) FHA, FSA/RHS & VA Home Purchase Loans
B) Conventional Home Purchase Loans
C) Refinancings
D) Home Improvement Loans
F) Non-occupant Loans on < 5 Family Dwellings (A B C & D)
Number
Average Value
Number
Average Value
Number
Average Value
Number
Average Value
Number
Average Value
LOANS ORIGINATED
5
$131,960
940
$254,253
1,697
$210,105
38
$77,503
446
$229,614
APPLICATIONS APPROVED, NOT ACCEPTED
0
$0
88
$215,581
176
$189,361
16
$62,706
53
$164,634
APPLICATIONS DENIED
1
$277,090
113
$224,663
442
$187,568
23
$34,374
50
$174,625
APPLICATIONS WITHDRAWN
2
$143,450
94
$364,708
261
$194,449
0
$0
39
$227,218
FILES CLOSED FOR INCOMPLETENESS
0
$0
49
$294,236
192
$250,063
4
$70,702
14
$185,429
Aggregated Statistics For Year 2002 (Based on 12 partial tracts)
A) FHA, FSA/RHS & VA Home Purchase Loans
B) Conventional Home Purchase Loans
C) Refinancings
D) Home Improvement Loans
E) Loans on Dwellings For 5+ Families
F) Non-occupant Loans on < 5 Family Dwellings (A B C & D)
Number
Average Value
Number
Average Value
Number
Average Value
Number
Average Value
Number
Average Value
Number
Average Value
LOANS ORIGINATED
13
$119,781
682
$227,627
1,144
$211,977
44
$57,332
2
$14,595,000
254
$201,405
APPLICATIONS APPROVED, NOT ACCEPTED
0
$0
69
$359,489
162
$212,141
14
$67,172
0
$0
23
$243,059
APPLICATIONS DENIED
1
$138,160
55
$312,168
206
$193,407
32
$63,883
0
$0
12
$498,767
APPLICATIONS WITHDRAWN
0
$0
76
$242,604
164
$190,289
2
$33,935
0
$0
31
$160,005
FILES CLOSED FOR INCOMPLETENESS
0
$0
32
$205,874
108
$189,908
2
$59,445
0
$0
9
$213,466
Aggregated Statistics For Year 2001 (Based on 12 partial tracts)
A) FHA, FSA/RHS & VA Home Purchase Loans
B) Conventional Home Purchase Loans
C) Refinancings
D) Home Improvement Loans
F) Non-occupant Loans on < 5 Family Dwellings (A B C & D)
Number
Average Value
Number
Average Value
Number
Average Value
Number
Average Value
Number
Average Value
LOANS ORIGINATED
22
$128,287
553
$206,465
686
$192,718
61
$48,359
149
$219,671
APPLICATIONS APPROVED, NOT ACCEPTED
1
$76,270
53
$180,784
78
$229,975
21
$53,640
11
$153,659
APPLICATIONS DENIED
0
$0
47
$201,234
161
$169,223
30
$24,647
11
$110,283
APPLICATIONS WITHDRAWN
1
$189,600
50
$195,607
102
$130,097
7
$27,944
17
$182,521
FILES CLOSED FOR INCOMPLETENESS
1
$194,010
16
$133,197
49
$147,687
4
$10,420
4
$101,190
Aggregated Statistics For Year 2000 (Based on 12 partial tracts)
A) FHA, FSA/RHS & VA Home Purchase Loans
B) Conventional Home Purchase Loans
C) Refinancings
D) Home Improvement Loans
F) Non-occupant Loans on < 5 Family Dwellings (A B C & D)
Number
Average Value
Number
Average Value
Number
Average Value
Number
Average Value
Number
Average Value
LOANS ORIGINATED
17
$92,142
613
$206,528
198
$179,303
52
$57,773
125
$226,225
APPLICATIONS APPROVED, NOT ACCEPTED
0
$0
92
$189,052
35
$100,403
12
$36,809
15
$222,442
APPLICATIONS DENIED
3
$103,543
170
$103,222
86
$100,583
22
$25,100
16
$112,607
APPLICATIONS WITHDRAWN
2
$142,615
69
$164,639
97
$103,960
4
$15,995
7
$183,671
FILES CLOSED FOR INCOMPLETENESS
0
$0
22
$160,474
31
$133,383
1
$27,240
3
$62,720
Aggregated Statistics For Year 1999 (Based on 5 partial tracts)
A) FHA, FSA/RHS & VA Home Purchase Loans
B) Conventional Home Purchase Loans
C) Refinancings
D) Home Improvement Loans
E) Loans on Dwellings For 5+ Families
F) Non-occupant Loans on < 5 Family Dwellings (A B C & D)
2002 - 2018 National Fire Incident Reporting System (NFIRS) incidents
According to the data from the years 2002 - 2018 the average number of fire incidents per year is 25. The highest number of fire incidents - 38 took place in 2011, and the least - 10 in 2002. The data has a rising trend.
When looking into fire subcategories, the most reports belonged to: Outside Fires (42.3%), and Structure Fires (38.1%).
Fire incident types reported to NFIRS in Zip Code 33469
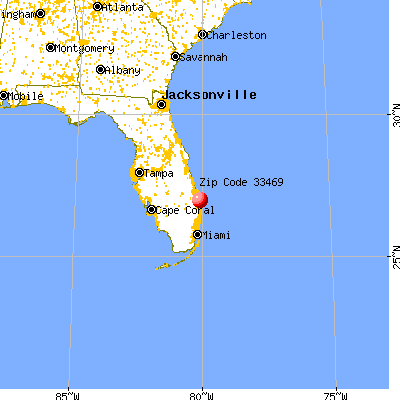


 Nearest zip codes: 33458, 33477, 33455, 33418, 33410, 33478.


 According to the data from the years 2002 - 2018 the average number of fire incidents per year is 25. The highest number of fire incidents - 38 took place in 2011, and the least - 10 in 2002. The data has a rising trend.
 When looking into fire subcategories, the most reports belonged to: Outside Fires (42.3%), and Structure Fires (38.1%).