Estimated zip code population in 2022: 60,650 Zip code population in 2010: 52,003 Zip code population in 2000: 44,927
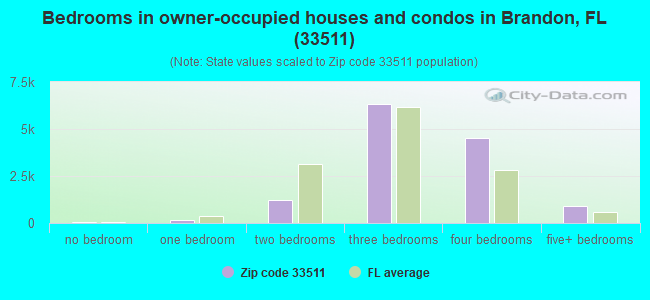
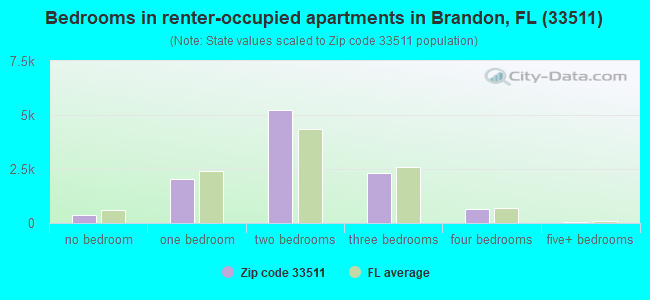
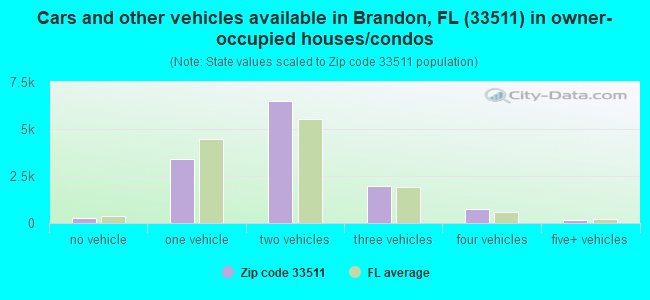
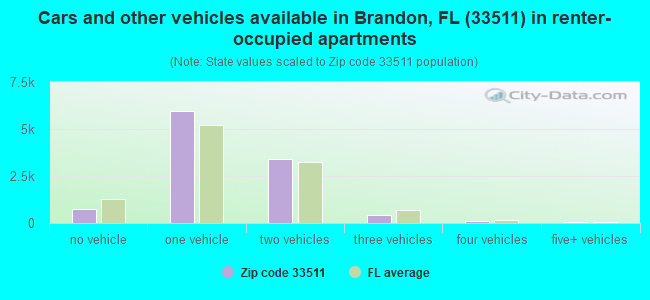
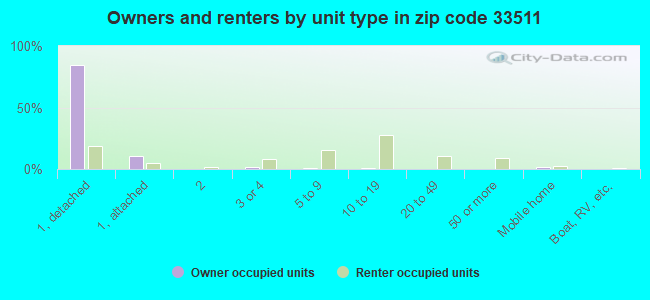
Houses and condos: 25,197 Renter-occupied apartments: 10,693
% of renters here:
45%
State:
33%
March 2022 cost of living index in zip code 33511: 99.1 (near average, U.S. average is 100)
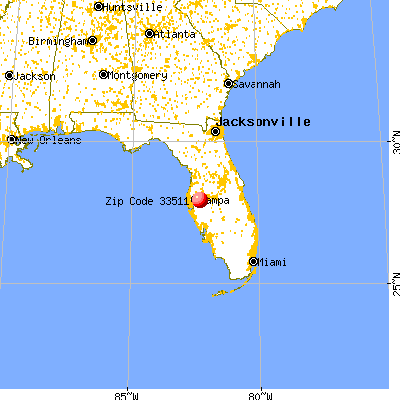
Land area: 15.9 sq. mi. Water area: 0.9 sq. mi.
Population density: 3,817 people per square mile
(average).
OSM Map
General Map
Google Map
MSN Map
OSM Map
General Map
Google Map
MSN Map
OSM Map
General Map
Google Map
MSN Map
OSM Map
General Map
Google Map
MSN Map
Please wait while loading the map...
Real estate property taxes paid for housing units in 2022:
This zip code:
0.7% ($2,388)
Florida:
0.7% ($2,529)
Median real estate property taxes paid for housing units with mortgages in 2022: $2,538 (0.7%) Median real estate property taxes paid for housing units with no mortgage in 2022: $2,041 (0.6%)
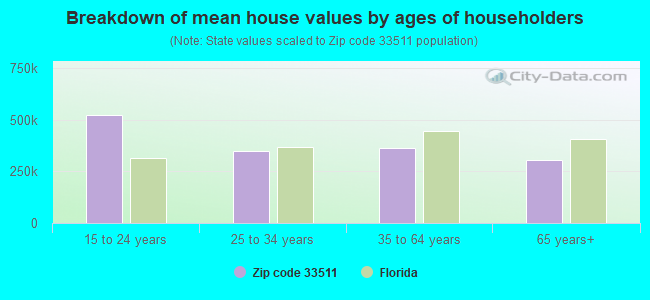
Estimated median house/condo value in 2022: $344,648
33511:
$344,648
Florida:
$354,100
According to our research of Florida and other state lists, there were 47 registered sex offenders living in 33511 zip code as of April 27, 2024. The ratio of all residents to sex offenders in zip code 33511 is 1,179 to 1. The ratio of registered sex offenders to all residents in this zip code is lower than the state average.
Median resident age:
This zip code:
38.1 years
Florida median age:
42.7 years
Average household size:
This zip code:
2.5 people
Florida:
2.5 people
Averages for the 2020 tax year for zip code 33511, filed in 2021:
Average Adjusted Gross Income (AGI) in 2020: $58,064 (Individual Income Tax Returns)
Here:
$58,064
State:
$82,200
Salary/wage: $51,902 (reported on 84.4% of returns)
Here:
$51,902
State:
$58,347
(% of AGI for various income ranges: 1262.7% for AGIs below $25k, 3683.2% for AGIs $25k-50k, 6843.3% for AGIs $50k-75k, 9560.3% for AGIs $75k-100k, 17259.5% for AGIs $100k-200k, 58494.1% for AGIs over 200k)
Taxable interest for individuals: $1,351 (reported on 19.6% of returns)
This zip code:
$1,351
Florida:
$4,272
(% of AGI for various income ranges: 8.9% for AGIs below $25k, 15.6% for AGIs $25k-50k, 29.6% for AGIs $50k-75k, 41.0% for AGIs $75k-100k, 101.8% for AGIs $100k-200k, 715.9% for AGIs over 200k)
Ordinary dividends: $4,950 (reported on 12.8% of returns)
Here:
$4,950
State:
$15,863
(% of AGI for various income ranges: 11.2% for AGIs below $25k, 17.5% for AGIs $25k-50k, 41.6% for AGIs $50k-75k, 94.7% for AGIs $75k-100k, 195.4% for AGIs $100k-200k, 3104.5% for AGIs over 200k)
Net capital gain/loss in AGI: +$16,027 (reported on 11.9% of returns)
Here:
+$16,027
State:
+$62,983
(% of AGI for various income ranges: 7.5% for AGIs below $25k, 16.6% for AGIs $25k-50k, 45.9% for AGIs $50k-75k, 114.3% for AGIs $75k-100k, 376.0% for AGIs $100k-200k, 14136.6% for AGIs over 200k)
Profit/loss from business: +$5,889 (reported on 18.1% of returns)
Here:
+$5,889
State:
+$9,719
(% of AGI for various income ranges: 117.2% for AGIs below $25k, 92.8% for AGIs $25k-50k, 104.7% for AGIs $50k-75k, 153.1% for AGIs $75k-100k, 267.8% for AGIs $100k-200k, 1349.3% for AGIs over 200k)
Taxable individual retirement arrangement distribution: $18,296 (reported on 6.3% of returns)
33511:
$18,296
Florida:
$24,823
(% of AGI for various income ranges: 33.1% for AGIs below $25k, 53.2% for AGIs $25k-50k, 140.7% for AGIs $50k-75k, 302.9% for AGIs $75k-100k, 543.3% for AGIs $100k-200k, 2114.8% for AGIs over 200k)
Self-employed (Keogh) retirement plans: $17,500 (reported on 0.1% of returns)
33511:
$17,500
Florida:
$29,694
(% of AGI for various income ranges: 17.7% for AGIs $100k-200k)
Total itemized deductions: $30,839 (reported on 5.2% of returns)
Here:
$30,839
State:
$45,393
(% of AGI for various income ranges: 34.2% for AGIs below $25k, 86.6% for AGIs $25k-50k, 235.5% for AGIs $50k-75k, 333.5% for AGIs $75k-100k, 616.4% for AGIs $100k-200k, 3993.1% for AGIs over 200k)
Charity contributions: $10,447 (reported on 4.1% of returns)
Here:
$10,447
State:
$20,178
(% of AGI for various income ranges: 3.1% for AGIs below $25k, 13.1% for AGIs $25k-50k, 50.3% for AGIs $50k-75k, 81.4% for AGIs $75k-100k, 169.6% for AGIs $100k-200k, 1606.2% for AGIs over 200k)
Taxes paid: $5,834 (reported on 5.0% of returns)
33511:
$5,834
State:
$6,967
(% of AGI for various income ranges: 4.7% for AGIs below $25k, 14.2% for AGIs $25k-50k, 42.8% for AGIs $50k-75k, 60.1% for AGIs $75k-100k, 126.6% for AGIs $100k-200k, 698.6% for AGIs over 200k)
Earned income credit: $2,284 (reported on 19.5% of returns)
Here:
$2,284
State:
$2,306
(% of AGI for various income ranges: 110.3% for AGIs below $25k, 64.9% for AGIs $25k-50k, 0.9% for AGIs $50k-75k)
Percentage of individuals using paid preparers for their 2020 taxes: 92.8%
Here:
93%
State:
92%
(% for various income ranges: 91.9% for AGIs below $25k, 93.8% for AGIs $25k-50k, 92.8% for AGIs $50k-75k, 92.5% for AGIs $75k-100k, 92.7% for AGIs $100k-200k, 95.1% for AGIs over 200k)
Averages for the 2012 tax year for zip code 33511, filed in 2013:
Average Adjusted Gross Income (AGI) in 2012: $49,263 (Individual Income Tax Returns)
Here:
$49,263
State:
$60,316
Salary/wage: $44,501 (reported on 85.5% of returns)
Here:
$44,501
State:
$45,277
(% of AGI for various income ranges: 78.2% for AGIs below $25k, 84.0% for AGIs $25k-50k, 81.4% for AGIs $50k-75k, 81.0% for AGIs $75k-100k, 77.5% for AGIs $100k-200k, 55.1% for AGIs over 200k)
Taxable interest for individuals: $1,282 (reported on 23.5% of returns)
This zip code:
$1,282
Florida:
$3,587
(% of AGI for various income ranges: 0.9% for AGIs below $25k, 0.4% for AGIs $25k-50k, 0.7% for AGIs $50k-75k, 0.4% for AGIs $75k-100k, 0.4% for AGIs $100k-200k, 1.0% for AGIs over 200k)
Ordinary dividends: $6,429 (reported on 15.1% of returns)
Here:
$6,429
State:
$12,831
(% of AGI for various income ranges: 4.9% for AGIs below $25k, 2.7% for AGIs $25k-50k, 1.6% for AGIs $50k-75k, 0.6% for AGIs $75k-100k, 1.2% for AGIs $100k-200k, 1.8% for AGIs over 200k)
Net capital gain/loss in AGI: +$6,857 (reported on 10.5% of returns)
Here:
+$6,857
State:
+$33,493
(% of AGI for various income ranges: 0.1% for AGIs below $25k, 0.2% for AGIs $25k-50k, 0.8% for AGIs $50k-75k, 0.3% for AGIs $75k-100k, 0.9% for AGIs $100k-200k, 7.8% for AGIs over 200k)
Profit/loss from business: +$7,397 (reported on 13.0% of returns)
Here:
+$7,397
State:
+$10,012
(% of AGI for various income ranges: 6.5% for AGIs below $25k, 1.2% for AGIs $25k-50k, 1.1% for AGIs $50k-75k, 1.3% for AGIs $75k-100k, 1.3% for AGIs $100k-200k, 2.6% for AGIs over 200k)
Taxable individual retirement arrangement distribution: $15,714 (reported on 7.2% of returns)
33511:
$15,714
Florida:
$21,544
(% of AGI for various income ranges: 1.8% for AGIs below $25k, 1.5% for AGIs $25k-50k, 2.2% for AGIs $50k-75k, 2.8% for AGIs $75k-100k, 3.1% for AGIs $100k-200k, 2.1% for AGIs over 200k)
Self-employment retirement plans: $20,533 (reported on 0.1% of returns)
33511:
$20,533
Florida:
$20,611
Total itemized deductions: $19,187 (21% of AGI, reported on 22.4% of returns)
Here:
$19,187
State:
$25,533
Here:
20.8% of AGI
State:
18.0% of AGI
(% of AGI for various income ranges: 6.0% for AGIs below $25k, 8.2% for AGIs $25k-50k, 9.0% for AGIs $50k-75k, 10.1% for AGIs $75k-100k, 9.7% for AGIs $100k-200k, 8.1% for AGIs over 200k)
Charity contributions: $4,309 (reported on 17.3% of returns)
Here:
$4,309
State:
$5,698
(% of AGI for various income ranges: 0.5% for AGIs below $25k, 0.9% for AGIs $25k-50k, 1.3% for AGIs $50k-75k, 1.7% for AGIs $75k-100k, 2.1% for AGIs $100k-200k, 2.5% for AGIs over 200k)
Taxes paid: $3,578 (reported on 21.2% of returns)
33511:
$3,578
State:
$6,203
(% of AGI for various income ranges: 0.7% for AGIs below $25k, 1.1% for AGIs $25k-50k, 1.5% for AGIs $50k-75k, 1.9% for AGIs $75k-100k, 2.0% for AGIs $100k-200k, 1.7% for AGIs over 200k)
Earned income credit: $2,248 (reported on 19.8% of returns)
Here:
$2,248
State:
$2,372
(% of AGI for various income ranges: 6.6% for AGIs below $25k, 1.0% for AGIs $25k-50k)
Percentage of individuals using paid preparers for their 2012 taxes: 41.6%
Here:
42%
State:
54%
(% for various income ranges: 40.8% for AGIs below $25k, 37.1% for AGIs $25k-50k, 41.7% for AGIs $50k-75k, 45.1% for AGIs $75k-100k, 51.0% for AGIs $100k-200k, 74.4% for AGIs over 200k)
Averages for the 2004 tax year for zip code 33511, filed in 2005:
Average Adjusted Gross Income (AGI) in 2004: $45,169 (Individual Income Tax Returns)
Here:
$45,169
State:
$50,523
Salary/wage: $41,325 (reported on 89.6% of returns)
Here:
$41,325
State:
$39,563
(% of AGI for various income ranges: 167.4% for AGIs below $10k, 85.2% for AGIs $10k-25k, 88.2% for AGIs $25k-50k, 85.2% for AGIs $50k-75k, 85.0% for AGIs $75k-100k, 69.5% for AGIs over 100k)
Taxable interest for individuals: $1,266 (reported on 38.1% of returns)
This zip code:
$1,266
Florida:
$3,211
(% of AGI for various income ranges: 5.8% for AGIs below $10k, 1.6% for AGIs $10k-25k, 0.9% for AGIs $25k-50k, 0.8% for AGIs $50k-75k, 0.8% for AGIs $75k-100k, 1.2% for AGIs over 100k)
Taxable dividends: $1,935 (reported on 17.6% of returns)
Here:
$1,935
State:
$6,129
(% of AGI for various income ranges: 3.3% for AGIs below $10k, 0.7% for AGIs $10k-25k, 0.5% for AGIs $25k-50k, 0.6% for AGIs $50k-75k, 0.5% for AGIs $75k-100k, 1.1% for AGIs over 100k)
Net capital gain/loss: +$9,241 (reported on 13.8% of returns)
Here:
+$9,241
State:
+$27,205
(% of AGI for various income ranges: 1.5% for AGIs below $10k, 0.3% for AGIs $10k-25k, 0.3% for AGIs $25k-50k, 1.1% for AGIs $50k-75k, 1.0% for AGIs $75k-100k, 7.9% for AGIs over 100k)
Profit/loss from business: +$7,891 (reported on 12.6% of returns)
Here:
+$7,891
State:
+$10,634
(% of AGI for various income ranges: 12.0% for AGIs below $10k, 4.4% for AGIs $10k-25k, 1.8% for AGIs $25k-50k, 1.7% for AGIs $50k-75k, 1.6% for AGIs $75k-100k, 2.2% for AGIs over 100k)
IRA payment deduction: $2,805 (reported on 2.8% of returns)
33511:
$2,805
Florida:
$3,082
(% of AGI for various income ranges: 0.5% for AGIs below $10k, 0.2% for AGIs $10k-25k, 0.2% for AGIs $25k-50k, 0.2% for AGIs $50k-75k, 0.2% for AGIs $75k-100k, 0.1% for AGIs over 100k)
Self-employed pension: $10,792 (reported on 0.3% of returns)
Here:
$10,792
Florida:
$15,857
(% of AGI for various income ranges: 0.0% for AGIs $25k-50k, 0.0% for AGIs $50k-75k, 0.0% for AGIs $75k-100k, 0.2% for AGIs over 100k)
Total itemized deductions: $16,445 (22% of AGI, reported on 32.9% of returns)
Here:
$16,445
State:
$20,370
Here:
22.3% of AGI
State:
20.7% of AGI
(% of AGI for various income ranges: 21.4% for AGIs below $10k, 10.7% for AGIs $10k-25k, 11.4% for AGIs $25k-50k, 13.7% for AGIs $50k-75k, 13.3% for AGIs $75k-100k, 10.6% for AGIs over 100k)
Charity contributions deductions: $3,148 (4% of AGI, reported on 27.6% of returns)
Here:
$3,148
State:
$4,064
Here:
4.0% of AGI
State:
3.8% of AGI
(% of AGI for various income ranges: 0.9% for AGIs below $10k, 1.0% for AGIs $10k-25k, 1.4% for AGIs $25k-50k, 1.9% for AGIs $50k-75k, 2.2% for AGIs $75k-100k, 2.5% for AGIs over 100k)
Total tax: $6,444 (reported on 77.7% of returns)
33511:
$6,444
State:
$9,431
(% of AGI for various income ranges: 4.9% for AGIs below $10k, 4.2% for AGIs $10k-25k, 6.8% for AGIs $25k-50k, 8.9% for AGIs $50k-75k, 10.7% for AGIs $75k-100k, 18.5% for AGIs over 100k)
Earned income credit: $1,679 (reported on 14.8% of returns)
Here:
$1,679
State:
$1,808
Percentage of individuals using paid preparers for their 2004 taxes: 47.7%
Here:
48%
State:
60%
(% for various income ranges: 43.5% for AGIs below $10k, 49.5% for AGIs $10k-25k, 45.8% for AGIs $25k-50k, 48.6% for AGIs $50k-75k, 45.7% for AGIs $75k-100k, 58.3% for AGIs over 100k)
Likely homosexual households (counted as self-reported same-sex unmarried-partner households)
Lesbian couples: 0.3% of all households
Gay men: 0.1% of all households
Household received Food Stamps/SNAP in the past 12 months: 2,108 Household did not receive Food Stamps/SNAP in the past 12 months: 21,772
Women who had a birth in the past 12 months: 665 (512 now married, 163 unmarried) Women who did not have a birth in the past 12 months: 14,542 (5,548 now married, 8,992 unmarried)
Housing units in zip code 33511 with a mortgage: 9,254 (799 second mortgage, 7 home equity loan, 672 both second mortgage and home equity loan) Houses without a mortgage: 241
Median monthly owner costs for units with a mortgage: $1,687 Median monthly owner costs for units without a mortgage: $550
Residents with income below the poverty level in 2022:
This zip code:
12.3%
Whole state:
12.7%
Residents with income below 50% of the poverty level in 2022:
This zip code:
7.4%
Whole state:
6.6%
Median number of rooms in houses and condos:
Here:
6.6
State:
5.9
Median number of rooms in apartments:
Here:
4.3
State:
4.2
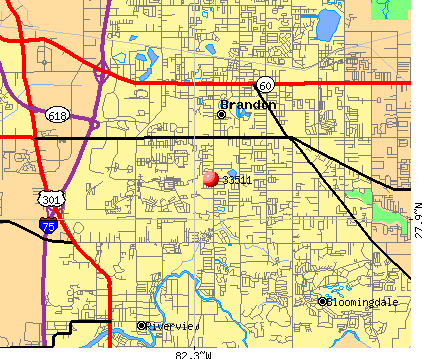
Notable locations in this zip code not listed on our city pages
Notable locations in zip code 33511: Brandon Center (A), Regency Park Brandon (B), Pinelake Office Park (C), Parsons Professional Park (D), Lumsden Executive Park (E), Lithia-Oakwood Business Center (F), Kings Avenue Executive Park (G), Executive Park of Valrico (H), Bloomingdale Executive Park (I), Clayton Plaza (J), La Viva Plaza (K), Oak Park Plaza (L), Hillsborough County Fire Rescue Station 7 Brandon South (M), The Brandon Professional Building (N), Brandon Regional Library (O). Display/hide their locations on the map
Shopping Centers: Westfield Shoppingtown Brandon Shopping Center (1), Lake Brandon Village Shopping Center (2), Lake Brandon Plaza Shopping Center (3), King Row Shopping Center (4). Display/hide their locations on the map
Churches in zip code 33511 include: Berean Bible Community Church (A), Life Center of Brandon (B), Primera Iglesia Cristiana Hispana de Brandon (C), Brandon Heights Baptist Church (D). Display/hide their locations on the map
In group quarters: 603 (-1 institutionalized population)
Size of family households: 6,053 2-persons, 4,235 3-persons, 2,860 4-persons, 1,325 5-persons, 527 6-persons, 266 7-or-more-persons
Size of nonfamily households: 6,589 1-person, 1,695 2-persons, 246 3-persons
7,644 married couples with children.
4,323 single-parent households (715 men, 3,608 women).
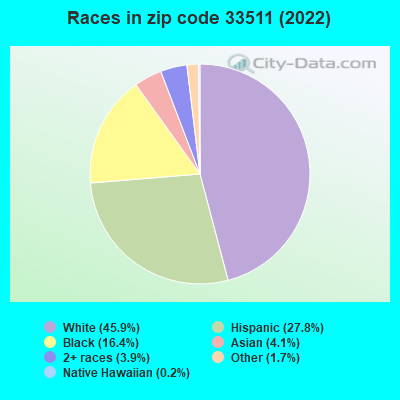
71.8% of residents of 33511 zip code speak English at home.
20.5% of residents speak Spanish at home (61% very well, 17% well, 14% not well, 8% not at all).
4.3% of residents speak other Indo-European language at home (78% very well, 8% well, 11% not well, 3% not at all).
1.7% of residents speak Asian or Pacific Island language at home (72% very well, 18% well, 8% not well, 2% not at all).
1.5% of residents speak other language at home (92% very well, 7% well, 1% not at all).
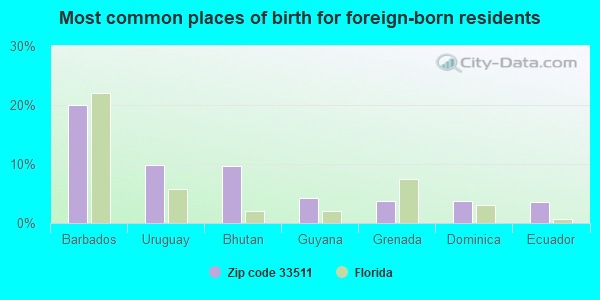
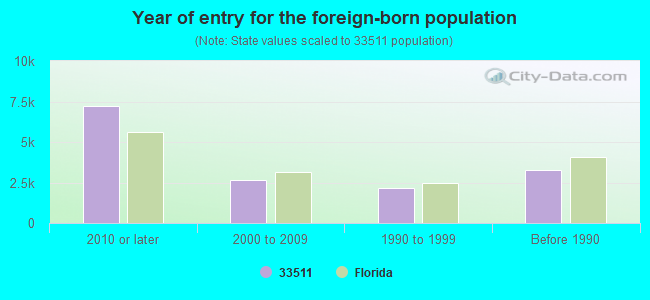
Foreign born population: 11,555 (19.1%) (54.6% of them are naturalized citizens)
Major facilities with environmental interests located in this zip code:
SHELL #100905 (1901 W BRANDON BLVD in BRANDON, FL)
STATE MASTER (FDM) - WAFR-FLG911781, INDUSTRIAL WASTEWATER PROGRAM National Pollutant Discharge Elimination System NON-MAJOR (Tracking pollutant discharge elimination systems) - permit Business SIC classification: GASOLINE SERVICE STATIONS Organizations: ENVIROTRAC ENVIRONMENTAL SERVICES (CONTACT/APPLICANT)
, WILLIAM HEIM (CONTACT/OWNER)
, ENVIROTRAC ENVIRONMENTAL SERVICES (CONTACT/PERMIT)
, SHELL OIL PRODUCTS US (CONTACT/PERMIT)
Alternative names: SHELL STATION NO. 100905
7-ELEVEN STORE NO. 23770 (1020 KINGS AVE in BRANDON, FL)
National Pollutant Discharge Elimination System NON-MAJOR (Tracking pollutant discharge elimination systems) - permit National Pollutant Discharge Elimination System NON-MAJOR (Tracking pollutant discharge elimination systems) - permit National Pollutant Discharge Elimination System NON-MAJOR (Tracking pollutant discharge elimination systems) - permit Business SIC classification: GASOLINE SERVICE STATIONS Organizations: WILLO SMITH (CONTACT/OWNER)
Alternative names: SEVEN-ELEVEN FOOD #23770, 7-ELEVEN STORE #23770, FDEP
ALLIED TIRES AND SERVICE #2545 (214 E BRANDON BLVD in BRANDON, FL)
STATE MASTER (FDM) - CHAZ-FLD981858368, HAZARDOUS WASTE REGULATION PROGRAM Small Quantity Generators, between 100 kg and 1000 kg of hazardous waste/month (Resource Conservation and Recovery Act (tracking hazardous waste)) - notification Business SIC classification: AUTO AND HOME SUPPLY STORES Organizations: ALLIED TIRE SALES INC, BOB O`NEIL (CONTACT/OWNER)
, GOODYEAR TIRE AND RUBBER CO (CONTACT/OWNER)
Alternative names: ALLIED TIRE SALES INC
COURTESY CHRYSLER JEEP (1728 W BRANDON BLVD in BRANDON, FL)
STATE MASTER (FDM) - CHAZ-FLD064687189, HAZARDOUS WASTE REGULATION PROGRAM Small Quantity Generators, between 100 kg and 1000 kg of hazardous waste/month (Resource Conservation and Recovery Act (tracking hazardous waste)) - notification Business SIC classification: MOTOR VEHICLE DEALERS (NEW AND USED) Organizations: ASBURY AUTOMOTIVE TAMPA LP (CONTACT/OWNER)
Alternative names: BRANDON CHRYSLER PLYMOUTH
RENNAISSANCE SUBDIVISION (3409 WEST SAM ALLEN ROAD in PLANT CITY, FL)
National Pollutant Discharge Elimination System NON-MAJOR (Tracking pollutant discharge elimination systems) - permit National Pollutant Discharge Elimination System NON-MAJOR (Tracking pollutant discharge elimination systems) - permit Organizations: PATRICK HIGH (CONTACT/OWNER)
Alternative names: RENAISSANCE ESTATES
ASPEN COVE APARTMENTS (S SIDE OF CAUSEWAY BLVD E OF U in BRANDON, FL)
National Pollutant Discharge Elimination System NON-MAJOR (Tracking pollutant discharge elimination systems) - permit National Pollutant Discharge Elimination System NON-MAJOR (Tracking pollutant discharge elimination systems) - permit Organizations: DAVID G MCDANIEL (CONTACT/OWNER)
Alternative names: CONTRAVEST INC
KINGSWOOD ELEMENTARY SCHOOL (3102 S KINGS AVE in BRANDON, FL)
(Geographic Names Information System) (National Center for Education Statistics) - STATE ID-2261 Organizations: HILLSBOROUGH COUNTY SCHOOL DISTRICT (SCHOOL DISTRICT)
MINTZ ELEMENTARY SCHOOL (1510 HEATHER LAKES BLVD in BRANDON, FL)
(National Center for Education Statistics) - STATE ID-3061 Organizations: HILLSBOROUGH COUNTY SCHOOL DISTRICT (SCHOOL DISTRICT)
BLOOMINGDALE OAKS EXECUTIVE PA (1/4 MILE E OF BELL SHOALS ONBL in BRANDON, FL)
National Pollutant Discharge Elimination System NON-MAJOR (Tracking pollutant discharge elimination systems) - permit Organizations: JIM MCCULLAGH (CONTACT/OWNER)
OAKWOOD TERRACE TOWNHOMES (SOUTH OF HIGHWAY 60, 1/8 MILE in VALRICO, FL)
National Pollutant Discharge Elimination System NON-MAJOR (Tracking pollutant discharge elimination systems) - permit Organizations: MIKE WILLENBACHER (CONTACT/OWNER)
Alternative names: WEST CHASE PROFESSIONA LCENTER
ALAFIA SANCTUARY (JOHN MOORE ROAD in BRANDON, FL)
National Pollutant Discharge Elimination System NON-MAJOR (Tracking pollutant discharge elimination systems) - permit Organizations: JAMES KRESS (CONTACT/OWNER)
APEC - HWY 301 GAS/CONVENIENCE (4911 N US HWY 301 in TAMPA, FL)
National Pollutant Discharge Elimination System NON-MAJOR (Tracking pollutant discharge elimination systems) - permit Organizations: WILLIAM MCKNIGHT (CONTACT/OWNER)
LITTLE ALAFIA CREEK ESTATES (TRAPNELL ROAD in PLANT CITY, FL)
National Pollutant Discharge Elimination System NON-MAJOR (Tracking pollutant discharge elimination systems) - permit Organizations: PATRICK HIGH (CONTACT/OWNER)
Housing units lacking complete plumbing facilities: 0.6% Housing units lacking complete kitchen facilities: 0.9%
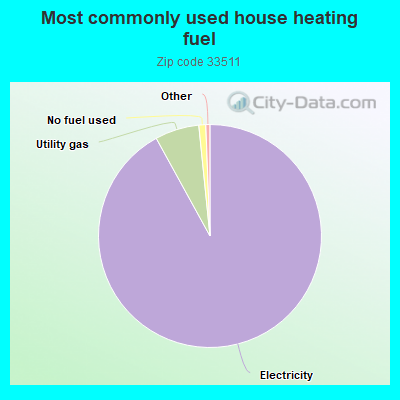
92.0%Electricity
6.4%Utility gas
1.0%No fuel used
Population in 1990: 29,861. Population change in the 1990s: +15,066 (+50.5%).
Place of birth for U.S.-born residents:
This state: 21,676
Northeast: 9,002
Midwest: 5,396
South: 7,363
West: 2,378
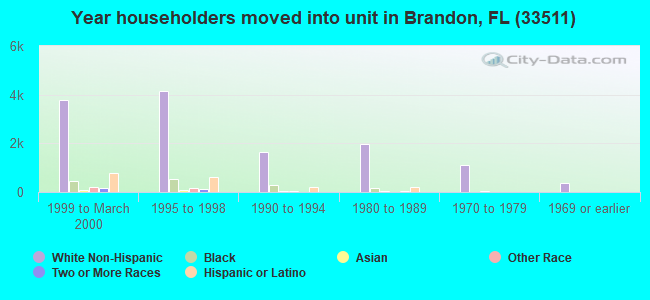
42% of the 33511 zip code residents lived in the same house 5 years ago. Out of people who lived in different houses, 55% lived in this county. Out of people who lived in different counties, 50% lived in Florida.
82% of the 33511 zip code residents lived in the same house 1 year ago. Out of people who lived in different houses, 54% moved from this county. Out of people who lived in different houses, 13% moved from different county within same state. Out of people who lived in different houses, 14% moved from different state. Out of people who lived in different houses, 16% moved from abroad.
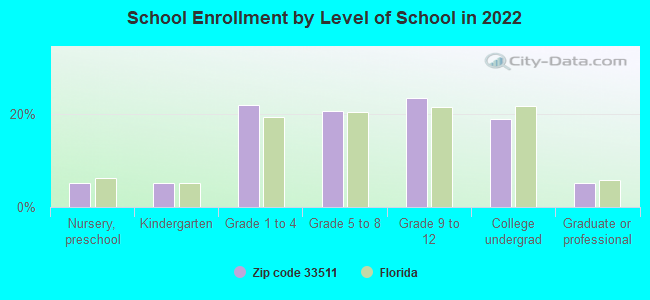
Private vs. public school enrollment:
Students in private schools in grades 1 to 8 (elementary and middle school): 952
Here:
16.3%
Florida:
15.8%
Students in private schools in grades 9 to 12 (high school): 416
Here:
12.9%
Florida:
12.9%
Students in private undergraduate colleges: 387
Here:
14.9%
Florida:
23.6%
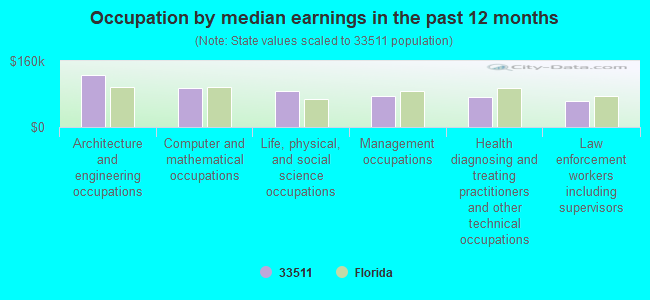
Occupation by median earnings in the past 12 months ($)
125,716Architecture and engineering occupations
95,282Computer and mathematical occupations
87,044Life, physical, and social science occupations
74,813Management occupations
72,544Health diagnosing and treating practitioners and other technical occupations
61,890Law enforcement workers including supervisors
Companies with federal contracts located in this zip code (BRANDON, FL):
BROCK SALES COMPANY INC (1155 PROVIDENCE RD STE C; small business) : $2,251,962 in 39 contractsfrom 2002 to 2006
Contracts for Individual Equipment, ADP Central Processing Unit (CPU, Computer), Digital, Radio Navigation Equipment, Airborne, Medical and Surgical Instruments, Equipment, and Supplies, and moreby Navy, Army, Office of Assistant Secretary for Health except national centers (disused code), Department of Defense, and others Signed by year:2000: $0; 2001: $0; 2002: $104,290; 2003: $161,546; 2004: $756,990; 2005: $1,047,468; 2006: $181,668.
Biggest contracts:
$877,238 with Navy for Individual Equipment. Signed on 2005-02-28. Completion date: 2005-06-30.
$275,000, same as above.Signed on 2004-04-30. Completion date: 2004-06-01.
$242,000 with Army for Individual Equipment. Signed on 2004-09-25. Completion date: 2004-11-15.
$111,626 with Army for ADP Central Processing Unit (CPU, Computer), Digital. Signed on 2003-01-10. Completion date: 2003-02-15.
CELESTAR CORPORATION (1971 W LUMSDEN ROAD, #311; small business)
$769,000 with Air Force for Logistics Support Services. Signed on 2005-09-21. Completion date: 2006-09-25.
CRAWFORD, JOHN (3410 HOLLAND DR; small business) : $268,962 in 47 contractsfrom 2001 to 2006
Contracts for Miscellaneous Service and Trade Equipment, Miscellaneous Furniture and Fixtures, Miscellaneous Printed Matter, Construction of Structures and Facilities -- Exhibit Design (Non-Building), and moreby Army Signed by year:2000: $0; 2001: $8,768; 2002: $55,884; 2003: $91,005; 2004: $45,622; 2005: $57,005; 2006: $10,678.
Biggest contracts:
$38,177 with Army for Miscellaneous Service and Trade Equipment. Signed on 2003-09-25. Completion date: 2003-10-31.
$15,238 with Army for Miscellaneous Furniture and Fixtures. Signed on 2002-12-18. Completion date: 2003-01-15.
$8,460 with Army for Miscellaneous Printed Matter. Signed on 2002-01-22. Completion date: 2002-02-05.
$8,020 with Army for Construction of Structures and Facilities -- Exhibit Design (Non-Building). Taking place in VA. Signed on 2002-02-25. Completion date: 2002-02-17.
PAUL BROWNE (1832 COYOTE PLACE; small business) : $222,327 in 5 contractsfrom 1999 to 2005
Contracts for Other Defense -- Basic Research (R&D), Miscellaneous Electric Power and Distribution Equipment, Connectors, Electrical, Other Defense -- Operational Systems Development (R&D) by Navy Signed by year:2000: $29,360; 2001: $186,308; 2002: $38,074; 2003: $0; 2004: $0; 2005: -$98,374; 2006: $0.
Biggest contracts:
$186,308 with Navy for Other Defense -- Basic Research (R&D). Signed on 2001-07-18. Completion date: 2002-07-17.
$66,959, same as above.Signed on 1999-10-29. Completion date: 2000-05-31.
$38,074 with Navy for Miscellaneous Electric Power and Distribution Equipment. Signed on 2002-09-12. Completion date: 2003-01-24.
$29,360 with Navy for Connectors, Electrical. Signed on 2000-01-06. Completion date: 2000-02-23.
COST CONTROL SOLUTIONS (220 W BRANDON BLVD STE 9; small business) : $147,215 in 2 contractsin 2000
$78,400 with Army for Transcription Services. Taking place in DC. Signed on 2000-04-01. Completion date: 2000-06-30.
$68,815, same as above.Signed on 2000-11-01. Completion date: 2001-01-31.
PROFESSIONAL DISPLAYS OF TAMPA (3410 HOLLAND DR; small business) : $78,479 in 12 contractsfrom 2002 to 2006
Contracts for Miscellaneous Items, Signs, Advertising Displays, and Identification Plates, Miscellaneous Printed Matter, Cabinets, Lockers, Bins, and Shelving, and moreby Air Force, Army Signed by year:2000: $0; 2001: $0; 2002: $30,347; 2003: $22,374; 2004: $8,866; 2005: $11,967; 2006: $4,925.
Biggest contracts:
$9,227 with Air Force for Miscellaneous Items. Signed on 2005-04-28. Completion date: 2005-05-05.
$9,144 with Army for Signs, Advertising Displays, and Identification Plates. Signed on 2003-02-26. Completion date: 2003-03-28.
$9,108 with Army for Miscellaneous Printed Matter. Signed on 2002-08-06. Completion date: 2002-08-30.
$8,866 with Army for Cabinets, Lockers, Bins, and Shelving. Signed on 2004-04-08. Completion date: 2004-05-07.
Top industries in this zip code by the number of employees in 2005:
2010 - 2018 National Fire Incident Reporting System (NFIRS) incidents
Based on the data from the years 2010 - 2018 the average number of fire incidents per year is 62. The highest number of fires - 107 took place in 2010, and the least - 0 in 2016. The data has a dropping trend.
When looking into fire subcategories, the most incidents belonged to: Structure Fires (38.4%), and Outside Fires (33.2%).
Fire incident types reported to NFIRS in Zip Code 33511


 Nearest zip codes: 33510, 33594, 33569, 33578, 33596, 33619.


 Based on the data from the years 2010 - 2018 the average number of fire incidents per year is 62. The highest number of fires - 107 took place in 2010, and the least - 0 in 2016. The data has a dropping trend.
 When looking into fire subcategories, the most incidents belonged to: Structure Fires (38.4%), and Outside Fires (33.2%).