Estimated zip code population in 2022: 36,179 Zip code population in 2010: 21,898 Zip code population in 2000: 12,019
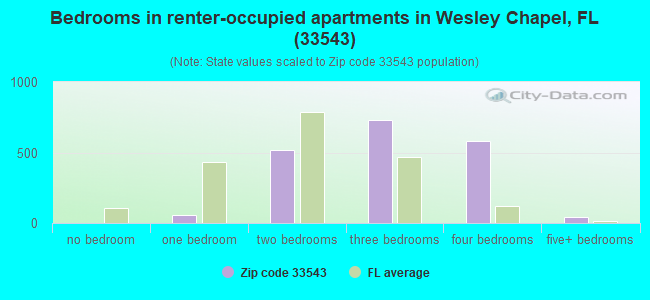
Houses and condos: 13,853 Renter-occupied apartments: 1,940
% of renters here:
15%
State:
33%
March 2022 cost of living index in zip code 33543: 98.8 (near average, U.S. average is 100)
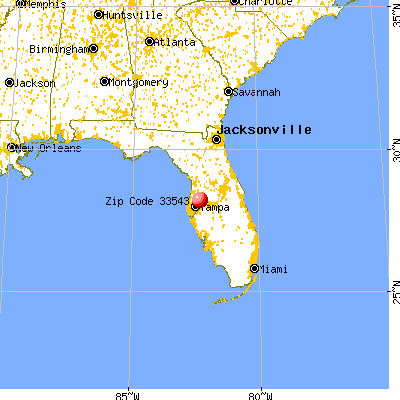
Land area: 20.6 sq. mi. Water area: 0.0 sq. mi.
Population density: 1,757 people per square mile
(low).
OSM Map
General Map
Google Map
MSN Map
OSM Map
General Map
Google Map
MSN Map
OSM Map
General Map
Google Map
MSN Map
OSM Map
General Map
Google Map
MSN Map
Please wait while loading the map...
Real estate property taxes paid for housing units in 2022:
This zip code:
0.9% ($3,658)
Florida:
0.7% ($2,529)
Median real estate property taxes paid for housing units with mortgages in 2022: $3,829 (1.0%) Median real estate property taxes paid for housing units with no mortgage in 2022: $3,250 (0.9%)
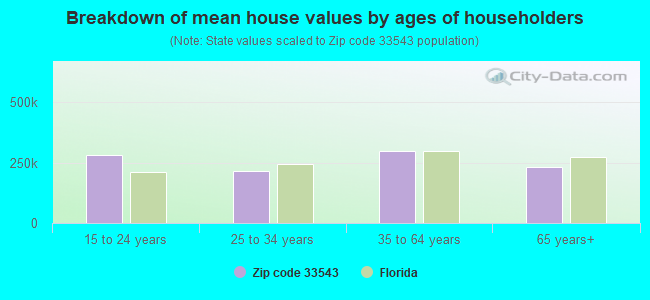
Estimated median house/condo value in 2022: $390,940
33543:
$390,940
Florida:
$354,100
According to our research of Florida and other state lists, there were 25 registered sex offenders living in 33543 zip code as of April 26, 2024. The ratio of all residents to sex offenders in zip code 33543 is 978 to 1. The ratio of registered sex offenders to all residents in this zip code is lower than the state average.
Median resident age:
This zip code:
38.5 years
Florida median age:
42.7 years
Average household size:
This zip code:
2.8 people
Florida:
2.5 people
Averages for the 2020 tax year for zip code 33543, filed in 2021:
Average Adjusted Gross Income (AGI) in 2020: $84,839 (Individual Income Tax Returns)
Here:
$84,839
State:
$82,200
Salary/wage: $77,098 (reported on 83.4% of returns)
Here:
$77,098
State:
$58,347
(% of AGI for various income ranges: 1132.5% for AGIs below $25k, 3553.4% for AGIs $25k-50k, 6459.0% for AGIs $50k-75k, 9630.1% for AGIs $75k-100k, 19057.6% for AGIs $100k-200k, 68267.5% for AGIs over 200k)
Taxable interest for individuals: $1,328 (reported on 27.7% of returns)
This zip code:
$1,328
Florida:
$4,272
(% of AGI for various income ranges: 15.6% for AGIs below $25k, 20.6% for AGIs $25k-50k, 37.3% for AGIs $50k-75k, 58.3% for AGIs $75k-100k, 71.6% for AGIs $100k-200k, 481.5% for AGIs over 200k)
Ordinary dividends: $4,689 (reported on 20.0% of returns)
Here:
$4,689
State:
$15,863
(% of AGI for various income ranges: 22.0% for AGIs below $25k, 28.1% for AGIs $25k-50k, 78.4% for AGIs $50k-75k, 110.5% for AGIs $75k-100k, 179.4% for AGIs $100k-200k, 1681.2% for AGIs over 200k)
Net capital gain/loss in AGI: +$18,787 (reported on 19.5% of returns)
Here:
+$18,787
State:
+$62,983
(% of AGI for various income ranges: 16.3% for AGIs below $25k, 34.1% for AGIs $25k-50k, 93.3% for AGIs $50k-75k, 140.6% for AGIs $75k-100k, 391.8% for AGIs $100k-200k, 10492.9% for AGIs over 200k)
Profit/loss from business: +$9,900 (reported on 19.4% of returns)
Here:
+$9,900
State:
+$9,719
(% of AGI for various income ranges: 125.9% for AGIs below $25k, 184.0% for AGIs $25k-50k, 172.5% for AGIs $50k-75k, 230.5% for AGIs $75k-100k, 351.8% for AGIs $100k-200k, 2113.1% for AGIs over 200k)
Taxable individual retirement arrangement distribution: $25,755 (reported on 8.1% of returns)
33543:
$25,755
Florida:
$24,823
(% of AGI for various income ranges: 56.6% for AGIs below $25k, 109.5% for AGIs $25k-50k, 209.1% for AGIs $50k-75k, 358.4% for AGIs $75k-100k, 470.7% for AGIs $100k-200k, 2640.2% for AGIs over 200k)
Self-employed (Keogh) retirement plans: $26,500 (reported on 0.2% of returns)
33543:
$26,500
Florida:
$29,694
(% of AGI for various income ranges: 220.8% for AGIs over 200k)
Total itemized deductions: $32,950 (reported on 11.1% of returns)
Here:
$32,950
State:
$45,393
(% of AGI for various income ranges: 40.7% for AGIs below $25k, 156.6% for AGIs $25k-50k, 378.2% for AGIs $50k-75k, 547.8% for AGIs $75k-100k, 929.5% for AGIs $100k-200k, 4949.8% for AGIs over 200k)
Charity contributions: $9,727 (reported on 8.8% of returns)
Here:
$9,727
State:
$20,178
(% of AGI for various income ranges: 3.2% for AGIs below $25k, 22.0% for AGIs $25k-50k, 67.3% for AGIs $50k-75k, 78.5% for AGIs $75k-100k, 202.7% for AGIs $100k-200k, 1590.4% for AGIs over 200k)
Taxes paid: $7,257 (reported on 11.0% of returns)
33543:
$7,257
State:
$6,967
(% of AGI for various income ranges: 7.9% for AGIs below $25k, 34.7% for AGIs $25k-50k, 86.9% for AGIs $50k-75k, 125.4% for AGIs $75k-100k, 222.0% for AGIs $100k-200k, 962.5% for AGIs over 200k)
Earned income credit: $2,165 (reported on 12.6% of returns)
Here:
$2,165
State:
$2,306
(% of AGI for various income ranges: 81.4% for AGIs below $25k, 68.2% for AGIs $25k-50k, 1.1% for AGIs $50k-75k)
Percentage of individuals using paid preparers for their 2020 taxes: 92.9%
Here:
93%
State:
92%
(% for various income ranges: 91.5% for AGIs below $25k, 93.2% for AGIs $25k-50k, 93.6% for AGIs $50k-75k, 93.6% for AGIs $75k-100k, 92.8% for AGIs $100k-200k, 95.5% for AGIs over 200k)
Averages for the 2012 tax year for zip code 33543, filed in 2013:
Average Adjusted Gross Income (AGI) in 2012: $62,510 (Individual Income Tax Returns)
Here:
$62,510
State:
$60,316
Salary/wage: $55,324 (reported on 85.1% of returns)
Here:
$55,324
State:
$45,277
(% of AGI for various income ranges: 73.8% for AGIs below $25k, 81.8% for AGIs $25k-50k, 80.8% for AGIs $50k-75k, 82.4% for AGIs $75k-100k, 84.9% for AGIs $100k-200k, 42.2% for AGIs over 200k)
Taxable interest for individuals: $1,052 (reported on 30.9% of returns)
This zip code:
$1,052
Florida:
$3,587
(% of AGI for various income ranges: 1.7% for AGIs below $25k, 0.5% for AGIs $25k-50k, 0.5% for AGIs $50k-75k, 0.3% for AGIs $75k-100k, 0.3% for AGIs $100k-200k, 0.7% for AGIs over 200k)
Ordinary dividends: $5,792 (reported on 17.8% of returns)
Here:
$5,792
State:
$12,831
(% of AGI for various income ranges: 3.3% for AGIs below $25k, 1.5% for AGIs $25k-50k, 0.9% for AGIs $50k-75k, 0.6% for AGIs $75k-100k, 0.7% for AGIs $100k-200k, 4.6% for AGIs over 200k)
Net capital gain/loss in AGI: +$14,184 (reported on 12.9% of returns)
Here:
+$14,184
State:
+$33,493
(% of AGI for various income ranges: 0.2% for AGIs $25k-50k, 0.5% for AGIs $50k-75k, 0.3% for AGIs $75k-100k, 0.7% for AGIs $100k-200k, 15.0% for AGIs over 200k)
Profit/loss from business: +$8,357 (reported on 15.1% of returns)
Here:
+$8,357
State:
+$10,012
(% of AGI for various income ranges: 7.0% for AGIs below $25k, 1.6% for AGIs $25k-50k, 1.5% for AGIs $50k-75k, 1.6% for AGIs $75k-100k, 1.5% for AGIs $100k-200k, 2.3% for AGIs over 200k)
Taxable individual retirement arrangement distribution: $18,132 (reported on 9.2% of returns)
33543:
$18,132
Florida:
$21,544
(% of AGI for various income ranges: 3.4% for AGIs below $25k, 2.4% for AGIs $25k-50k, 2.3% for AGIs $50k-75k, 2.2% for AGIs $75k-100k, 2.7% for AGIs $100k-200k, 3.4% for AGIs over 200k)
Self-employment retirement plans: $24,367 (reported on 0.3% of returns)
33543:
$24,367
Florida:
$20,611
Total itemized deductions: $19,989 (19% of AGI, reported on 35.9% of returns)
Here:
$19,989
State:
$25,533
Here:
19.5% of AGI
State:
18.0% of AGI
(% of AGI for various income ranges: 11.6% for AGIs below $25k, 11.9% for AGIs $25k-50k, 12.5% for AGIs $50k-75k, 12.2% for AGIs $75k-100k, 12.2% for AGIs $100k-200k, 8.1% for AGIs over 200k)
Charity contributions: $3,716 (reported on 29.2% of returns)
Here:
$3,716
State:
$5,698
(% of AGI for various income ranges: 0.9% for AGIs below $25k, 1.2% for AGIs $25k-50k, 1.6% for AGIs $50k-75k, 1.5% for AGIs $75k-100k, 2.0% for AGIs $100k-200k, 2.4% for AGIs over 200k)
Taxes paid: $4,624 (reported on 34.9% of returns)
33543:
$4,624
State:
$6,203
(% of AGI for various income ranges: 1.9% for AGIs below $25k, 2.2% for AGIs $25k-50k, 2.5% for AGIs $50k-75k, 2.7% for AGIs $75k-100k, 2.9% for AGIs $100k-200k, 2.5% for AGIs over 200k)
Earned income credit: $2,197 (reported on 15.4% of returns)
Here:
$2,197
State:
$2,372
(% of AGI for various income ranges: 6.4% for AGIs below $25k, 1.0% for AGIs $25k-50k)
Percentage of individuals using paid preparers for their 2012 taxes: 41.9%
Here:
42%
State:
54%
(% for various income ranges: 39.2% for AGIs below $25k, 41.0% for AGIs $25k-50k, 41.8% for AGIs $50k-75k, 41.9% for AGIs $75k-100k, 44.8% for AGIs $100k-200k, 69.6% for AGIs over 200k)
Averages for the 2004 tax year for zip code 33543, filed in 2005:
Average Adjusted Gross Income (AGI) in 2004: $56,524 (Individual Income Tax Returns)
Here:
$56,524
State:
$50,523
Salary/wage: $52,167 (reported on 88.5% of returns)
Here:
$52,167
State:
$39,563
(% of AGI for various income ranges: 164.7% for AGIs below $10k, 76.2% for AGIs $10k-25k, 85.2% for AGIs $25k-50k, 87.4% for AGIs $50k-75k, 89.2% for AGIs $75k-100k, 73.1% for AGIs over 100k)
Taxable interest for individuals: $1,126 (reported on 50.2% of returns)
This zip code:
$1,126
Florida:
$3,211
(% of AGI for various income ranges: 8.5% for AGIs below $10k, 2.2% for AGIs $10k-25k, 1.0% for AGIs $25k-50k, 0.7% for AGIs $50k-75k, 0.6% for AGIs $75k-100k, 1.0% for AGIs over 100k)
Taxable dividends: $2,049 (reported on 23.8% of returns)
Here:
$2,049
State:
$6,129
(% of AGI for various income ranges: 8.2% for AGIs below $10k, 1.3% for AGIs $10k-25k, 0.6% for AGIs $25k-50k, 0.5% for AGIs $50k-75k, 0.4% for AGIs $75k-100k, 1.2% for AGIs over 100k)
Net capital gain/loss: +$9,248 (reported on 20.2% of returns)
Here:
+$9,248
State:
+$27,205
(% of AGI for various income ranges: -4.9% for AGIs below $10k, 0.5% for AGIs $10k-25k, 0.6% for AGIs $25k-50k, 0.4% for AGIs $50k-75k, 0.9% for AGIs $75k-100k, 7.6% for AGIs over 100k)
Profit/loss from business: +$8,757 (reported on 15.9% of returns)
Here:
+$8,757
State:
+$10,634
(% of AGI for various income ranges: -7.7% for AGIs below $10k, 6.9% for AGIs $10k-25k, 3.0% for AGIs $25k-50k, 2.0% for AGIs $50k-75k, 1.6% for AGIs $75k-100k, 2.4% for AGIs over 100k)
IRA payment deduction: $2,895 (reported on 2.8% of returns)
33543:
$2,895
Florida:
$3,082
(% of AGI for various income ranges: 0.9% for AGIs below $10k, 0.2% for AGIs $10k-25k, 0.2% for AGIs $25k-50k, 0.1% for AGIs $50k-75k, 0.2% for AGIs $75k-100k, 0.1% for AGIs over 100k)
Self-employed pension: $13,679 (reported on 0.5% of returns)
Here:
$13,679
Florida:
$15,857
(% of AGI for various income ranges: 2.0% for AGIs below $10k, 0.2% for AGIs $50k-75k, 0.2% for AGIs over 100k)
Total itemized deductions: $17,305 (21% of AGI, reported on 49.6% of returns)
Here:
$17,305
State:
$20,370
Here:
21.2% of AGI
State:
20.7% of AGI
(% of AGI for various income ranges: 37.6% for AGIs below $10k, 16.0% for AGIs $10k-25k, 17.3% for AGIs $25k-50k, 16.9% for AGIs $50k-75k, 16.6% for AGIs $75k-100k, 12.3% for AGIs over 100k)
Charity contributions deductions: $2,834 (3% of AGI, reported on 42.1% of returns)
Here:
$2,834
State:
$4,064
Here:
3.3% of AGI
State:
3.8% of AGI
(% of AGI for various income ranges: 2.1% for AGIs below $10k, 1.5% for AGIs $10k-25k, 1.7% for AGIs $25k-50k, 1.8% for AGIs $50k-75k, 2.1% for AGIs $75k-100k, 2.5% for AGIs over 100k)
Total tax: $8,220 (reported on 82.1% of returns)
33543:
$8,220
State:
$9,431
(% of AGI for various income ranges: 5.7% for AGIs below $10k, 4.3% for AGIs $10k-25k, 6.8% for AGIs $25k-50k, 8.5% for AGIs $50k-75k, 10.1% for AGIs $75k-100k, 18.0% for AGIs over 100k)
Earned income credit: $1,647 (reported on 9.7% of returns)
Here:
$1,647
State:
$1,808
Percentage of individuals using paid preparers for their 2004 taxes: 51.0%
Here:
51%
State:
60%
(% for various income ranges: 46.0% for AGIs below $10k, 52.2% for AGIs $10k-25k, 50.9% for AGIs $25k-50k, 51.4% for AGIs $50k-75k, 47.1% for AGIs $75k-100k, 57.7% for AGIs over 100k)
Likely homosexual households (counted as self-reported same-sex unmarried-partner households)
Lesbian couples: 0.1% of all households
Gay men: 0.1% of all households
Household received Food Stamps/SNAP in the past 12 months: 854 Household did not receive Food Stamps/SNAP in the past 12 months: 12,198
Women who had a birth in the past 12 months: 266 (229 now married, 43 unmarried) Women who did not have a birth in the past 12 months: 8,657 (4,359 now married, 4,301 unmarried)
Housing units in zip code 33543 with a mortgage: 8,033 (475 second mortgage, 19 home equity loan, 379 both second mortgage and home equity loan) Houses without a mortgage: 201
Median monthly owner costs for units with a mortgage: $1,932 Median monthly owner costs for units without a mortgage: $584
Residents with income below the poverty level in 2022:
This zip code:
7.7%
Whole state:
12.7%
Residents with income below 50% of the poverty level in 2022:
This zip code:
3.7%
Whole state:
6.6%
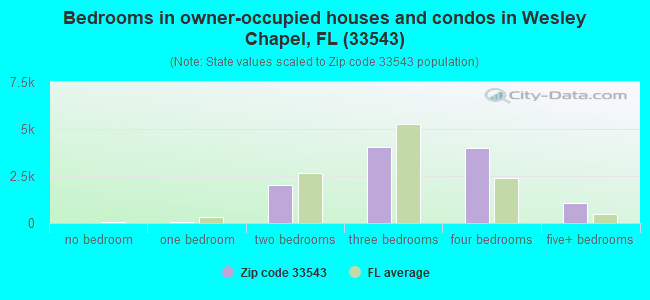
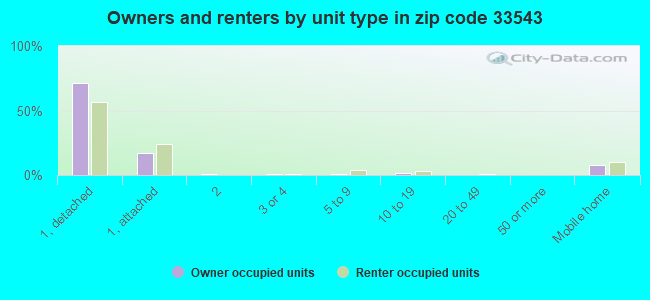
Median number of rooms in houses and condos:
Here:
6.5
State:
5.9
Median number of rooms in apartments:
Here:
5.7
State:
4.2
Notable locations in this zip code not listed on our city pages
Notable locations in zip code 33543: Pasco County Fire Rescue Station 16 (A), Pasco County Fire Rescue Station 26 (B). Display/hide their locations on the map
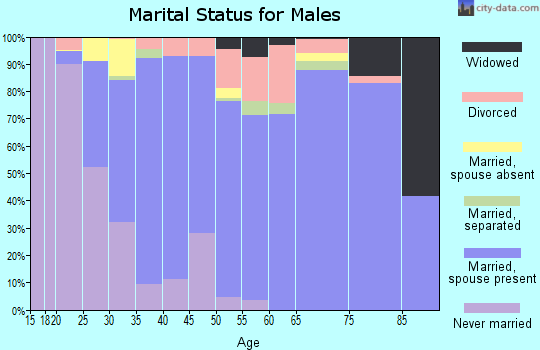
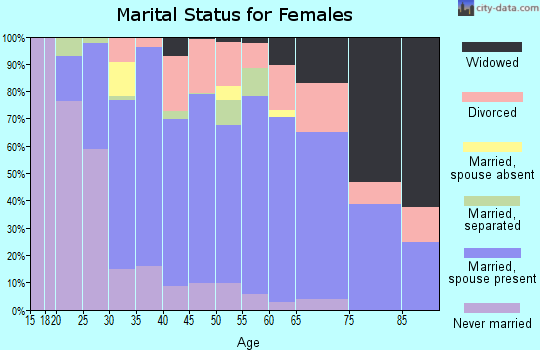
6,584 married couples with children.
1,963 single-parent households (524 men, 1,439 women).
70.3% of residents of 33543 zip code speak English at home.
16.9% of residents speak Spanish at home (74% very well, 14% well, 8% not well, 3% not at all).
5.3% of residents speak other Indo-European language at home (75% very well, 22% well, 4% not well).
5.1% of residents speak Asian or Pacific Island language at home (56% very well, 19% well, 22% not well, 3% not at all).
2.0% of residents speak other language at home (73% very well, 20% well, 7% not well, 1% not at all).
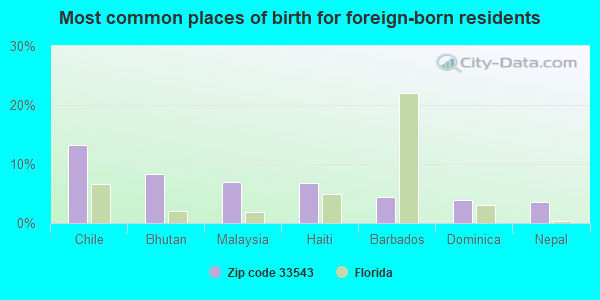
Foreign born population: 6,943 (19.2%) (67.1% of them are naturalized citizens)
This zip code:
19.2%
Whole state:
21.7%
13%Chile
8%Bhutan
7%Malaysia
7%Haiti
4%Barbados
4%Dominica
4%Nepal
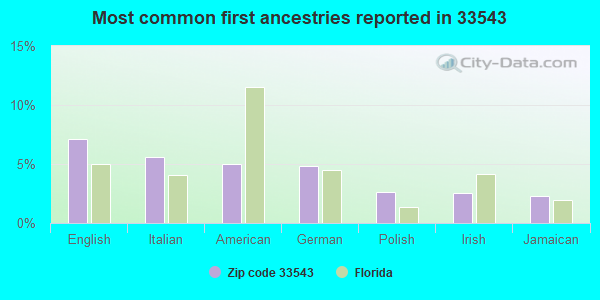
7%English
6%Italian
5%American
5%German
3%Polish
3%Irish
2%Jamaican
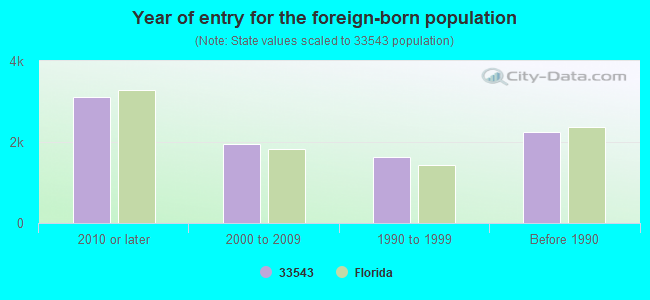
Year of entry for the foreign-born population
3,1022010 or later
1,9472000 to 2009
1,6401990 to 1999
2,249Before 1990
Major facilities with environmental interests located in this zip code:
SHELL - CITRUS COUNTRY (28009 STATE ROAD 54 in WESLEY CHAPEL, FL)
STATE MASTER (FDM) - WAFR-FLG910294, INDUSTRIAL WASTEWATER PROGRAM, WAFR-FLG911775, National Pollutant Discharge Elimination System NON-MAJOR (Tracking pollutant discharge elimination systems) - permit Business SIC classification: GASOLINE SERVICE STATIONS Organizations: ENVIROTRAC ENVIRONMENTAL SERVICES (CONTACT/AGENT)
, ATEC ASSOCIATES, INC. (CONTACT/AGENT)
, WILLIAM HEIM (CONTACT/OWNER)
, ENVIROTRAC ENVIRONMENTAL SERVICES (CONTACT/PERMIT)
, SHELL OIL PRODUCTS US (CONTACT/PERMIT)
Alternative names: CITRUS COUNTY GROVES
MEADOW PT MANSFIELD BLVD PH DE (FROM BEARDSLEY DR S TO HILLS C in WESLEY CHAPEL, FL)
National Pollutant Discharge Elimination System NON-MAJOR (Tracking pollutant discharge elimination systems) - permit National Pollutant Discharge Elimination System NON-MAJOR (Tracking pollutant discharge elimination systems) - permit Organizations: DONALD A BUCK (CONTACT/OWNER)
Alternative names: MEADOW POINTE 11 CDD, WAL DEN GREENE DEVELOPERS INC
MEADOW POINTE PARCEL 17 UNIT 3 (1/2 MI NE COUNTY LINE RD @ MAN in WESLEY CHAPEL, FL)
National Pollutant Discharge Elimination System NON-MAJOR (Tracking pollutant discharge elimination systems) - permit National Pollutant Discharge Elimination System NON-MAJOR (Tracking pollutant discharge elimination systems) - permit Organizations: PETER J QUINN (CONTACT/OWNER)
, DONALD A BUCK (CONTACT/OWNER)
Alternative names: TROUT CREEK DEVELOPMENT CORP, WAL DEN GREENE DEVELOPERS INC
SAND PINE ELEMENTARY SCHOOL (29040 COUNTY LINE ROAD in WESLEY CHAPEL, FL)
(National Center for Education Statistics) - STATE ID-2061 Organizations: PASCO COUNTY SCHOOL DISTRICT (SCHOOL DISTRICT)
QUAIL HOLLOW CLEANERS (27415 SR 54 in WESLEY CHAPEL, FL)
AIR MINOR (AIRS/AFS) (Resource Conservation and Recovery Act (tracking hazardous waste)) Business SIC classification: DRYCLEANING PLANTS, EXCEPT RUG CLEANING Organizations: RAJ PATEL (CONTACT/OWNER)
POOL TIME SUPPLIES & SERVICES, INC. (1824 BRUCE B. DOWNS BLVD. in WESLEY CHAPEL, FL)
(Integrated Compliance Information System) - ICIS-04-2005-3000, FORMAL ENFORCEMENT ACTION
MEADOW POINTE PAR 16 UT 2A&2B (S/COUNTY LINE & MANSFIELD BLVD in WESLEY CHAPEL, FL)
National Pollutant Discharge Elimination System NON-MAJOR (Tracking pollutant discharge elimination systems) - permit National Pollutant Discharge Elimination System NON-MAJOR (Tracking pollutant discharge elimination systems) - permit Alternative names: MEADOW POINTE II CDD, WAL DEN GREENE DEVELOPERS INC
NORTHWOOD RECREATION CTR (NORTHWOOD PALMS BLVD in WESLEY CHAPEL, FL)
National Pollutant Discharge Elimination System NON-MAJOR (Tracking pollutant discharge elimination systems) - permit National Pollutant Discharge Elimination System NON-MAJOR (Tracking pollutant discharge elimination systems) - permit Alternative names: NORTHWOOD UNIT 48 5 6 8 & 9, NORTHWOOD UNITS 2A & 3A, US HOME CORP
MEADOW POINTE PARCEL 16 UNIT 1 (MANSFIELD BLVD CD & BEARDSLEYD in WESLEY CHAPEL, FL)
National Pollutant Discharge Elimination System NON-MAJOR (Tracking pollutant discharge elimination systems) - permit National Pollutant Discharge Elimination System NON-MAJOR (Tracking pollutant discharge elimination systems) - permit Alternative names: MEADOW POINTE II CDD, WAL DEN GREENE DEVELOPERS INC
HAWKS HAVEN PHASE 1 (5307 FOX HUNT DRIVE in ZEPHYRHILLS, FL)
National Pollutant Discharge Elimination System NON-MAJOR (Tracking pollutant discharge elimination systems) - permit National Pollutant Discharge Elimination System NON-MAJOR (Tracking pollutant discharge elimination systems) - permit Alternative names: FC HAWKS HAVEN INC
NEW RIVER LAKES PHASE I (STATE RD 54 in WESLEY CHAPEL, FL)
National Pollutant Discharge Elimination System NON-MAJOR (Tracking pollutant discharge elimination systems) - permit National Pollutant Discharge Elimination System NON-MAJOR (Tracking pollutant discharge elimination systems) - permit Alternative names: KEARNEY DEVELOPMENT CO INC, NEW RIVER PARTNERS LTD
LEXINGTON OAKS VILLAGE 31 (S.R. 54 in WESLEY CHAPEL, FL)
National Pollutant Discharge Elimination System NON-MAJOR (Tracking pollutant discharge elimination systems) - permit Organizations: STEVE BENNETT (CONTACT/OWNER)
COUNTY LIN RD. @ TIMBER TRACE (COUNTY LINE RD. @ TIMBER TRACE in WESLEY CHAPEL, FL)
National Pollutant Discharge Elimination System NON-MAJOR (Tracking pollutant discharge elimination systems) - permit Organizations: JAMES WIDMAN (CONTACT/OWNER)
Housing units lacking complete plumbing facilities: 0.2% Housing units lacking complete kitchen facilities: 0.9%
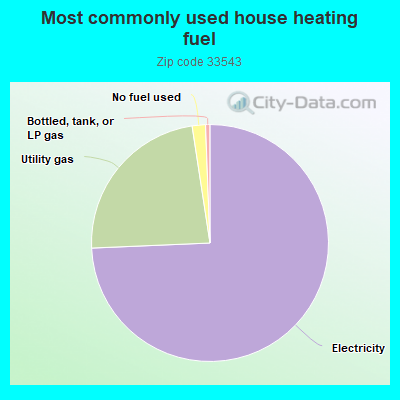
74.1%Electricity
23.2%Utility gas
1.8%No fuel used
0.6%Bottled, tank, or LP gas
Population in 1990: 4,073. Population change in the 1990s: +7,946 (+195.1%).
Place of birth for U.S.-born residents:
This state: 11,851
Northeast: 7,044
Midwest: 4,001
South: 3,161
West: 1,156
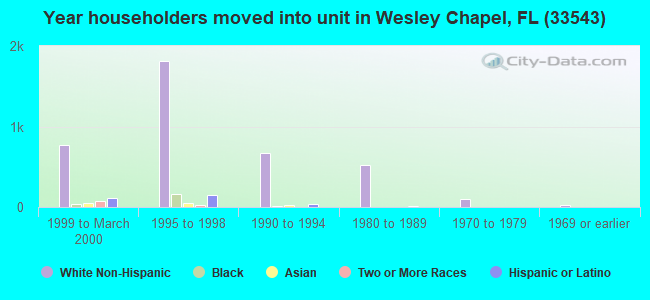
37% of the 33543 zip code residents lived in the same house 5 years ago. Out of people who lived in different houses, 13% lived in this county. Out of people who lived in different counties, 50% lived in Florida.
89% of the 33543 zip code residents lived in the same house 1 year ago. Out of people who lived in different houses, 23% moved from this county. Out of people who lived in different houses, 38% moved from different county within same state. Out of people who lived in different houses, 43% moved from different state. Out of people who lived in different houses, 1% moved from abroad.
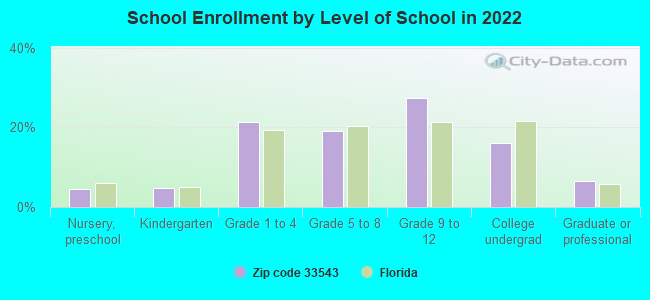
Private vs. public school enrollment:
Students in private schools in grades 1 to 8 (elementary and middle school): 596
Here:
15.6%
Florida:
15.8%
Students in private schools in grades 9 to 12 (high school): 145
Here:
5.6%
Florida:
12.9%
Students in private undergraduate colleges: 324
Here:
21.5%
Florida:
23.6%
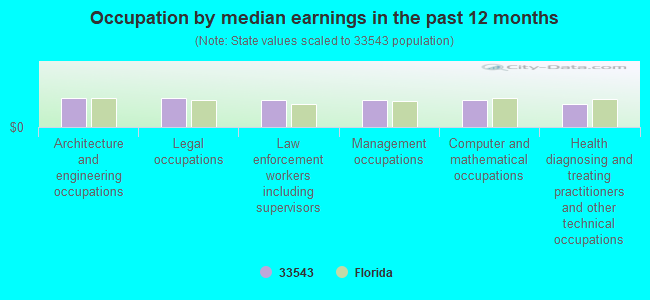
Occupation by median earnings in the past 12 months ($)
107,437Architecture and engineering occupations
105,379Legal occupations
100,212Law enforcement workers including supervisors
99,265Management occupations
98,288Computer and mathematical occupations
82,750Health diagnosing and treating practitioners and other technical occupations
Companies with federal contracts located in this zip code:
REMSON, SIEGFRED JR (27737 PINE POINT DR in ZEPHYRHILLS, FL; small business)
$5,980 with Army for Other Housekeeping Services. Taking place in TX. Signed on 2006-02-10. Completion date: 2006-04-01.
Top industries in this zip code by the number of employees in 2005:
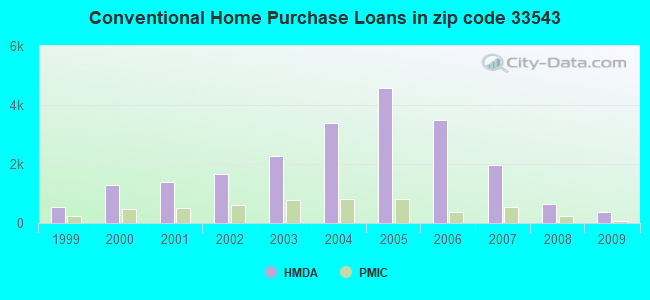
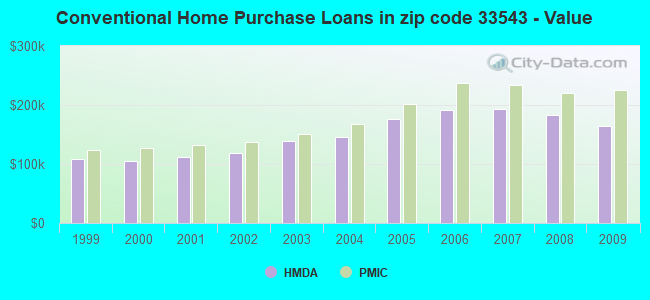
Detailed PMIC statistics for the following Tracts:0321.01
2002 - 2018 National Fire Incident Reporting System (NFIRS) incidents
Based on the data from the years 2002 - 2018 the average number of fire incidents per year is 45. The highest number of fires - 67 took place in 2006, and the least - 27 in 2002. The data has a growing trend.
When looking into fire subcategories, the most incidents belonged to: Outside Fires (40.6%), and Structure Fires (31.8%).
Fire incident types reported to NFIRS in Zip Code 33543


 Nearest zip codes: 33545, 33541, 33544, 33647, 33592, 33542.
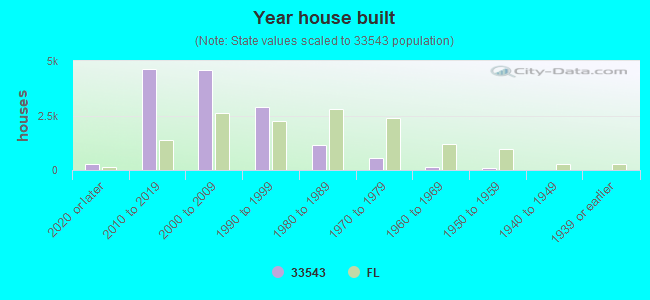


 Based on the data from the years 2002 - 2018 the average number of fire incidents per year is 45. The highest number of fires - 67 took place in 2006, and the least - 27 in 2002. The data has a growing trend.
 When looking into fire subcategories, the most incidents belonged to: Outside Fires (40.6%), and Structure Fires (31.8%).