Estimated zip code population in 2022: 16,092 Zip code population in 2010: 14,263 Zip code population in 2000: 13,639
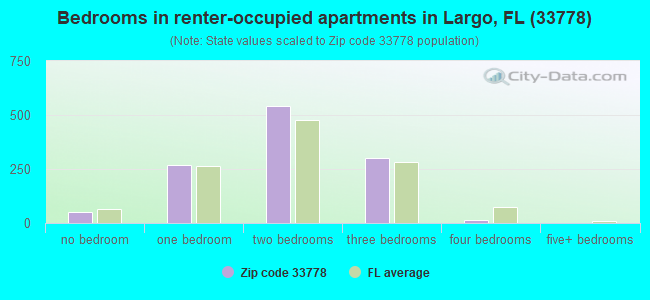
Houses and condos: 8,297 Renter-occupied apartments: 1,176
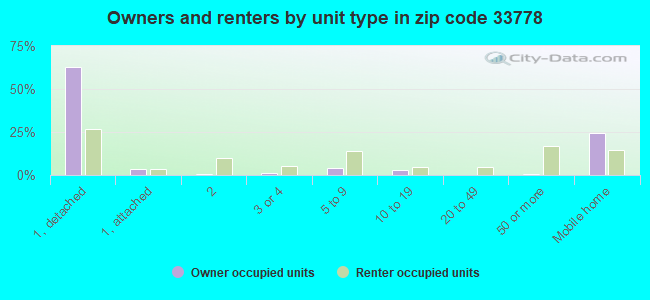
% of renters here:
17%
State:
33%
March 2022 cost of living index in zip code 33778: 98.6 (near average, U.S. average is 100)
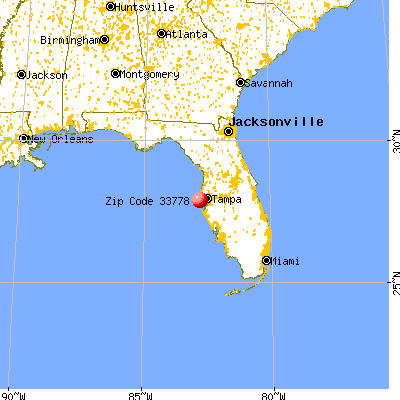
Land area: 3.7 sq. mi. Water area: 0.2 sq. mi.
Population density: 4,311 people per square mile
(average).
OSM Map
General Map
Google Map
MSN Map
OSM Map
General Map
Google Map
MSN Map
OSM Map
General Map
Google Map
MSN Map
OSM Map
General Map
Google Map
MSN Map
Please wait while loading the map...
Real estate property taxes paid for housing units in 2022:
This zip code:
0.6% ($1,654)
Florida:
0.7% ($2,529)
Median real estate property taxes paid for housing units with mortgages in 2022: $2,055 (0.6%) Median real estate property taxes paid for housing units with no mortgage in 2022: $1,020 (0.7%)
Averages for the 2020 tax year for zip code 33778, filed in 2021:
Average Adjusted Gross Income (AGI) in 2020: $55,622 (Individual Income Tax Returns)
Here:
$55,622
State:
$82,200
Salary/wage: $49,529 (reported on 77.4% of returns)
Here:
$49,529
State:
$58,347
(% of AGI for various income ranges: 1125.3% for AGIs below $25k, 3437.1% for AGIs $25k-50k, 6310.1% for AGIs $50k-75k, 8666.2% for AGIs $75k-100k, 15542.4% for AGIs $100k-200k, 66606.7% for AGIs over 200k)
Taxable interest for individuals: $1,402 (reported on 25.3% of returns)
This zip code:
$1,402
Florida:
$4,272
(% of AGI for various income ranges: 19.5% for AGIs below $25k, 18.5% for AGIs $25k-50k, 45.1% for AGIs $50k-75k, 60.4% for AGIs $75k-100k, 173.2% for AGIs $100k-200k, 761.7% for AGIs over 200k)
Ordinary dividends: $4,510 (reported on 18.4% of returns)
Here:
$4,510
State:
$15,863
(% of AGI for various income ranges: 31.4% for AGIs below $25k, 40.7% for AGIs $25k-50k, 107.6% for AGIs $50k-75k, 178.3% for AGIs $75k-100k, 279.8% for AGIs $100k-200k, 3061.7% for AGIs over 200k)
Net capital gain/loss in AGI: +$10,984 (reported on 14.8% of returns)
Here:
+$10,984
State:
+$62,983
(% of AGI for various income ranges: 10.2% for AGIs below $25k, 30.4% for AGIs $25k-50k, 91.2% for AGIs $50k-75k, 144.0% for AGIs $75k-100k, 493.8% for AGIs $100k-200k, 12561.7% for AGIs over 200k)
Profit/loss from business: +$8,810 (reported on 14.3% of returns)
Here:
+$8,810
State:
+$9,719
(% of AGI for various income ranges: 95.4% for AGIs below $25k, 68.3% for AGIs $25k-50k, 117.6% for AGIs $50k-75k, 194.9% for AGIs $75k-100k, 409.2% for AGIs $100k-200k, 4183.3% for AGIs over 200k)
Taxable individual retirement arrangement distribution: $16,853 (reported on 10.5% of returns)
33778:
$16,853
Florida:
$24,823
(% of AGI for various income ranges: 82.4% for AGIs below $25k, 113.3% for AGIs $25k-50k, 244.4% for AGIs $50k-75k, 503.8% for AGIs $75k-100k, 753.6% for AGIs $100k-200k, 2801.7% for AGIs over 200k)
Total itemized deductions: $32,039 (reported on 4.2% of returns)
Here:
$32,039
State:
$45,393
(% of AGI for various income ranges: 78.7% for AGIs $25k-50k, 218.2% for AGIs $50k-75k, 273.4% for AGIs $75k-100k, 517.6% for AGIs $100k-200k, 5150.0% for AGIs over 200k)
Charity contributions: $9,971 (reported on 3.2% of returns)
Here:
$9,971
State:
$20,178
(% of AGI for various income ranges: 7.3% for AGIs $25k-50k, 44.9% for AGIs $50k-75k, 45.1% for AGIs $75k-100k, 117.8% for AGIs $100k-200k, 1875.0% for AGIs over 200k)
Taxes paid: $5,594 (reported on 4.2% of returns)
33778:
$5,594
State:
$6,967
(% of AGI for various income ranges: 7.3% for AGIs $25k-50k, 39.7% for AGIs $50k-75k, 54.5% for AGIs $75k-100k, 93.8% for AGIs $100k-200k, 968.3% for AGIs over 200k)
Earned income credit: $2,086 (reported on 16.7% of returns)
Here:
$2,086
State:
$2,306
(% of AGI for various income ranges: 89.2% for AGIs below $25k, 53.2% for AGIs $25k-50k)
Percentage of individuals using paid preparers for their 2020 taxes: 91.3%
Here:
91%
State:
92%
(% for various income ranges: 90.2% for AGIs below $25k, 91.5% for AGIs $25k-50k, 90.8% for AGIs $50k-75k, 92.6% for AGIs $75k-100k, 92.6% for AGIs $100k-200k, 95.0% for AGIs over 200k)
Averages for the 2012 tax year for zip code 33778, filed in 2013:
Average Adjusted Gross Income (AGI) in 2012: $43,675 (Individual Income Tax Returns)
Here:
$43,675
State:
$60,316
Salary/wage: $39,138 (reported on 78.7% of returns)
Here:
$39,138
State:
$45,277
(% of AGI for various income ranges: 67.4% for AGIs below $25k, 77.0% for AGIs $25k-50k, 74.2% for AGIs $50k-75k, 72.9% for AGIs $75k-100k, 71.3% for AGIs $100k-200k, 52.9% for AGIs over 200k)
Taxable interest for individuals: $1,373 (reported on 30.5% of returns)
This zip code:
$1,373
Florida:
$3,587
(% of AGI for various income ranges: 1.6% for AGIs below $25k, 0.8% for AGIs $25k-50k, 0.9% for AGIs $50k-75k, 0.8% for AGIs $75k-100k, 1.0% for AGIs $100k-200k, 0.9% for AGIs over 200k)
Ordinary dividends: $3,895 (reported on 18.4% of returns)
Here:
$3,895
State:
$12,831
(% of AGI for various income ranges: 2.7% for AGIs below $25k, 1.4% for AGIs $25k-50k, 1.4% for AGIs $50k-75k, 1.4% for AGIs $75k-100k, 1.9% for AGIs $100k-200k, 1.3% for AGIs over 200k)
Net capital gain/loss in AGI: +$5,154 (reported on 13.7% of returns)
Here:
+$5,154
State:
+$33,493
(% of AGI for various income ranges: 0.2% for AGIs $25k-50k, 0.7% for AGIs $50k-75k, 0.5% for AGIs $75k-100k, 2.2% for AGIs $100k-200k, 7.8% for AGIs over 200k)
Profit/loss from business: +$8,388 (reported on 13.0% of returns)
Here:
+$8,388
State:
+$10,012
(% of AGI for various income ranges: 6.6% for AGIs below $25k, 1.5% for AGIs $25k-50k, 1.8% for AGIs $50k-75k, 0.6% for AGIs $75k-100k, 1.8% for AGIs $100k-200k, 4.3% for AGIs over 200k)
Taxable individual retirement arrangement distribution: $13,323 (reported on 12.4% of returns)
33778:
$13,323
Florida:
$21,544
(% of AGI for various income ranges: 4.2% for AGIs below $25k, 3.2% for AGIs $25k-50k, 3.2% for AGIs $50k-75k, 3.7% for AGIs $75k-100k, 5.0% for AGIs $100k-200k, 3.6% for AGIs over 200k)
Total itemized deductions: $18,389 (21% of AGI, reported on 19.2% of returns)
Here:
$18,389
State:
$25,533
Here:
20.9% of AGI
State:
18.0% of AGI
(% of AGI for various income ranges: 5.6% for AGIs below $25k, 7.0% for AGIs $25k-50k, 8.1% for AGIs $50k-75k, 7.8% for AGIs $75k-100k, 9.3% for AGIs $100k-200k, 10.9% for AGIs over 200k)
Charity contributions: $3,886 (reported on 15.2% of returns)
Here:
$3,886
State:
$5,698
(% of AGI for various income ranges: 0.4% for AGIs below $25k, 0.9% for AGIs $25k-50k, 1.1% for AGIs $50k-75k, 1.1% for AGIs $75k-100k, 1.8% for AGIs $100k-200k, 3.0% for AGIs over 200k)
Taxes paid: $3,663 (reported on 18.7% of returns)
33778:
$3,663
State:
$6,203
(% of AGI for various income ranges: 1.0% for AGIs below $25k, 1.1% for AGIs $25k-50k, 1.4% for AGIs $50k-75k, 1.4% for AGIs $75k-100k, 2.1% for AGIs $100k-200k, 2.5% for AGIs over 200k)
Earned income credit: $2,055 (reported on 18.9% of returns)
Here:
$2,055
State:
$2,372
(% of AGI for various income ranges: 5.5% for AGIs below $25k, 0.8% for AGIs $25k-50k)
Percentage of individuals using paid preparers for their 2012 taxes: 42.8%
Here:
43%
State:
54%
(% for various income ranges: 40.4% for AGIs below $25k, 38.8% for AGIs $25k-50k, 48.9% for AGIs $50k-75k, 46.8% for AGIs $75k-100k, 51.2% for AGIs $100k-200k, 70.0% for AGIs over 200k)
Averages for the 2004 tax year for zip code 33778, filed in 2005:
Average Adjusted Gross Income (AGI) in 2004: $37,051 (Individual Income Tax Returns)
Here:
$37,051
State:
$50,523
Salary/wage: $34,806 (reported on 80.4% of returns)
Here:
$34,806
State:
$39,563
(% of AGI for various income ranges: 90.2% for AGIs below $10k, 70.6% for AGIs $10k-25k, 78.7% for AGIs $25k-50k, 78.0% for AGIs $50k-75k, 80.8% for AGIs $75k-100k, 67.9% for AGIs over 100k)
Taxable interest for individuals: $1,686 (reported on 44.4% of returns)
This zip code:
$1,686
Florida:
$3,211
(% of AGI for various income ranges: 6.6% for AGIs below $10k, 3.4% for AGIs $10k-25k, 1.8% for AGIs $25k-50k, 1.4% for AGIs $50k-75k, 1.7% for AGIs $75k-100k, 1.9% for AGIs over 100k)
Taxable dividends: $2,037 (reported on 22.6% of returns)
Here:
$2,037
State:
$6,129
(% of AGI for various income ranges: 4.9% for AGIs below $10k, 1.8% for AGIs $10k-25k, 0.9% for AGIs $25k-50k, 1.3% for AGIs $50k-75k, 1.0% for AGIs $75k-100k, 1.0% for AGIs over 100k)
Net capital gain/loss: +$4,505 (reported on 17.9% of returns)
Here:
+$4,505
State:
+$27,205
(% of AGI for various income ranges: -2.9% for AGIs below $10k, 0.2% for AGIs $10k-25k, 0.4% for AGIs $25k-50k, 1.3% for AGIs $50k-75k, 1.3% for AGIs $75k-100k, 7.2% for AGIs over 100k)
Profit/loss from business: +$8,046 (reported on 11.2% of returns)
Here:
+$8,046
State:
+$10,634
(% of AGI for various income ranges: 8.6% for AGIs below $10k, 3.3% for AGIs $10k-25k, 1.8% for AGIs $25k-50k, 2.2% for AGIs $50k-75k, 2.3% for AGIs $75k-100k, 2.4% for AGIs over 100k)
IRA payment deduction: $2,821 (reported on 2.9% of returns)
33778:
$2,821
Florida:
$3,082
(% of AGI for various income ranges: 0.6% for AGIs below $10k, 0.2% for AGIs $10k-25k, 0.2% for AGIs $25k-50k, 0.3% for AGIs $50k-75k, 0.3% for AGIs $75k-100k, 0.2% for AGIs over 100k)
Self-employed pension: $5,615 (reported on 0.2% of returns)
Here:
$5,615
Florida:
$15,857
Total itemized deductions: $15,157 (24% of AGI, reported on 25.4% of returns)
Here:
$15,157
State:
$20,370
Here:
23.5% of AGI
State:
20.7% of AGI
(% of AGI for various income ranges: 13.6% for AGIs below $10k, 8.1% for AGIs $10k-25k, 9.9% for AGIs $25k-50k, 11.4% for AGIs $50k-75k, 12.4% for AGIs $75k-100k, 9.9% for AGIs over 100k)
Charity contributions deductions: $2,895 (4% of AGI, reported on 20.8% of returns)
Here:
$2,895
State:
$4,064
Here:
4.2% of AGI
State:
3.8% of AGI
(% of AGI for various income ranges: 0.7% for AGIs below $10k, 0.8% for AGIs $10k-25k, 1.1% for AGIs $25k-50k, 1.7% for AGIs $50k-75k, 1.8% for AGIs $75k-100k, 2.6% for AGIs over 100k)
Total tax: $5,020 (reported on 74.2% of returns)
33778:
$5,020
State:
$9,431
(% of AGI for various income ranges: 2.3% for AGIs below $10k, 3.9% for AGIs $10k-25k, 7.1% for AGIs $25k-50k, 9.0% for AGIs $50k-75k, 11.2% for AGIs $75k-100k, 18.2% for AGIs over 100k)
Earned income credit: $1,651 (reported on 15.6% of returns)
Here:
$1,651
State:
$1,808
Percentage of individuals using paid preparers for their 2004 taxes: 55.3%
Here:
55%
State:
60%
(% for various income ranges: 51.3% for AGIs below $10k, 57.0% for AGIs $10k-25k, 53.9% for AGIs $25k-50k, 57.8% for AGIs $50k-75k, 54.3% for AGIs $75k-100k, 63.4% for AGIs over 100k)
Likely homosexual households (counted as self-reported same-sex unmarried-partner households)
Lesbian couples: 0.0% of all households
Gay men: 0.3% of all households
Household received Food Stamps/SNAP in the past 12 months: 605 Household did not receive Food Stamps/SNAP in the past 12 months: 6,194
Women who had a birth in the past 12 months: 316 (102 now married, 200 unmarried) Women who did not have a birth in the past 12 months: 2,638 (1,260 now married, 1,378 unmarried)
Housing units in zip code 33778 with a mortgage: 2,894 (378 second mortgage, 12 home equity loan, 333 both second mortgage and home equity loan) Houses without a mortgage: 15
Median monthly owner costs for units with a mortgage: $1,678 Median monthly owner costs for units without a mortgage: $530
Residents with income below the poverty level in 2022:
This zip code:
11.1%
Whole state:
12.7%
Residents with income below 50% of the poverty level in 2022:
This zip code:
5.5%
Whole state:
6.6%
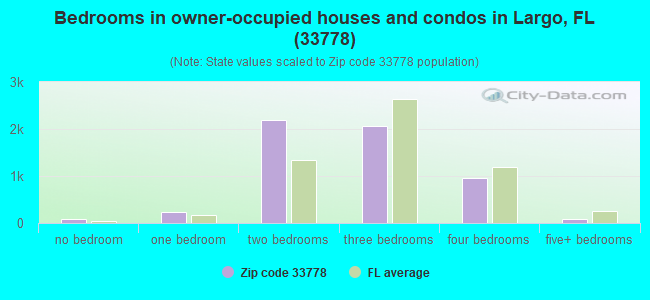
Median number of rooms in houses and condos:
Here:
5.5
State:
5.9
Median number of rooms in apartments:
Here:
4.2
State:
4.2
Notable locations in this zip code not listed on our city pages
Notable locations in zip code 33778: Largo Square (A), Oakhurst Plaza (B), Pinellas County Emergency Medical Services Authority Sunstar Emergency Medical Services (C), Seminole Fire Rescue Station 32 (D), Pinellas County Sheriff's Office (E). Display/hide their locations on the map
Churches in zip code 33778 include: Shiloh Missionary Baptist Church (A), Good Shepherd Church (B), Largo Church of the Nazarene (C), Free Methodist Church (D), Lutheran Church of the Good Shepherd (E), Seminole Christian Church Disciples of Christ (F), Calvary Church (G). Display/hide their locations on the map
In group quarters: 132 (-1 institutionalized population)
Size of family households: 2,154 2-persons, 838 3-persons, 491 4-persons, 113 5-persons, 227 6-persons, 96 7-or-more-persons
Size of nonfamily households: 2,366 1-person, 502 2-persons, 6 3-persons
1,314 married couples with children.
552 single-parent households (98 men, 454 women).
84.2% of residents of 33778 zip code speak English at home.
10.2% of residents speak Spanish at home (44% very well, 16% well, 39% not well, 1% not at all).
2.1% of residents speak other Indo-European language at home (79% very well, 11% well, 9% not well).
2.8% of residents speak Asian or Pacific Island language at home (80% very well, 16% well, 5% not well).
0.7% of residents speak other language at home (27% very well, 73% well).
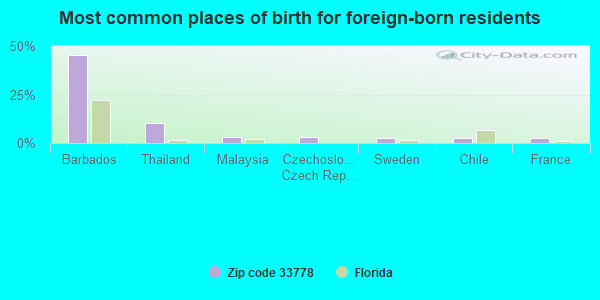
Foreign born population: 1,983 (12.3%) (64.4% of them are naturalized citizens)
This zip code:
12.3%
Whole state:
21.7%
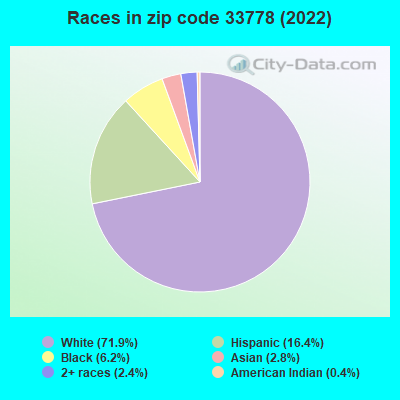
45%Barbados
10%Thailand
3%Malaysia
3%Czechoslovakia (includes Czech Republic and Slovakia)
3%Sweden
2%Chile
2%France
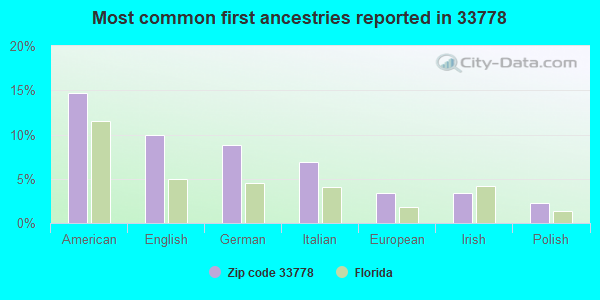
15%American
10%English
9%German
7%Italian
3%European
3%Irish
2%Polish
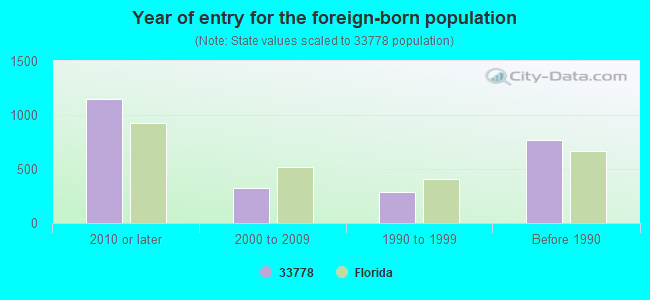
Year of entry for the foreign-born population
1,1492010 or later
3222000 to 2009
2831990 to 1999
764Before 1990
Major facilities with environmental interests located in this zip code:
ALLIED TIRES AND SERVICE #2546 (13399 SEMINOLE BLVD in LARGO, FL)
STATE MASTER (FDM) - CHAZ-FLD981857188, HAZARDOUS WASTE REGULATION PROGRAM Small Quantity Generators, between 100 kg and 1000 kg of hazardous waste/month (Resource Conservation and Recovery Act (tracking hazardous waste)) - notification Business SIC classification: AUTO AND HOME SUPPLY STORES Organizations: BRUCE WHITNEY, MANAGER (CONTACT/OWNER)
, GOODYEAR TIRE AND RUBBER CO (CONTACT/OWNER)
Alternative names: ALLIED TIRE SALES INC
LOWE'S OF LARGO (111010 ULMERTON ROAD in LARGO, FL)
National Pollutant Discharge Elimination System NON-MAJOR (Tracking pollutant discharge elimination systems) - permit National Pollutant Discharge Elimination System NON-MAJOR (Tracking pollutant discharge elimination systems) - permit Organizations: HOWARD BAYLESS (CONTACT/OWNER)
, RICHARD GOODMAN (CONTACT/OWNER)
RIDGECREST ELEMENTARY SCHOOL (1901 119TH STREET NORTH in LARGO, FL)
(National Center for Education Statistics) - STATE ID-3511 Organizations: PINELLAS COUNTY SCHOOL DISTRICT (SCHOOL DISTRICT)
OLYMPIAN CLEANERS (11926 SEMINOLE BLVD in LARGO, FL)
AIR MINOR (AIRS/AFS) (Resource Conservation and Recovery Act (tracking hazardous waste)) Business SIC classification: DRYCLEANING PLANTS, EXCEPT RUG CLEANING Organizations: GARY RAMPINO (CONTACT/OWNER)
AMERADA HESS STATION #09356 (11708 SEMINOLE BLVD in LARGO, FL)
(Resource Conservation and Recovery Act (tracking hazardous waste)) Organizations: THOMAS WHITAKER, ENV COORD (CONTACT/OWNER)
GRIZZLE BUILDING (11351 ULMERTON RD in LARGO, FL)
(Resource Conservation and Recovery Act (tracking hazardous waste)) Organizations: STATE OF FLORIDA (CONTACT/OWNER)
LIGHTING & SIGNS (1263 20TH AVE SW in LARGO, FL)
(Resource Conservation and Recovery Act (tracking hazardous waste)) Organizations: GARY WEBB, OWNER (CONTACT/OWNER)
LOGAN LABORATORIES (1620 RIDGE RD S in LARGO, FL)
National Pollutant Discharge Elimination System NON-MAJOR (Tracking pollutant discharge elimination systems) - permit Organizations: PICK TALLEY (CONTACT/OWNER)
PINELLAS CENTRAL ACE HARDWARE (12344 SEMINOLE BLVD in LARGO, FL)
National Pollutant Discharge Elimination System NON-MAJOR (Tracking pollutant discharge elimination systems) - permit Organizations: GERALD CULP (CONTACT/OWNER)
CSX TRANSPORTATION (11690 WALSINGHAM RD in LARGO, FL)
(Resource Conservation and Recovery Act (tracking hazardous waste))
BODY LINES INC (10949 SEMINOLE BLVD in LARGO, FL)
(Resource Conservation and Recovery Act (tracking hazardous waste)) Organizations: BILL NOLAN (CONTACT/OWNER)
SEMINOLE KASH N KARRY (SEMINOLE BLVD. & 102ND AVE., N in SEMINOLE, FL)
National Pollutant Discharge Elimination System NON-MAJOR (Tracking pollutant discharge elimination systems) - permit Organizations: MATT WILLIAMS (CONTACT/OWNER)
RESOURCE ONE (11625 WALSINGHAM RD. in LARGO, FL)
Small Quantity Generators, between 100 kg and 1000 kg of hazardous waste/month (Resource Conservation and Recovery Act (tracking hazardous waste)) - notification TRI REPORTER (Tracking of toxic chemicals releasing facilities) Business SIC classification: SPECIALTY CLEANING, POLISHING, AND SANITATION PREPARATIONS Organizations: DONALD ALLI (CONTACT/OWNER)
Alternative names: DORA SUPPLY CO INC
Housing units lacking complete plumbing facilities: 0.3% Housing units lacking complete kitchen facilities: 1.3%
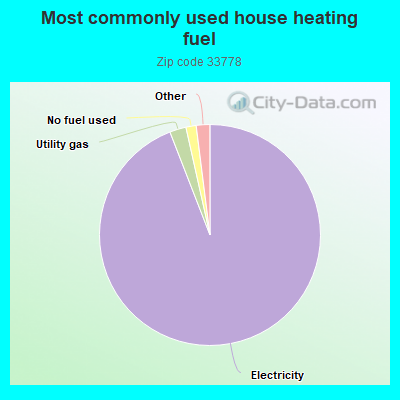
94.2%Electricity
2.4%Utility gas
1.5%No fuel used
0.6%Fuel oil, kerosene, etc.
0.6%Solar energy
Place of birth for U.S.-born residents:
This state: 5,026
Northeast: 3,592
Midwest: 2,964
South: 1,615
West: 407
58% of the 33778 zip code residents lived in the same house 5 years ago. Out of people who lived in different houses, 63% lived in this county. Out of people who lived in different counties, 50% lived in Florida.
85% of the 33778 zip code residents lived in the same house 1 year ago. Out of people who lived in different houses, 68% moved from this county. Out of people who lived in different houses, 2% moved from different county within same state. Out of people who lived in different houses, 12% moved from different state. Out of people who lived in different houses, 11% moved from abroad.
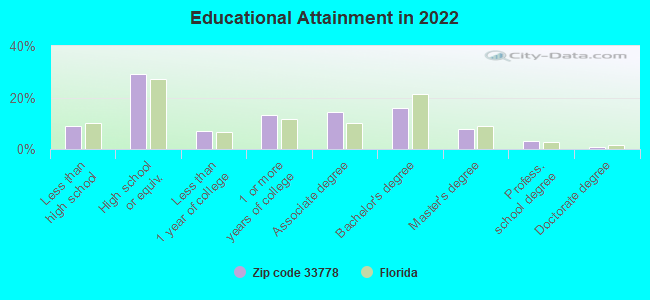
Private vs. public school enrollment:
Students in private schools in grades 1 to 8 (elementary and middle school): 291
Here:
30.4%
Florida:
15.8%
Students in private schools in grades 9 to 12 (high school): 40
Here:
5.7%
Florida:
12.9%
Students in private undergraduate colleges: 171
Here:
19.8%
Florida:
23.6%
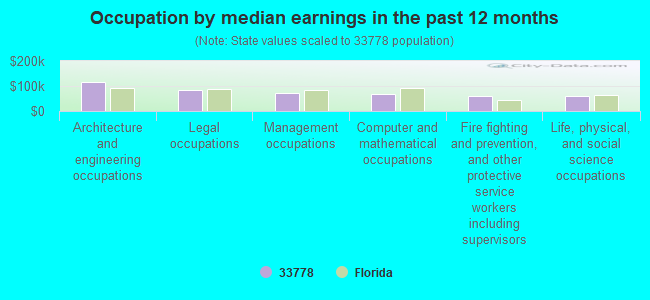
Occupation by median earnings in the past 12 months ($)
117,122Architecture and engineering occupations
84,414Legal occupations
71,367Management occupations
67,227Computer and mathematical occupations
58,910Fire fighting and prevention, and other protective service workers including supervisors
58,555Life, physical, and social science occupations
Companies with federal contracts located in this zip code:
BURDIN LIFT, CO. (11189 110TH WAY N. in LARGO, FL; small business) : $694,506 in 8 contractsfrom 1999 to 2000
Contracts for Guard Services, Miscellaneous Service and Trade Equipment by Navy, U.S. Army Corps of Engineers - civil program financing only Signed by year:2000: $216,341; 2001: $0; 2002: $0; 2003: $0; 2004: $0; 2005: $0; 2006: $0.
Biggest contracts:
$224,416 with Navy for Guard Services. Taking place in VA. Signed on 1999-12-02. Completion date: 2000-09-30.
$224,416, same as above.Signed on 1999-12-02. Completion date: 2000-09-30.
$128,341, same as above.Signed on 2000-09-22. Completion date: 2001-09-30.
$88,000 with U.S. Army Corps of Engineers - civil program financing only for Miscellaneous Service and Trade Equipment. Taking place in LA. Signed on 2000-01-31. Completion date: 2000-05-24.
CLEARWATER MATTRESS COMPANY INCORPORATED (1185 BASKINS CROSSING RD in LARGO, FL; small business) 101 employees, $15000000 revenue.
$160 with Department of Veterans Affairs for Hospital Furniture, Equipment, Utensils, and Supplies. Signed on 2005-08-08. Completion date: 2005-08-11.
Top industries in this zip code by the number of employees in 2005:
2002 - 2018 National Fire Incident Reporting System (NFIRS) incidents
According to the data from the years 2002 - 2018 the average number of fires per year is 24. The highest number of reported fire incidents - 54 took place in 2010, and the least - 0 in 2003. The data has a rising trend.
When looking into fire subcategories, the most reports belonged to: Structure Fires (58.5%), and Outside Fires (25.4%).
Fire incident types reported to NFIRS in Zip Code 33778


 Nearest zip codes: 33770, 33774, 33773, 33772, 33771, 33776.


 According to the data from the years 2002 - 2018 the average number of fires per year is 24. The highest number of reported fire incidents - 54 took place in 2010, and the least - 0 in 2003. The data has a rising trend.
 When looking into fire subcategories, the most reports belonged to: Structure Fires (58.5%), and Outside Fires (25.4%).