Estimated zip code population in 2022: 26,539 Zip code population in 2010: 25,281 Zip code population in 2000: 24,394
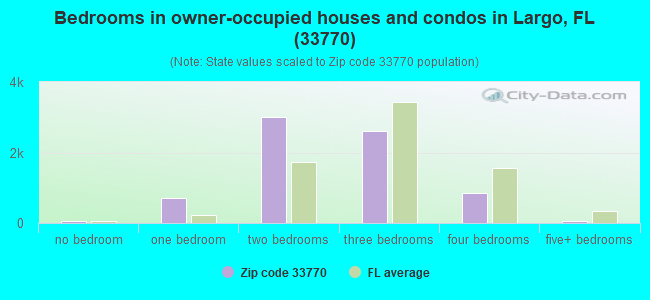
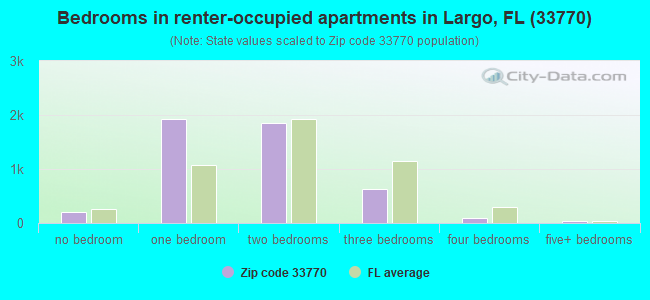
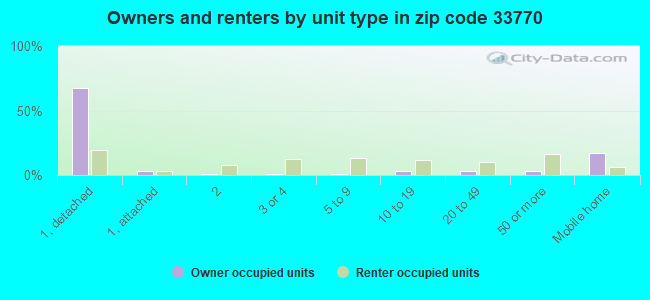
Houses and condos: 13,950 Renter-occupied apartments: 4,714
% of renters here:
39%
State:
33%
March 2022 cost of living index in zip code 33770: 98.4 (near average, U.S. average is 100)
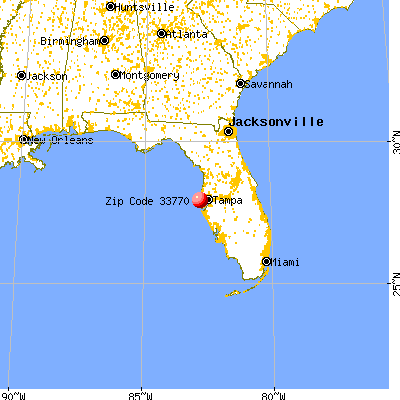
Land area: 5.2 sq. mi. Water area: 0.5 sq. mi.
Population density: 5,120 people per square mile
(average).
OSM Map
General Map
Google Map
MSN Map
OSM Map
General Map
Google Map
MSN Map
OSM Map
General Map
Google Map
MSN Map
OSM Map
General Map
Google Map
MSN Map
Please wait while loading the map...
Real estate property taxes paid for housing units in 2022:
This zip code:
0.7% ($1,864)
Florida:
0.7% ($2,529)
Median real estate property taxes paid for housing units with mortgages in 2022: $2,003 (0.7%) Median real estate property taxes paid for housing units with no mortgage in 2022: $1,591 (0.8%)
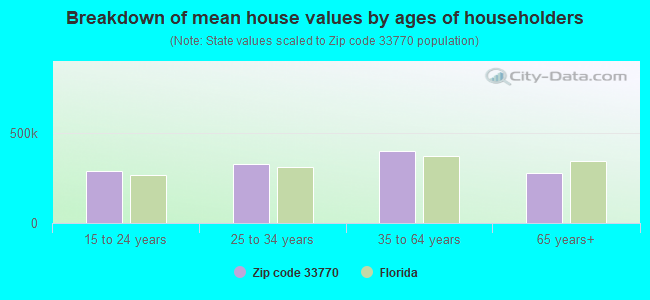
Estimated median house/condo value in 2022: $268,665
33770:
$268,665
Florida:
$354,100
According to our research of Florida and other state lists, there were 40 registered sex offenders living in 33770 zip code as of April 27, 2024. The ratio of all residents to sex offenders in zip code 33770 is 651 to 1. The ratio of registered sex offenders to all residents in this zip code is near the state average.
Median resident age:
This zip code:
49.1 years
Florida median age:
42.7 years
Average household size:
This zip code:
2.2 people
Florida:
2.5 people
Averages for the 2020 tax year for zip code 33770, filed in 2021:
Average Adjusted Gross Income (AGI) in 2020: $64,931 (Individual Income Tax Returns)
Here:
$64,931
State:
$82,200
Salary/wage: $50,886 (reported on 77.3% of returns)
Here:
$50,886
State:
$58,347
(% of AGI for various income ranges: 1232.8% for AGIs below $25k, 3633.2% for AGIs $25k-50k, 6410.1% for AGIs $50k-75k, 9239.5% for AGIs $75k-100k, 16464.8% for AGIs $100k-200k, 99706.7% for AGIs over 200k)
Taxable interest for individuals: $3,384 (reported on 25.1% of returns)
This zip code:
$3,384
Florida:
$4,272
(% of AGI for various income ranges: 21.6% for AGIs below $25k, 21.9% for AGIs $25k-50k, 71.3% for AGIs $50k-75k, 155.2% for AGIs $75k-100k, 259.2% for AGIs $100k-200k, 5060.8% for AGIs over 200k)
Ordinary dividends: $9,591 (reported on 19.2% of returns)
Here:
$9,591
State:
$15,863
(% of AGI for various income ranges: 35.5% for AGIs below $25k, 57.7% for AGIs $25k-50k, 149.1% for AGIs $50k-75k, 303.5% for AGIs $75k-100k, 695.0% for AGIs $100k-200k, 10635.8% for AGIs over 200k)
Net capital gain/loss in AGI: +$32,544 (reported on 17.8% of returns)
Here:
+$32,544
State:
+$62,983
(% of AGI for various income ranges: 15.7% for AGIs below $25k, 41.5% for AGIs $25k-50k, 142.5% for AGIs $50k-75k, 255.0% for AGIs $75k-100k, 1105.6% for AGIs $100k-200k, 51990.8% for AGIs over 200k)
Profit/loss from business: +$10,876 (reported on 15.3% of returns)
Here:
+$10,876
State:
+$9,719
(% of AGI for various income ranges: 111.7% for AGIs below $25k, 130.0% for AGIs $25k-50k, 155.0% for AGIs $50k-75k, 318.7% for AGIs $75k-100k, 539.4% for AGIs $100k-200k, 5484.2% for AGIs over 200k)
Taxable individual retirement arrangement distribution: $18,951 (reported on 10.6% of returns)
33770:
$18,951
Florida:
$24,823
(% of AGI for various income ranges: 70.4% for AGIs below $25k, 101.9% for AGIs $25k-50k, 326.7% for AGIs $50k-75k, 558.4% for AGIs $75k-100k, 1173.4% for AGIs $100k-200k, 4562.5% for AGIs over 200k)
Self-employed (Keogh) retirement plans: $18,150 (reported on 0.3% of returns)
33770:
$18,150
Florida:
$29,694
(% of AGI for various income ranges: 113.4% for AGIs $100k-200k)
Total itemized deductions: $43,060 (reported on 5.3% of returns)
Here:
$43,060
State:
$45,393
(% of AGI for various income ranges: 48.0% for AGIs below $25k, 99.2% for AGIs $25k-50k, 249.0% for AGIs $50k-75k, 434.4% for AGIs $75k-100k, 912.3% for AGIs $100k-200k, 11010.8% for AGIs over 200k)
Charity contributions: $19,581 (reported on 4.0% of returns)
Here:
$19,581
State:
$20,178
(% of AGI for various income ranges: 2.6% for AGIs below $25k, 14.7% for AGIs $25k-50k, 24.0% for AGIs $50k-75k, 96.6% for AGIs $75k-100k, 236.6% for AGIs $100k-200k, 6054.2% for AGIs over 200k)
Taxes paid: $6,008 (reported on 5.1% of returns)
33770:
$6,008
State:
$6,967
(% of AGI for various income ranges: 5.8% for AGIs below $25k, 11.4% for AGIs $25k-50k, 33.5% for AGIs $50k-75k, 79.7% for AGIs $75k-100k, 159.1% for AGIs $100k-200k, 1264.2% for AGIs over 200k)
Earned income credit: $1,975 (reported on 16.3% of returns)
Here:
$1,975
State:
$2,306
(% of AGI for various income ranges: 82.5% for AGIs below $25k, 47.5% for AGIs $25k-50k)
Percentage of individuals using paid preparers for their 2020 taxes: 91.2%
Here:
91%
State:
92%
(% for various income ranges: 89.7% for AGIs below $25k, 91.6% for AGIs $25k-50k, 92.8% for AGIs $50k-75k, 90.9% for AGIs $75k-100k, 92.0% for AGIs $100k-200k, 93.5% for AGIs over 200k)
Averages for the 2012 tax year for zip code 33770, filed in 2013:
Average Adjusted Gross Income (AGI) in 2012: $48,447 (Individual Income Tax Returns)
Here:
$48,447
State:
$60,316
Salary/wage: $40,032 (reported on 77.7% of returns)
Here:
$40,032
State:
$45,277
(% of AGI for various income ranges: 71.5% for AGIs below $25k, 76.1% for AGIs $25k-50k, 70.1% for AGIs $50k-75k, 66.9% for AGIs $75k-100k, 64.5% for AGIs $100k-200k, 45.0% for AGIs over 200k)
Taxable interest for individuals: $3,019 (reported on 30.2% of returns)
This zip code:
$3,019
Florida:
$3,587
(% of AGI for various income ranges: 1.9% for AGIs below $25k, 1.2% for AGIs $25k-50k, 1.3% for AGIs $50k-75k, 1.9% for AGIs $75k-100k, 2.2% for AGIs $100k-200k, 2.6% for AGIs over 200k)
Ordinary dividends: $8,218 (reported on 20.3% of returns)
Here:
$8,218
State:
$12,831
(% of AGI for various income ranges: 2.8% for AGIs below $25k, 2.3% for AGIs $25k-50k, 2.2% for AGIs $50k-75k, 2.2% for AGIs $75k-100k, 4.4% for AGIs $100k-200k, 5.5% for AGIs over 200k)
Net capital gain/loss in AGI: +$7,071 (reported on 16.6% of returns)
Here:
+$7,071
State:
+$33,493
(% of AGI for various income ranges: 0.3% for AGIs $25k-50k, 0.7% for AGIs $50k-75k, 1.2% for AGIs $75k-100k, 3.0% for AGIs $100k-200k, 6.9% for AGIs over 200k)
Profit/loss from business: +$11,014 (reported on 13.1% of returns)
Here:
+$11,014
State:
+$10,012
(% of AGI for various income ranges: 7.0% for AGIs below $25k, 2.1% for AGIs $25k-50k, 2.3% for AGIs $50k-75k, 1.5% for AGIs $75k-100k, 2.4% for AGIs $100k-200k, 3.3% for AGIs over 200k)
Taxable individual retirement arrangement distribution: $14,517 (reported on 12.3% of returns)
33770:
$14,517
Florida:
$21,544
(% of AGI for various income ranges: 3.6% for AGIs below $25k, 2.8% for AGIs $25k-50k, 3.4% for AGIs $50k-75k, 5.8% for AGIs $75k-100k, 5.0% for AGIs $100k-200k, 2.7% for AGIs over 200k)
Self-employment retirement plans: $18,400 (reported on 0.3% of returns)
33770:
$18,400
Florida:
$20,611
Total itemized deductions: $23,390 (21% of AGI, reported on 20.2% of returns)
Here:
$23,390
State:
$25,533
Here:
20.9% of AGI
State:
18.0% of AGI
(% of AGI for various income ranges: 8.7% for AGIs below $25k, 8.3% for AGIs $25k-50k, 9.8% for AGIs $50k-75k, 10.1% for AGIs $75k-100k, 11.8% for AGIs $100k-200k, 9.8% for AGIs over 200k)
Charity contributions: $5,363 (reported on 15.4% of returns)
Here:
$5,363
State:
$5,698
(% of AGI for various income ranges: 0.6% for AGIs below $25k, 0.8% for AGIs $25k-50k, 1.2% for AGIs $50k-75k, 1.3% for AGIs $75k-100k, 2.0% for AGIs $100k-200k, 3.4% for AGIs over 200k)
Taxes paid: $4,804 (reported on 19.7% of returns)
33770:
$4,804
State:
$6,203
(% of AGI for various income ranges: 1.2% for AGIs below $25k, 1.3% for AGIs $25k-50k, 1.8% for AGIs $50k-75k, 2.0% for AGIs $75k-100k, 2.7% for AGIs $100k-200k, 2.4% for AGIs over 200k)
Earned income credit: $2,053 (reported on 19.1% of returns)
Here:
$2,053
State:
$2,372
(% of AGI for various income ranges: 5.4% for AGIs below $25k, 0.8% for AGIs $25k-50k)
Percentage of individuals using paid preparers for their 2012 taxes: 49.4%
Here:
49%
State:
54%
(% for various income ranges: 47.3% for AGIs below $25k, 46.0% for AGIs $25k-50k, 50.4% for AGIs $50k-75k, 51.3% for AGIs $75k-100k, 62.0% for AGIs $100k-200k, 88.5% for AGIs over 200k)
Averages for the 2004 tax year for zip code 33770, filed in 2005:
Average Adjusted Gross Income (AGI) in 2004: $41,465 (Individual Income Tax Returns)
Here:
$41,465
State:
$50,523
Salary/wage: $34,533 (reported on 77.3% of returns)
Here:
$34,533
State:
$39,563
(% of AGI for various income ranges: 121.8% for AGIs below $10k, 73.2% for AGIs $10k-25k, 77.0% for AGIs $25k-50k, 69.8% for AGIs $50k-75k, 67.4% for AGIs $75k-100k, 47.8% for AGIs over 100k)
Taxable interest for individuals: $3,304 (reported on 41.3% of returns)
This zip code:
$3,304
Florida:
$3,211
(% of AGI for various income ranges: 16.5% for AGIs below $10k, 4.0% for AGIs $10k-25k, 2.5% for AGIs $25k-50k, 2.3% for AGIs $50k-75k, 3.0% for AGIs $75k-100k, 3.4% for AGIs over 100k)
Taxable dividends: $5,613 (reported on 25.3% of returns)
Here:
$5,613
State:
$6,129
(% of AGI for various income ranges: 8.5% for AGIs below $10k, 2.6% for AGIs $10k-25k, 2.1% for AGIs $25k-50k, 2.5% for AGIs $50k-75k, 3.5% for AGIs $75k-100k, 4.7% for AGIs over 100k)
Net capital gain/loss: +$13,160 (reported on 21.8% of returns)
Here:
+$13,160
State:
+$27,205
(% of AGI for various income ranges: -5.6% for AGIs below $10k, 0.4% for AGIs $10k-25k, 0.5% for AGIs $25k-50k, 1.9% for AGIs $50k-75k, 3.5% for AGIs $75k-100k, 16.9% for AGIs over 100k)
Profit/loss from business: +$9,390 (reported on 12.2% of returns)
Here:
+$9,390
State:
+$10,634
(% of AGI for various income ranges: 13.2% for AGIs below $10k, 3.8% for AGIs $10k-25k, 2.3% for AGIs $25k-50k, 2.1% for AGIs $50k-75k, 2.5% for AGIs $75k-100k, 2.6% for AGIs over 100k)
IRA payment deduction: $3,016 (reported on 2.6% of returns)
33770:
$3,016
Florida:
$3,082
(% of AGI for various income ranges: 0.3% for AGIs below $10k, 0.2% for AGIs $10k-25k, 0.2% for AGIs $25k-50k, 0.2% for AGIs $50k-75k, 0.2% for AGIs $75k-100k, 0.1% for AGIs over 100k)
Self-employed pension: $16,667 (reported on 0.4% of returns)
Here:
$16,667
Florida:
$15,857
Total itemized deductions: $18,418 (22% of AGI, reported on 23.7% of returns)
Here:
$18,418
State:
$20,370
Here:
21.5% of AGI
State:
20.7% of AGI
(% of AGI for various income ranges: 19.6% for AGIs below $10k, 8.4% for AGIs $10k-25k, 9.9% for AGIs $25k-50k, 11.3% for AGIs $50k-75k, 11.8% for AGIs $75k-100k, 10.6% for AGIs over 100k)
Charity contributions deductions: $3,682 (4% of AGI, reported on 19.2% of returns)
Here:
$3,682
State:
$4,064
Here:
4.0% of AGI
State:
3.8% of AGI
(% of AGI for various income ranges: 0.7% for AGIs below $10k, 0.9% for AGIs $10k-25k, 1.1% for AGIs $25k-50k, 1.5% for AGIs $50k-75k, 1.7% for AGIs $75k-100k, 2.5% for AGIs over 100k)
Total tax: $6,861 (reported on 74.9% of returns)
33770:
$6,861
State:
$9,431
(% of AGI for various income ranges: 4.0% for AGIs below $10k, 4.3% for AGIs $10k-25k, 7.3% for AGIs $25k-50k, 9.6% for AGIs $50k-75k, 11.3% for AGIs $75k-100k, 20.3% for AGIs over 100k)
Earned income credit: $1,541 (reported on 15.6% of returns)
Here:
$1,541
State:
$1,808
Percentage of individuals using paid preparers for their 2004 taxes: 56.4%
Here:
56%
State:
60%
(% for various income ranges: 54.3% for AGIs below $10k, 57.1% for AGIs $10k-25k, 52.9% for AGIs $25k-50k, 56.1% for AGIs $50k-75k, 60.2% for AGIs $75k-100k, 72.3% for AGIs over 100k)
Likely homosexual households (counted as self-reported same-sex unmarried-partner households)
Lesbian couples: 0.4% of all households
Gay men: 0.5% of all households
Household received Food Stamps/SNAP in the past 12 months: 1,352 Household did not receive Food Stamps/SNAP in the past 12 months: 10,712
Women who had a birth in the past 12 months: 194 (94 now married, 95 unmarried) Women who did not have a birth in the past 12 months: 5,277 (1,808 now married, 3,467 unmarried)
Housing units in zip code 33770 with a mortgage: 3,544 (336 second mortgage, 266 both second mortgage and home equity loan) Houses without a mortgage: 100
Median monthly owner costs for units with a mortgage: $1,466 Median monthly owner costs for units without a mortgage: $650
Residents with income below the poverty level in 2022:
This zip code:
13.4%
Whole state:
12.7%
Residents with income below 50% of the poverty level in 2022:
This zip code:
6.2%
Whole state:
6.6%
Median number of rooms in houses and condos:
Here:
5.5
State:
5.9
Median number of rooms in apartments:
Here:
4.0
State:
4.2
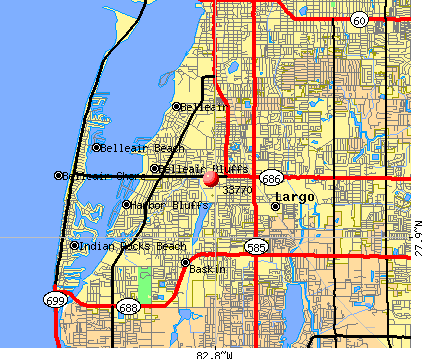
Notable locations in this zip code not listed on our city pages
Notable locations in zip code 33770: Countryside Plaza (A), Royal Plaza (B), West Bay Center (C), Belleair Bazaar (D), Belleair Bluffs Plaza (E), Harbor Bluffs Center (F), Largo Fire Rescue Station 41 (G), Belleair Bluffs Fire Department (H), Largo Police Department (I). Display/hide their locations on the map
Shopping Centers: The Orange Grove Shopping Center (1), Midway Shopping Center (2), Pinellas Shopping Center (3), Sunshine Mall (4), Countryside Mall (5). Display/hide their locations on the map
Churches in zip code 33770 include: Saint Pauls Church (A), Rogate Lutheran Church of the Deaf (B), Church of God-Largo (C), Central Church of the Nazarene (D), Prince of Peace Lutheran Church (E), Bethel Lutheran Church (F), Everlasting Bread of Life (G), Suncoast Christian Center (H), Saint Catherine of Siena Catholic Church (I). Display/hide their locations on the map
Parks in zip code 33770 include: Lake Villa Park (1), Woodrow Avenue Park (2), Taylor Park (3), Ulmer Park (4), Highland Recreation Complex (5), Belleair Boat Ramp Park (6). Display/hide their locations on the map
1,844 married couples with children.
1,331 single-parent households (321 men, 1,010 women).
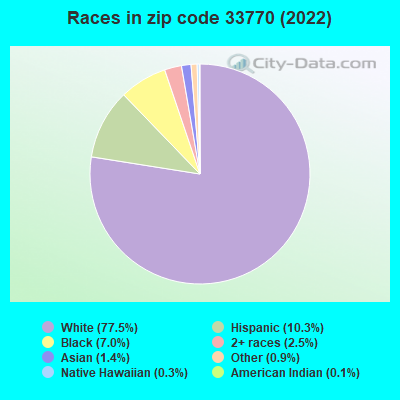
87.4% of residents of 33770 zip code speak English at home.
7.2% of residents speak Spanish at home (51% very well, 31% well, 16% not well, 1% not at all).
4.6% of residents speak other Indo-European language at home (69% very well, 19% well, 8% not well, 4% not at all).
0.6% of residents speak Asian or Pacific Island language at home (77% very well, 11% well, 11% not well).
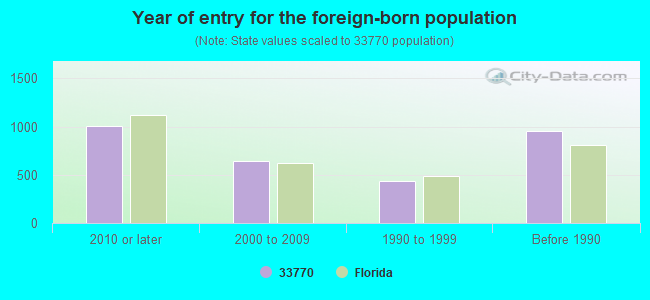
Foreign born population: 2,668 (10.1%) (54.7% of them are naturalized citizens)
Major facilities with environmental interests located in this zip code:
PINELLAS BOOT CAMP (301 4TH STREET, SW in LARGO, FL)
(National Center for Education Statistics) - STATE ID-8032 (National Center for Education Statistics) - STATE ID-8037 Organizations: PINELLAS COUNTY SCHOOL DISTRICT (SCHOOL DISTRICT)
LARGO CENTRAL ELEMENTARY SCHOOL (250 1ST AVENUE, N.E. in LARGO, FL)
(Geographic Names Information System) (National Center for Education Statistics) - STATE ID-2061 Organizations: PINELLAS COUNTY SCHOOL DISTRICT (SCHOOL DISTRICT)
PINELLAS MARINE INSTITUTE (301 4TH STREET, SW in LARGO, FL)
(Geographic Names Information System) (National Center for Education Statistics) - STATE ID-8033 Organizations: PINELLAS COUNTY SCHOOL DISTRICT (SCHOOL DISTRICT)
PATIO SHOP OF BELLEAIR BLUFFS (2800 W BAY DR in BELLEAIR BLUFFS, FL)
(Integrated Compliance Information System) - ICIS-04-1997-0175, FORMAL ENFORCEMENT ACTION COMPLIANCE ACTIVITY (Tracking inspections of insecticide, fungicide, and rodenticide, and toxic substances) Business SIC classification: FURNITURE STORES
(National Center for Education Statistics) - STATE ID-8011 Organizations: PINELLAS COUNTY SCHOOL DISTRICT (SCHOOL DISTRICT)
COUNTY SUPERINTENDENT'S OFFICE (301 4TH STREET S.W. in LARGO, FL)
(National Center for Education Statistics) - STATE ID-9001 Organizations: PINELLAS COUNTY SCHOOL DISTRICT (SCHOOL DISTRICT)
LARGO HIGH SCHOOL (410 MISSOURI AVENUE in LARGO, FL)
(National Center for Education Statistics) - STATE ID-2081 Organizations: PINELLAS COUNTY SCHOOL DISTRICT (SCHOOL DISTRICT)
PRE-K EARLY INTERVENTION PROGRAM-LARGO CURRICULUM (301 4TH STREET, S.W. in LARGO, FL)
(National Center for Education Statistics) - STATE ID-7101 Organizations: PINELLAS COUNTY SCHOOL DISTRICT (SCHOOL DISTRICT)
LEAF PEMHS (FORMERLY LEAF HALFWAY HOUSE) (I (301 4TH STREET, SW in LARGO, FL)
(National Center for Education Statistics) - STATE ID-8027 Organizations: PINELLAS COUNTY SCHOOL DISTRICT (SCHOOL DISTRICT)
LEAF RECOVERY (301 4TH STREET SW in LARGO, FL)
(National Center for Education Statistics) - STATE ID-8038 Organizations: PINELLAS COUNTY SCHOOL DISTRICT (SCHOOL DISTRICT)
PINELLAS JUVENILE DETENTION CENTER (FORMERLY PINEL (301 4TH STREET, SW in LARGO, FL)
(National Center for Education Statistics) - STATE ID-8031 Organizations: PINELLAS COUNTY SCHOOL DISTRICT (SCHOOL DISTRICT)
PINELLAS CO - MCKAY CREEK STP (14800 118TH AVENUE in LARGO, FL)
CRITERIA AND HAZARDOUS AIR POLLUTANT INVENTORY (Inventory of air pollution sources) National Pollutant Discharge Elimination System NON-MAJOR (Tracking pollutant discharge elimination systems) - permit Small Quantity Generators, between 100 kg and 1000 kg of hazardous waste/month (Resource Conservation and Recovery Act (tracking hazardous waste)) - notification Business SIC classification: SEWERAGE SYSTEMS Business NAICS classification: SEWAGE TREATMENT FACILITIES. Organizations: JAMES ROLSTON (CONTACT/OWNER)
, CHARLES HAMBERGER (CONTACT/OWNER)
Alternative names: MCKAY CREEK WASTEWATER TREATMENT FACILITY, MCKAY CREEK WWTF, PINELLAS CO MCKAY CREEK T P, PINELLAS COUNTY UTILITY OPER
MILDRED HELMS ELEMENTARY SCHOOL (561 S CLEARWATER/LARGO RD in LARGO, FL)
(National Center for Education Statistics) - STATE ID-2431 Organizations: PINELLAS COUNTY SCHOOL DISTRICT (SCHOOL DISTRICT)
Housing units lacking complete plumbing facilities: 0.3% Housing units lacking complete kitchen facilities: 1.4%
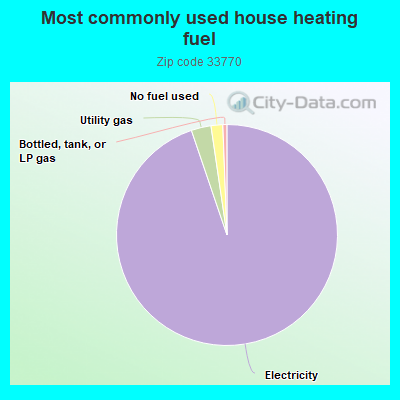
94.5%Electricity
2.9%Utility gas
1.7%No fuel used
0.6%Bottled, tank, or LP gas
Place of birth for U.S.-born residents:
This state: 9,574
Northeast: 5,826
Midwest: 4,148
South: 3,057
West: 771
49% of the 33770 zip code residents lived in the same house 5 years ago. Out of people who lived in different houses, 63% lived in this county. Out of people who lived in different counties, 50% lived in Florida.
88% of the 33770 zip code residents lived in the same house 1 year ago. Out of people who lived in different houses, 56% moved from this county. Out of people who lived in different houses, 14% moved from different county within same state. Out of people who lived in different houses, 20% moved from different state. Out of people who lived in different houses, 6% moved from abroad.
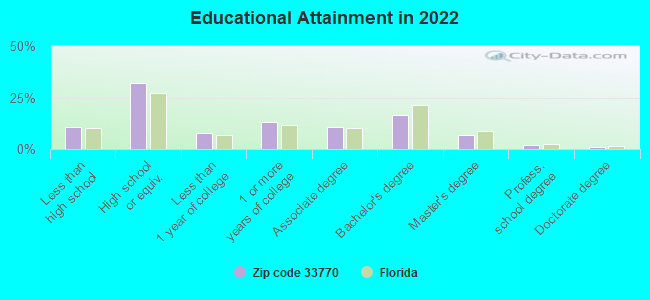
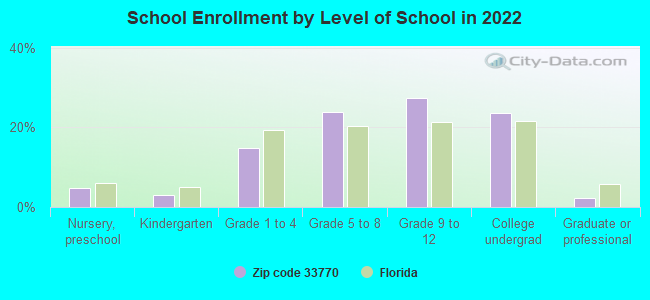
Private vs. public school enrollment:
Students in private schools in grades 1 to 8 (elementary and middle school): 599
Here:
30.5%
Florida:
15.8%
Students in private schools in grades 9 to 12 (high school): 237
Here:
17.0%
Florida:
12.9%
Students in private undergraduate colleges: 150
Here:
12.6%
Florida:
23.6%
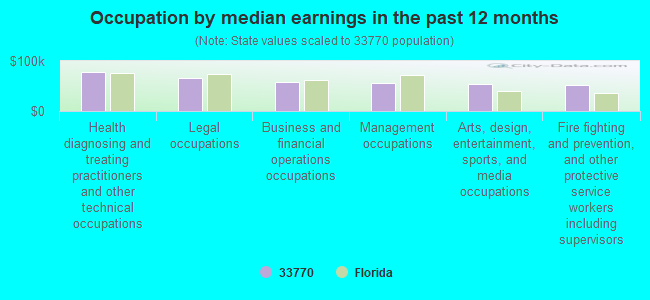
Occupation by median earnings in the past 12 months ($)
77,911Health diagnosing and treating practitioners and other technical occupations
65,677Legal occupations
57,350Business and financial operations occupations
55,078Management occupations
53,243Arts, design, entertainment, sports, and media occupations
52,057Fire fighting and prevention, and other protective service workers including supervisors
Companies with federal contracts located in this zip code:
DGP, LLC (FORMERLY DAVLEN, LLC (222 W BAY DR in LARGO, FL; small business) : $75,591 in 5 contractsfrom 2005 to 2006
Contracts for Fans, Air Circulators, and Blower Equipment, Refrigeration and Air Conditioning Components, Hose, Pipe, Tube, Lubrication, and Railing Fittings by Defense Logistics Agency, National Park Service, Bureau of Reclamation Signed by year:2000: $0; 2001: $0; 2002: $0; 2003: $0; 2004: $0; 2005: $18,338; 2006: $57,253.
Biggest contracts:
$28,484 with Defense Logistics Agency for Fans, Air Circulators, and Blower Equipment. Signed on 2006-02-09. Completion date: 2006-04-07.
$21,079 with National Park Service for Refrigeration and Air Conditioning Components. Taking place in AR. Signed on 2006-03-31. Completion date: 2006-03-31.
$18,338 with Bureau of Reclamation for Hose, Pipe, Tube, Lubrication, and Railing Fittings. Signed on 2005-07-22. Completion date: 2005-10-28.
$7,690 with Defense Logistics Agency for Fans, Air Circulators, and Blower Equipment. Signed on 2006-04-15. Completion date: 2006-05-01.
Top industries in this zip code by the number of employees in 2005:
Health Care and Social Assistance: Home Health Care Services (over 1000 employees: 1 establishment, 250-499 employees: 1 establishment, 20-49 employees: 1 establishment, 1-4 employees: 1 establishment)
Health Care and Social Assistance: General Medical and Surgical Hospitals (500-999: 1, 10-19: 1)
Health Care and Social Assistance: Offices of Physicians (except Mental Health Specialists) (250-499: 1, 20-49: 3, 10-19: 7, 5-9: 7, 1-4: 20)
Other Services (except Public Administration): Other Similar Organizations (except Business, Professional, Labor, and Political Organizations) (100-249: 1, 1-4: 8)
People in group quarters in 2010:
202 people in nursing facilities/skilled-nursing facilities
10 people in workers' group living quarters and job corps centers
8 people in group homes intended for adults
3 people in other noninstitutional facilities
People in group quarters in 2000:
96 people in wards in general hospitals for patients who have no usual home elsewhere
92 people in other noninstitutional group quarters
43 people in other group homes
26 people in homes for the mentally ill
24 people in nursing homes
8 people in homes for the mentally retarded
6 people in religious group quarters
Fatal accident statistics in 2014:
Fatal accident count: 1
Vehicles involved in fatal accidents: 1
Fatal accidents caused by drunken drivers: 0
Fatalities: 1
Persons involved in fatal accidents: 1
Pedestrians involved in fatal accidents: 3
Fatal accident statistics in 2013:
Fatal accident count: 1
Vehicles involved in fatal accidents: 1
Fatal accidents caused by drunken drivers: 0
Fatalities: 1
Persons involved in fatal accidents: 1
Pedestrians involved in fatal accidents: 1
Home Mortgage Disclosure Act Aggregated Statistics For Year 2009 (Based on 2 full and 14 partial tracts)
A) FHA, FSA/RHS & VA Home Purchase Loans
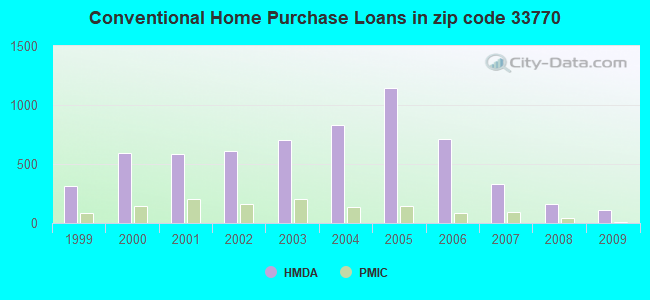
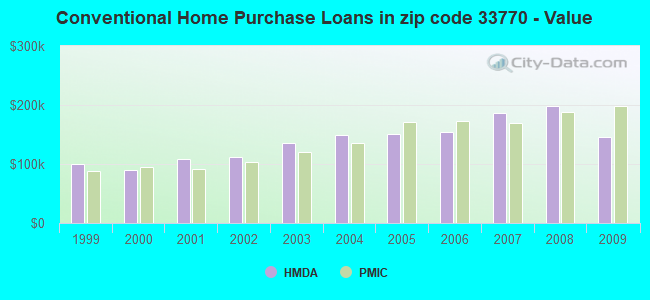
B) Conventional Home Purchase Loans
C) Refinancings
D) Home Improvement Loans
E) Loans on Dwellings For 5+ Families
F) Non-occupant Loans on < 5 Family Dwellings (A B C & D)
G) Loans On Manufactured Home Dwelling (A B C & D)
Number
Average Value
Number
Average Value
Number
Average Value
Number
Average Value
Number
Average Value
Number
Average Value
Number
Average Value
LOANS ORIGINATED
114
$131,232
106
$146,545
269
$166,464
13
$24,136
2
$317,975
35
$199,668
10
$35,168
APPLICATIONS APPROVED, NOT ACCEPTED
12
$136,802
11
$98,119
32
$153,714
7
$46,173
1
$11,773,560
6
$89,107
2
$49,565
APPLICATIONS DENIED
18
$134,169
38
$111,834
194
$169,049
25
$119,160
2
$272,550
36
$114,323
10
$46,584
APPLICATIONS WITHDRAWN
22
$152,571
14
$164,656
97
$173,595
4
$291,182
0
$0
9
$110,328
1
$45,430
FILES CLOSED FOR INCOMPLETENESS
1
$76,240
3
$124,997
39
$157,338
5
$78,952
0
$0
5
$218,142
1
$94,810
Aggregated Statistics For Year 2008 (Based on 2 full and 14 partial tracts)
A) FHA, FSA/RHS & VA Home Purchase Loans
B) Conventional Home Purchase Loans
C) Refinancings
D) Home Improvement Loans
E) Loans on Dwellings For 5+ Families
F) Non-occupant Loans on < 5 Family Dwellings (A B C & D)
G) Loans On Manufactured Home Dwelling (A B C & D)
Number
Average Value
Number
Average Value
Number
Average Value
Number
Average Value
Number
Average Value
Number
Average Value
Number
Average Value
LOANS ORIGINATED
92
$152,967
158
$197,983
305
$159,780
54
$68,229
1
$1,404,480
82
$167,219
11
$44,421
APPLICATIONS APPROVED, NOT ACCEPTED
9
$142,419
29
$129,064
90
$192,334
19
$61,829
0
$0
17
$127,322
15
$47,883
APPLICATIONS DENIED
16
$132,388
89
$96,339
295
$180,926
79
$74,683
0
$0
45
$120,820
50
$43,141
APPLICATIONS WITHDRAWN
13
$146,283
45
$122,358
104
$166,041
13
$160,258
0
$0
6
$118,840
29
$44,254
FILES CLOSED FOR INCOMPLETENESS
7
$179,833
11
$376,152
33
$186,469
6
$100,775
0
$0
7
$157,093
0
$0
Aggregated Statistics For Year 2007 (Based on 2 full and 14 partial tracts)
A) FHA, FSA/RHS & VA Home Purchase Loans
B) Conventional Home Purchase Loans
C) Refinancings
D) Home Improvement Loans
E) Loans on Dwellings For 5+ Families
F) Non-occupant Loans on < 5 Family Dwellings (A B C & D)
G) Loans On Manufactured Home Dwelling (A B C & D)
Number
Average Value
Number
Average Value
Number
Average Value
Number
Average Value
Number
Average Value
Number
Average Value
Number
Average Value
LOANS ORIGINATED
19
$167,615
332
$186,274
702
$164,924
119
$101,175
1
$745,040
159
$144,104
17
$204,904
APPLICATIONS APPROVED, NOT ACCEPTED
0
$0
51
$165,301
189
$176,881
43
$57,316
0
$0
34
$173,159
7
$43,330
APPLICATIONS DENIED
16
$141,294
88
$159,414
564
$176,264
132
$102,471
1
$3,060
65
$154,299
17
$44,946
APPLICATIONS WITHDRAWN
2
$151,620
43
$199,236
246
$187,190
37
$147,609
1
$601,920
30
$142,765
1
$69,970
FILES CLOSED FOR INCOMPLETENESS
0
$0
21
$141,293
87
$168,113
2
$131,820
1
$2,675,200
5
$107,502
2
$76,385
Aggregated Statistics For Year 2006 (Based on 2 full and 14 partial tracts)
A) FHA, FSA/RHS & VA Home Purchase Loans
B) Conventional Home Purchase Loans
C) Refinancings
D) Home Improvement Loans
E) Loans on Dwellings For 5+ Families
F) Non-occupant Loans on < 5 Family Dwellings (A B C & D)
G) Loans On Manufactured Home Dwelling (A B C & D)
Number
Average Value
Number
Average Value
Number
Average Value
Number
Average Value
Number
Average Value
Number
Average Value
Number
Average Value
LOANS ORIGINATED
32
$138,961
713
$155,035
1,132
$160,790
159
$93,180
6
$573,742
351
$143,254
50
$48,406
APPLICATIONS APPROVED, NOT ACCEPTED
0
$0
131
$158,949
218
$150,226
48
$89,220
0
$0
56
$166,333
19
$53,261
APPLICATIONS DENIED
6
$143,245
272
$116,324
592
$169,671
122
$86,912
0
$0
124
$137,746
68
$46,212
APPLICATIONS WITHDRAWN
2
$150,450
72
$204,242
422
$160,405
41
$216,396
0
$0
50
$125,693
2
$65,800
FILES CLOSED FOR INCOMPLETENESS
0
$0
37
$283,337
154
$167,499
3
$730,500
0
$0
23
$140,618
0
$0
Aggregated Statistics For Year 2005 (Based on 2 full and 14 partial tracts)
A) FHA, FSA/RHS & VA Home Purchase Loans
B) Conventional Home Purchase Loans
C) Refinancings
D) Home Improvement Loans
E) Loans on Dwellings For 5+ Families
F) Non-occupant Loans on < 5 Family Dwellings (A B C & D)
G) Loans On Manufactured Home Dwelling (A B C & D)
Number
Average Value
Number
Average Value
Number
Average Value
Number
Average Value
Number
Average Value
Number
Average Value
Number
Average Value
LOANS ORIGINATED
39
$140,105
1,147
$151,603
1,120
$140,162
151
$89,171
9
$4,207,353
417
$141,428
47
$41,916
APPLICATIONS APPROVED, NOT ACCEPTED
3
$137,413
130
$131,060
213
$130,667
35
$69,183
0
$0
48
$116,312
30
$56,535
APPLICATIONS DENIED
12
$121,439
253
$128,187
612
$144,948
129
$61,629
2
$205,195
68
$135,708
38
$51,613
APPLICATIONS WITHDRAWN
4
$173,428
142
$171,847
432
$147,253
36
$121,045
0
$0
53
$126,872
1
$21,730
FILES CLOSED FOR INCOMPLETENESS
0
$0
40
$188,964
238
$145,361
14
$47,102
0
$0
9
$167,558
1
$71,140
Aggregated Statistics For Year 2004 (Based on 2 full and 14 partial tracts)
A) FHA, FSA/RHS & VA Home Purchase Loans
B) Conventional Home Purchase Loans
C) Refinancings
D) Home Improvement Loans
E) Loans on Dwellings For 5+ Families
F) Non-occupant Loans on < 5 Family Dwellings (A B C & D)
G) Loans On Manufactured Home Dwelling (A B C & D)
Number
Average Value
Number
Average Value
Number
Average Value
Number
Average Value
Number
Average Value
Number
Average Value
Number
Average Value
LOANS ORIGINATED
58
$121,727
833
$149,325
1,035
$124,786
139
$63,071
9
$506,389
310
$118,895
50
$40,135
APPLICATIONS APPROVED, NOT ACCEPTED
3
$131,277
118
$125,073
193
$105,734
21
$58,715
0
$0
44
$110,665
19
$57,061
APPLICATIONS DENIED
33
$107,270
189
$115,291
499
$121,407
128
$49,324
2
$209,180
84
$119,713
49
$38,002
APPLICATIONS WITHDRAWN
5
$147,166
84
$133,553
328
$117,391
45
$60,793
0
$0
20
$88,578
1
$149,270
FILES CLOSED FOR INCOMPLETENESS
2
$96,620
24
$94,497
187
$135,468
6
$73,360
0
$0
13
$166,982
0
$0
Aggregated Statistics For Year 2003 (Based on 2 full and 14 partial tracts)
A) FHA, FSA/RHS & VA Home Purchase Loans
B) Conventional Home Purchase Loans
C) Refinancings
D) Home Improvement Loans
E) Loans on Dwellings For 5+ Families
F) Non-occupant Loans on < 5 Family Dwellings (A B C & D)
Number
Average Value
Number
Average Value
Number
Average Value
Number
Average Value
Number
Average Value
Number
Average Value
LOANS ORIGINATED
77
$109,295
703
$134,848
1,850
$118,722
74
$34,621
1
$392,410
303
$94,153
APPLICATIONS APPROVED, NOT ACCEPTED
0
$0
94
$92,122
241
$100,914
31
$36,565
0
$0
36
$95,654
APPLICATIONS DENIED
15
$88,243
162
$80,676
773
$103,346
68
$37,049
4
$177,158
81
$83,676
APPLICATIONS WITHDRAWN
10
$105,499
85
$126,147
310
$102,763
10
$46,032
2
$255,000
38
$93,438
FILES CLOSED FOR INCOMPLETENESS
0
$0
26
$171,570
85
$96,779
2
$36,315
0
$0
14
$66,627
Aggregated Statistics For Year 2002 (Based on 2 full and 14 partial tracts)
A) FHA, FSA/RHS & VA Home Purchase Loans
B) Conventional Home Purchase Loans
C) Refinancings
D) Home Improvement Loans
E) Loans on Dwellings For 5+ Families
F) Non-occupant Loans on < 5 Family Dwellings (A B C & D)
Number
Average Value
Number
Average Value
Number
Average Value
Number
Average Value
Number
Average Value
Number
Average Value
LOANS ORIGINATED
132
$104,335
613
$111,990
1,132
$109,132
99
$39,266
7
$517,274
224
$79,669
APPLICATIONS APPROVED, NOT ACCEPTED
6
$81,863
80
$90,893
200
$88,200
26
$90,295
2
$184,900
27
$67,651
APPLICATIONS DENIED
24
$109,516
130
$67,222
452
$86,613
99
$36,644
6
$198,507
48
$73,563
APPLICATIONS WITHDRAWN
9
$116,323
52
$149,077
227
$96,267
19
$56,038
0
$0
26
$78,641
FILES CLOSED FOR INCOMPLETENESS
3
$144,133
22
$84,947
108
$92,281
5
$11,298
0
$0
4
$75,945
Aggregated Statistics For Year 2001 (Based on 2 full and 14 partial tracts)
A) FHA, FSA/RHS & VA Home Purchase Loans
B) Conventional Home Purchase Loans
C) Refinancings
D) Home Improvement Loans
E) Loans on Dwellings For 5+ Families
F) Non-occupant Loans on < 5 Family Dwellings (A B C & D)
Number
Average Value
Number
Average Value
Number
Average Value
Number
Average Value
Number
Average Value
Number
Average Value
LOANS ORIGINATED
153
$92,760
587
$108,810
947
$101,806
145
$30,255
9
$827,188
181
$77,341
APPLICATIONS APPROVED, NOT ACCEPTED
2
$78,080
91
$95,679
138
$75,147
54
$30,494
0
$0
29
$89,842
APPLICATIONS DENIED
17
$89,780
180
$71,691
490
$72,445
88
$23,762
6
$302,227
36
$84,416
APPLICATIONS WITHDRAWN
12
$125,493
66
$124,795
219
$81,900
27
$24,403
0
$0
11
$57,817
FILES CLOSED FOR INCOMPLETENESS
5
$74,562
25
$133,794
58
$83,748
7
$29,797
0
$0
5
$78,144
Aggregated Statistics For Year 2000 (Based on 2 full and 14 partial tracts)
A) FHA, FSA/RHS & VA Home Purchase Loans
B) Conventional Home Purchase Loans
C) Refinancings
D) Home Improvement Loans
E) Loans on Dwellings For 5+ Families
F) Non-occupant Loans on < 5 Family Dwellings (A B C & D)
Number
Average Value
Number
Average Value
Number
Average Value
Number
Average Value
Number
Average Value
Number
Average Value
LOANS ORIGINATED
163
$85,197
593
$90,604
343
$71,462
121
$28,118
6
$1,610,193
102
$74,471
APPLICATIONS APPROVED, NOT ACCEPTED
3
$53,690
102
$73,670
82
$61,903
55
$20,188
0
$0
22
$41,833
APPLICATIONS DENIED
20
$84,898
215
$66,059
302
$61,724
104
$29,114
1
$81,680
32
$80,550
APPLICATIONS WITHDRAWN
16
$91,922
62
$102,785
164
$71,208
12
$26,192
0
$0
13
$71,474
FILES CLOSED FOR INCOMPLETENESS
2
$126,505
28
$104,816
51
$66,687
7
$28,633
0
$0
8
$44,108
Aggregated Statistics For Year 1999 (Based on 1 full and 7 partial tracts)
A) FHA, FSA/RHS & VA Home Purchase Loans
B) Conventional Home Purchase Loans
C) Refinancings
D) Home Improvement Loans
E) Loans on Dwellings For 5+ Families
F) Non-occupant Loans on < 5 Family Dwellings (A B C & D)
2002 - 2018 National Fire Incident Reporting System (NFIRS) incidents
According to the data from the years 2002 - 2018 the average number of fires per year is 81. The highest number of reported fire incidents - 125 took place in 2005, and the least - 46 in 2017. The data has a declining trend.
When looking into fire subcategories, the most reports belonged to: Structure Fires (48.6%), and Outside Fires (28.5%).
Fire incident types reported to NFIRS in Zip Code 33770


 Nearest zip codes: 33778, 33786, 33756, 33774, 33771, 33785.


 According to the data from the years 2002 - 2018 the average number of fires per year is 81. The highest number of reported fire incidents - 125 took place in 2005, and the least - 46 in 2017. The data has a declining trend.
 When looking into fire subcategories, the most reports belonged to: Structure Fires (48.6%), and Outside Fires (28.5%).