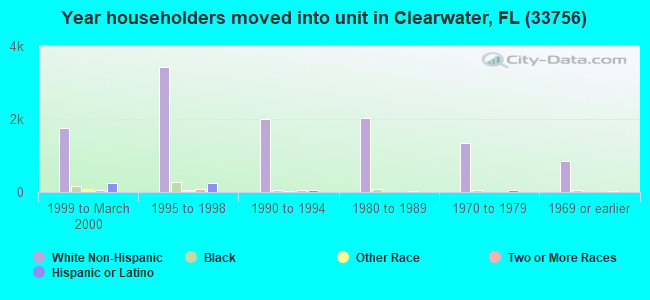
Estimated zip code population in 2022: 33,535 Zip code population in 2010: 31,275 Zip code population in 2000: 29,081
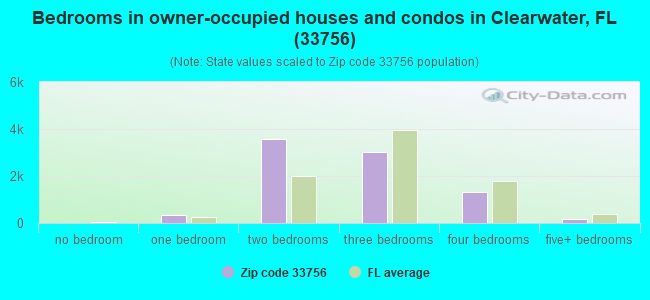
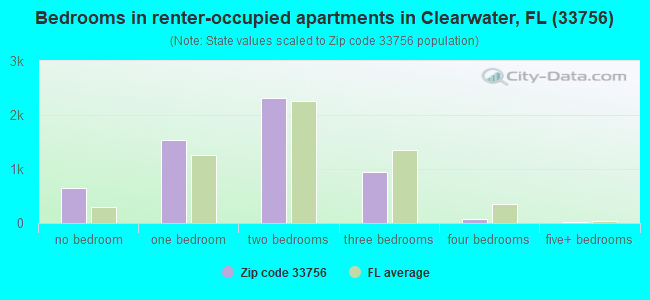
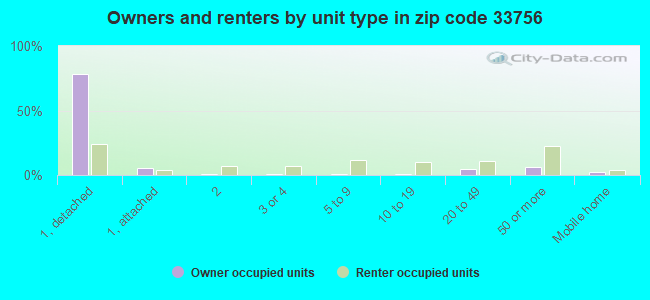
Houses and condos: 15,883 Renter-occupied apartments: 5,503
% of renters here:
39%
State:
33%
March 2022 cost of living index in zip code 33756: 99.3 (near average, U.S. average is 100)
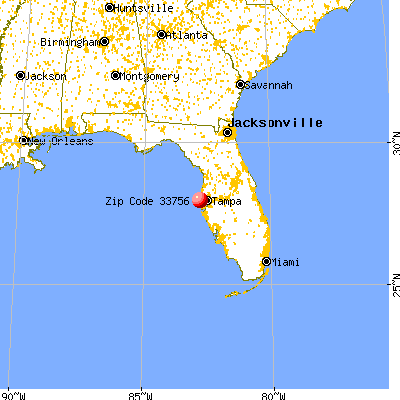
Land area: 7.2 sq. mi. Water area: 1.5 sq. mi.
Population density: 4,635 people per square mile
(average).
OSM Map
General Map
Google Map
MSN Map
OSM Map
General Map
Google Map
MSN Map
OSM Map
General Map
Google Map
MSN Map
OSM Map
General Map
Google Map
MSN Map
Please wait while loading the map...
Real estate property taxes paid for housing units in 2022:
This zip code:
0.6% ($2,215)
Florida:
0.7% ($2,529)
Median real estate property taxes paid for housing units with mortgages in 2022: $2,321 (0.7%) Median real estate property taxes paid for housing units with no mortgage in 2022: $2,016 (0.6%)
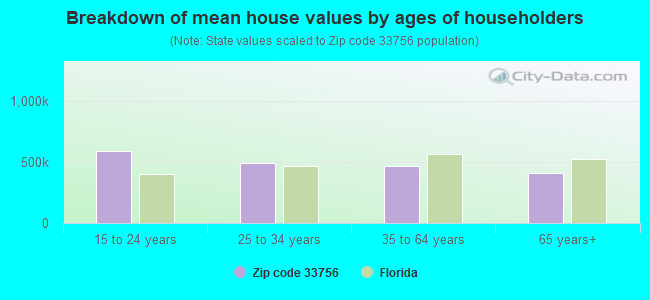
Estimated median house/condo value in 2022: $345,132
33756:
$345,132
Florida:
$354,100
According to our research of Florida and other state lists, there were 49 registered sex offenders living in 33756 zip code as of April 27, 2024. The ratio of all residents to sex offenders in zip code 33756 is 661 to 1. The ratio of registered sex offenders to all residents in this zip code is near the state average.
Median resident age:
This zip code:
45.0 years
Florida median age:
42.7 years
Average household size:
This zip code:
2.3 people
Florida:
2.5 people
Averages for the 2020 tax year for zip code 33756, filed in 2021:
Average Adjusted Gross Income (AGI) in 2020: $94,480 (Individual Income Tax Returns)
Here:
$94,480
State:
$82,200
Salary/wage: $54,828 (reported on 78.0% of returns)
Here:
$54,828
State:
$58,347
(% of AGI for various income ranges: 1230.3% for AGIs below $25k, 3664.8% for AGIs $25k-50k, 6681.1% for AGIs $50k-75k, 10061.1% for AGIs $75k-100k, 17046.3% for AGIs $100k-200k, 106681.6% for AGIs over 200k)
Taxable interest for individuals: $6,336 (reported on 26.1% of returns)
This zip code:
$6,336
Florida:
$4,272
(% of AGI for various income ranges: 18.0% for AGIs below $25k, 25.1% for AGIs $25k-50k, 59.4% for AGIs $50k-75k, 121.8% for AGIs $75k-100k, 326.7% for AGIs $100k-200k, 10505.8% for AGIs over 200k)
Ordinary dividends: $19,377 (reported on 19.8% of returns)
Here:
$19,377
State:
$15,863
(% of AGI for various income ranges: 33.8% for AGIs below $25k, 58.5% for AGIs $25k-50k, 185.4% for AGIs $50k-75k, 364.5% for AGIs $75k-100k, 1197.3% for AGIs $100k-200k, 22194.7% for AGIs over 200k)
Net capital gain/loss in AGI: +$101,084 (reported on 19.2% of returns)
Here:
+$101,084
State:
+$62,983
(% of AGI for various income ranges: 18.3% for AGIs below $25k, 34.0% for AGIs $25k-50k, 104.0% for AGIs $50k-75k, 395.9% for AGIs $75k-100k, 1280.9% for AGIs $100k-200k, 151068.4% for AGIs over 200k)
Profit/loss from business: +$7,770 (reported on 17.8% of returns)
Here:
+$7,770
State:
+$9,719
(% of AGI for various income ranges: 143.6% for AGIs below $25k, 128.7% for AGIs $25k-50k, 249.0% for AGIs $50k-75k, 329.2% for AGIs $75k-100k, 673.9% for AGIs $100k-200k, 182.1% for AGIs over 200k)
Taxable individual retirement arrangement distribution: $22,060 (reported on 9.9% of returns)
33756:
$22,060
Florida:
$24,823
(% of AGI for various income ranges: 57.3% for AGIs below $25k, 95.3% for AGIs $25k-50k, 246.1% for AGIs $50k-75k, 471.0% for AGIs $75k-100k, 1252.2% for AGIs $100k-200k, 6260.0% for AGIs over 200k)
Self-employed (Keogh) retirement plans: $25,700 (reported on 0.4% of returns)
33756:
$25,700
Florida:
$29,694
(% of AGI for various income ranges: 946.8% for AGIs over 200k)
Total itemized deductions: $82,497 (reported on 7.7% of returns)
Here:
$82,497
State:
$45,393
(% of AGI for various income ranges: 50.6% for AGIs below $25k, 123.5% for AGIs $25k-50k, 387.4% for AGIs $50k-75k, 514.6% for AGIs $75k-100k, 1255.1% for AGIs $100k-200k, 38957.9% for AGIs over 200k)
Charity contributions: $43,022 (reported on 6.4% of returns)
Here:
$43,022
State:
$20,178
(% of AGI for various income ranges: 6.2% for AGIs below $25k, 37.2% for AGIs $25k-50k, 88.0% for AGIs $50k-75k, 139.9% for AGIs $75k-100k, 509.9% for AGIs $100k-200k, 18606.8% for AGIs over 200k)
Taxes paid: $6,778 (reported on 7.5% of returns)
33756:
$6,778
State:
$6,967
(% of AGI for various income ranges: 5.3% for AGIs below $25k, 17.9% for AGIs $25k-50k, 64.9% for AGIs $50k-75k, 78.7% for AGIs $75k-100k, 214.3% for AGIs $100k-200k, 2100.0% for AGIs over 200k)
Earned income credit: $2,180 (reported on 18.7% of returns)
Here:
$2,180
State:
$2,306
(% of AGI for various income ranges: 104.8% for AGIs below $25k, 60.8% for AGIs $25k-50k, 1.2% for AGIs $50k-75k)
Percentage of individuals using paid preparers for their 2020 taxes: 91.3%
Here:
91%
State:
92%
(% for various income ranges: 90.0% for AGIs below $25k, 92.2% for AGIs $25k-50k, 91.8% for AGIs $50k-75k, 91.6% for AGIs $75k-100k, 91.8% for AGIs $100k-200k, 93.2% for AGIs over 200k)
Averages for the 2012 tax year for zip code 33756, filed in 2013:
Average Adjusted Gross Income (AGI) in 2012: $61,923 (Individual Income Tax Returns)
Here:
$61,923
State:
$60,316
Salary/wage: $42,674 (reported on 77.7% of returns)
Here:
$42,674
State:
$45,277
(% of AGI for various income ranges: 72.3% for AGIs below $25k, 77.3% for AGIs $25k-50k, 70.4% for AGIs $50k-75k, 68.7% for AGIs $75k-100k, 60.0% for AGIs $100k-200k, 29.9% for AGIs over 200k)
Taxable interest for individuals: $3,741 (reported on 29.0% of returns)
This zip code:
$3,741
Florida:
$3,587
(% of AGI for various income ranges: 1.6% for AGIs below $25k, 1.0% for AGIs $25k-50k, 1.3% for AGIs $50k-75k, 1.4% for AGIs $75k-100k, 1.9% for AGIs $100k-200k, 2.2% for AGIs over 200k)
Ordinary dividends: $13,392 (reported on 21.6% of returns)
Here:
$13,392
State:
$12,831
(% of AGI for various income ranges: 4.1% for AGIs below $25k, 2.7% for AGIs $25k-50k, 3.5% for AGIs $50k-75k, 3.9% for AGIs $75k-100k, 4.9% for AGIs $100k-200k, 6.0% for AGIs over 200k)
Net capital gain/loss in AGI: +$24,451 (reported on 17.4% of returns)
Here:
+$24,451
State:
+$33,493
(% of AGI for various income ranges: 0.6% for AGIs $25k-50k, 1.9% for AGIs $50k-75k, 0.9% for AGIs $75k-100k, 2.6% for AGIs $100k-200k, 15.2% for AGIs over 200k)
Profit/loss from business: +$13,882 (reported on 15.5% of returns)
Here:
+$13,882
State:
+$10,012
(% of AGI for various income ranges: 9.2% for AGIs below $25k, 2.8% for AGIs $25k-50k, 2.3% for AGIs $50k-75k, 2.3% for AGIs $75k-100k, 3.0% for AGIs $100k-200k, 3.2% for AGIs over 200k)
Taxable individual retirement arrangement distribution: $19,617 (reported on 11.1% of returns)
33756:
$19,617
Florida:
$21,544
(% of AGI for various income ranges: 3.2% for AGIs below $25k, 2.2% for AGIs $25k-50k, 3.3% for AGIs $50k-75k, 4.0% for AGIs $75k-100k, 6.2% for AGIs $100k-200k, 3.0% for AGIs over 200k)
Self-employment retirement plans: $16,060 (reported on 0.4% of returns)
33756:
$16,060
Florida:
$20,611
Total itemized deductions: $29,661 (18% of AGI, reported on 22.0% of returns)
Here:
$29,661
State:
$25,533
Here:
17.6% of AGI
State:
18.0% of AGI
(% of AGI for various income ranges: 8.6% for AGIs below $25k, 7.8% for AGIs $25k-50k, 10.2% for AGIs $50k-75k, 11.4% for AGIs $75k-100k, 12.9% for AGIs $100k-200k, 10.9% for AGIs over 200k)
Charity contributions: $11,632 (reported on 18.0% of returns)
Here:
$11,632
State:
$5,698
(% of AGI for various income ranges: 0.8% for AGIs below $25k, 1.2% for AGIs $25k-50k, 1.8% for AGIs $50k-75k, 2.3% for AGIs $75k-100k, 3.2% for AGIs $100k-200k, 5.5% for AGIs over 200k)
Taxes paid: $6,102 (reported on 21.5% of returns)
33756:
$6,102
State:
$6,203
(% of AGI for various income ranges: 1.1% for AGIs below $25k, 1.4% for AGIs $25k-50k, 1.8% for AGIs $50k-75k, 2.4% for AGIs $75k-100k, 3.1% for AGIs $100k-200k, 2.3% for AGIs over 200k)
Earned income credit: $2,236 (reported on 20.5% of returns)
Here:
$2,236
State:
$2,372
(% of AGI for various income ranges: 6.5% for AGIs below $25k, 0.8% for AGIs $25k-50k)
Percentage of individuals using paid preparers for their 2012 taxes: 52.2%
Here:
52%
State:
54%
(% for various income ranges: 50.6% for AGIs below $25k, 47.9% for AGIs $25k-50k, 48.8% for AGIs $50k-75k, 54.8% for AGIs $75k-100k, 63.6% for AGIs $100k-200k, 89.1% for AGIs over 200k)
Averages for the 2004 tax year for zip code 33756, filed in 2005:
Average Adjusted Gross Income (AGI) in 2004: $60,439 (Individual Income Tax Returns)
Here:
$60,439
State:
$50,523
Salary/wage: $40,856 (reported on 77.3% of returns)
Here:
$40,856
State:
$39,563
(% of AGI for various income ranges: 198.7% for AGIs below $10k, 72.5% for AGIs $10k-25k, 76.5% for AGIs $25k-50k, 73.5% for AGIs $50k-75k, 68.9% for AGIs $75k-100k, 34.5% for AGIs over 100k)
Taxable interest for individuals: $3,727 (reported on 43.5% of returns)
This zip code:
$3,727
Florida:
$3,211
(% of AGI for various income ranges: 23.9% for AGIs below $10k, 4.0% for AGIs $10k-25k, 2.3% for AGIs $25k-50k, 2.2% for AGIs $50k-75k, 3.0% for AGIs $75k-100k, 2.4% for AGIs over 100k)
Taxable dividends: $8,350 (reported on 27.1% of returns)
Here:
$8,350
State:
$6,129
(% of AGI for various income ranges: 16.4% for AGIs below $10k, 3.2% for AGIs $10k-25k, 2.4% for AGIs $25k-50k, 2.4% for AGIs $50k-75k, 4.1% for AGIs $75k-100k, 4.3% for AGIs over 100k)
Net capital gain/loss: +$35,967 (reported on 23.8% of returns)
Here:
+$35,967
State:
+$27,205
(% of AGI for various income ranges: 10.7% for AGIs below $10k, -0.0% for AGIs $10k-25k, 0.9% for AGIs $25k-50k, 1.3% for AGIs $50k-75k, 3.2% for AGIs $75k-100k, 23.8% for AGIs over 100k)
Profit/loss from business: +$13,290 (reported on 14.3% of returns)
Here:
+$13,290
State:
+$10,634
(% of AGI for various income ranges: 12.8% for AGIs below $10k, 5.7% for AGIs $10k-25k, 3.2% for AGIs $25k-50k, 2.7% for AGIs $50k-75k, 2.7% for AGIs $75k-100k, 2.8% for AGIs over 100k)
IRA payment deduction: $3,079 (reported on 3.0% of returns)
33756:
$3,079
Florida:
$3,082
(% of AGI for various income ranges: 0.6% for AGIs below $10k, 0.2% for AGIs $10k-25k, 0.3% for AGIs $25k-50k, 0.2% for AGIs $50k-75k, 0.2% for AGIs $75k-100k, 0.1% for AGIs over 100k)
Self-employed pension: $17,797 (reported on 0.6% of returns)
Here:
$17,797
Florida:
$15,857
(% of AGI for various income ranges: 0.1% for AGIs $10k-25k, 0.2% for AGIs $50k-75k, 0.3% for AGIs over 100k)
Total itemized deductions: $22,711 (16% of AGI, reported on 28.6% of returns)
Here:
$22,711
State:
$20,370
Here:
16.3% of AGI
State:
20.7% of AGI
(% of AGI for various income ranges: 23.5% for AGIs below $10k, 9.7% for AGIs $10k-25k, 12.3% for AGIs $25k-50k, 12.6% for AGIs $50k-75k, 14.6% for AGIs $75k-100k, 9.4% for AGIs over 100k)
Charity contributions deductions: $8,448 (5% of AGI, reported on 24.2% of returns)
Here:
$8,448
State:
$4,064
Here:
5.4% of AGI
State:
3.8% of AGI
(% of AGI for various income ranges: 1.4% for AGIs below $10k, 1.0% for AGIs $10k-25k, 1.9% for AGIs $25k-50k, 2.2% for AGIs $50k-75k, 2.9% for AGIs $75k-100k, 4.4% for AGIs over 100k)
Total tax: $14,337 (reported on 73.4% of returns)
33756:
$14,337
State:
$9,431
(% of AGI for various income ranges: 6.2% for AGIs below $10k, 4.2% for AGIs $10k-25k, 7.1% for AGIs $25k-50k, 9.6% for AGIs $50k-75k, 11.2% for AGIs $75k-100k, 24.6% for AGIs over 100k)
Earned income credit: $1,660 (reported on 16.8% of returns)
Here:
$1,660
State:
$1,808
Percentage of individuals using paid preparers for their 2004 taxes: 59.3%
Here:
59%
State:
60%
(% for various income ranges: 57.4% for AGIs below $10k, 59.9% for AGIs $10k-25k, 54.7% for AGIs $25k-50k, 57.0% for AGIs $50k-75k, 62.2% for AGIs $75k-100k, 77.7% for AGIs over 100k)
Likely homosexual households (counted as self-reported same-sex unmarried-partner households)
Lesbian couples: 0.2% of all households
Gay men: 0.1% of all households
Household received Food Stamps/SNAP in the past 12 months: 1,911 Household did not receive Food Stamps/SNAP in the past 12 months: 12,066
Women who had a birth in the past 12 months: 495 (153 now married, 319 unmarried) Women who did not have a birth in the past 12 months: 6,607 (2,540 now married, 4,066 unmarried)
Housing units in zip code 33756 with a mortgage: 5,012 (522 second mortgage, 343 both second mortgage and home equity loan) Houses without a mortgage: 166
Median monthly owner costs for units with a mortgage: $1,673 Median monthly owner costs for units without a mortgage: $646
Residents with income below the poverty level in 2022:
This zip code:
15.8%
Whole state:
12.7%
Residents with income below 50% of the poverty level in 2022:
This zip code:
7.9%
Whole state:
6.6%
Median number of rooms in houses and condos:
Here:
5.8
State:
5.9
Median number of rooms in apartments:
Here:
3.9
State:
4.2
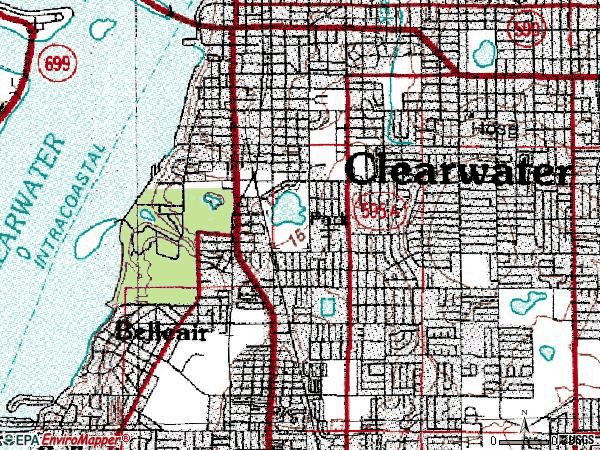
Notable locations in this zip code not listed on our city pages
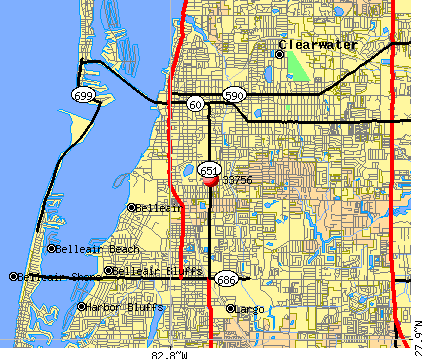
Notable locations in zip code 33756: Gulf-to-Bay Plaza (A), Imperial Square (B), Cleveland Plaza (C), Drew Plaza (D), Enterprise Center (E), Village Square at Belleaireast (F), Clearwater Fire and Rescue Station 45 (G), Clearwater Fire and Rescue Station 47 (H), Dimmitt Community Center (I), Clearwater Police Department Headquarters District 2 Station (J), Belleair Police Department (K), Clearwater Police Department Bicycle Team Patrol Office (L), Clearwater Police Department North Greenwood Patrol Office (M), Clearwater Police Department South Greenwood Patrol Office (N). Display/hide their locations on the map
Shopping Centers: Marshalls Home Depot Shopping Center (1), Bellair Cove Shopping Center (2), Bay Area Outlet Mall (3), Allens Creek Shopping Center (4), Clearwater Mall (5). Display/hide their locations on the map
Churches in zip code 33756 include: First Assembly of God Church (A), First United Methodist Church of Clearwater (B), Flowing River Church (C), Missouri Avenue Baptist Church (D), Pillar of Faith Deliverance Church (E), Seventh Day Adventist Church (F), Lakeview Church (G), Highland Church (H), Woodlawn Church of God (I). Display/hide their locations on the map
Parks in zip code 33756 include: Ann Circle Park (1), David Martin Soccer Field (2), Glen Oaks Park (3), Memorial Parks 1 and 2 (4), Missouri Avenue (5), Ross Norton Recreation Complex (6), Hunter Park (7), Gardenia Park (8), Grass Plot (9). Display/hide their locations on the map
2,580 married couples with children.
2,363 single-parent households (1,102 men, 1,261 women).
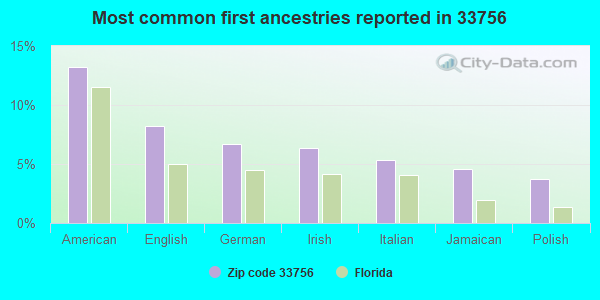
80.9% of residents of 33756 zip code speak English at home.
11.8% of residents speak Spanish at home (56% very well, 19% well, 11% not well, 13% not at all).
5.9% of residents speak other Indo-European language at home (66% very well, 20% well, 11% not well, 3% not at all).
0.8% of residents speak Asian or Pacific Island language at home (91% very well, 6% well, 3% not well).
0.7% of residents speak other language at home (97% very well, 3% well).
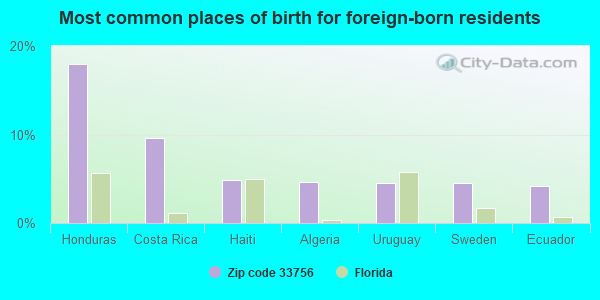
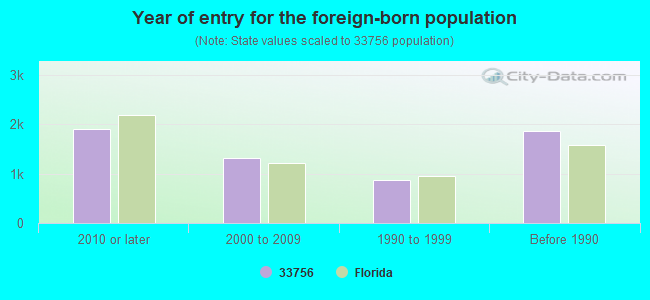
Foreign born population: 5,073 (15.1%) (62.2% of them are naturalized citizens)
Major facilities with environmental interests located in this zip code:
PINELLAS COUNTY PRESSURE CLEANING (1150 GOULD ST in CLEARWATER, FL)
STATE MASTER (FDM) - CHAZ-FLR000122218, HAZARDOUS WASTE REGULATION PROGRAM (Resource Conservation and Recovery Act (tracking hazardous waste)) Business SIC classification: BUILDING CLEANING AND MAINTENANCE SERVICES Organizations: MARY ROGERO (CONTACT/OWNER)
Alternative names: PINELLAS CO PRESSURE CLEANING
PINELLAS CO WATER SYSTEM (310 COURT STREET in CLEARWATER, FL)
(Integrated Compliance Information System) - ICIS-04-1987-0016, FORMAL ENFORCEMENT ACTION (Resource Conservation and Recovery Act (tracking hazardous waste)) Business SIC classification: WATER SUPPLY Organizations: AUTHUR FINNEY, DIRECTOR (CONTACT/OWNER)
ACCURATE AUTOMOTIVE REPAIR (1266 COURT ST in CLEARWATER, FL)
AIR MINOR (AIRS/AFS) (Integrated Compliance Information System) - ICIS-04-1999-0069, FORMAL ENFORCEMENT ACTION Business SIC classification: GENERAL AUTOMOTIVE REPAIR SHOPS
PONCE DE LEON ELEMENTARY SCHOOL (1301 PONCE DE LEON BLVD. in CLEARWATER, FL)
(National Center for Education Statistics) - STATE ID-3461 Organizations: PINELLAS COUNTY SCHOOL DISTRICT (SCHOOL DISTRICT)
SOUTH WARD ELEMENTARY SCHOOL (610 S. FORT HARRISON AVE. in CLEARWATER, FL)
(National Center for Education Statistics) - STATE ID-4281 Organizations: PINELLAS COUNTY SCHOOL DISTRICT (SCHOOL DISTRICT)
OLSON TIRE TOTAL CAR CARE INC (500 S MISSOURI AVENUE in CLEARWATER, FL)
AIR MINOR (AIRS/AFS) Small Quantity Generators, between 100 kg and 1000 kg of hazardous waste/month (Resource Conservation and Recovery Act (tracking hazardous waste)) - notification Business SIC classification: TIRES AND TUBES Organizations: KERWIN, THOMAS MGR (CONTACT/OWNER)
Alternative names: DON OLSON FIRESTONE
LARRY DIMMITT SUBARU (1715 SOUTH MISSOURI AVE in CLEARWATER, FL)
(Resource Conservation and Recovery Act (tracking hazardous waste)) Organizations: ETZRODT HANS, SV MGR (CONTACT/OWNER)
AMP INC (1285 S FORT HARRISON AVE in CLEARWATER, FL)
(Resource Conservation and Recovery Act (tracking hazardous waste))
AMSOUTH BANK - CLEARWATER (715 S FORT HARRISON AVE in CLEARWATER, FL)
National Pollutant Discharge Elimination System NON-MAJOR (Tracking pollutant discharge elimination systems) - permit Organizations: GREGORY HARRIS (CONTACT/OWNER)
KAHLMEYER BROS INC (924 PIERCE ST in CLEARWATER, FL)
(Resource Conservation and Recovery Act (tracking hazardous waste)) Organizations: JAMES KAHLMEYER, PRES (CONTACT/OWNER)
KEENE ROAD IA (GULF TO BAY TO (SEC 1, 2, 11-14, TWNSP 29S, RA in CLEARWATER, FL)
National Pollutant Discharge Elimination System NON-MAJOR (Tracking pollutant discharge elimination systems) - permit Organizations: JAN HERBST (CONTACT/OWNER)
HALLMARK ENTERPRISES INC (909 HOWARD STREET in CLEARWATER, FL)
(Resource Conservation and Recovery Act (tracking hazardous waste)) Organizations: GARY LLOYD, GENERAL MANAGER (CONTACT/OWNER)
LARGO BODY SHOP (1655 S MISSOURI AVE in CLEARWATER, FL)
(Resource Conservation and Recovery Act (tracking hazardous waste)) Organizations: JASMIN RICHARD (CONTACT/OWNER)
Housing units lacking complete plumbing facilities: 0.5% Housing units lacking complete kitchen facilities: 1.3%
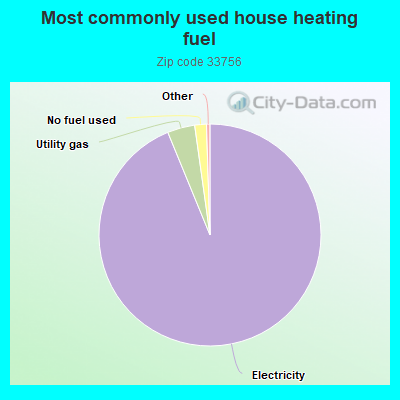
93.8%Electricity
4.0%Utility gas
1.7%No fuel used
Place of birth for U.S.-born residents:
This state: 11,766
Northeast: 6,479
Midwest: 4,498
South: 3,475
West: 1,236
55% of the 33756 zip code residents lived in the same house 5 years ago. Out of people who lived in different houses, 64% lived in this county. Out of people who lived in different counties, 50% lived in Florida.
86% of the 33756 zip code residents lived in the same house 1 year ago. Out of people who lived in different houses, 56% moved from this county. Out of people who lived in different houses, 16% moved from different county within same state. Out of people who lived in different houses, 22% moved from different state. Out of people who lived in different houses, 0% moved from abroad.
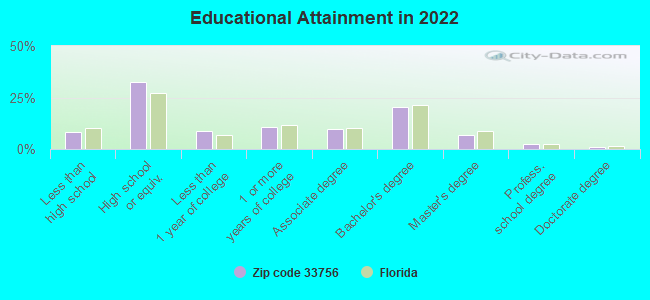
Private vs. public school enrollment:
Students in private schools in grades 1 to 8 (elementary and middle school): 479
Here:
18.2%
Florida:
15.8%
Students in private schools in grades 9 to 12 (high school): 129
Here:
11.2%
Florida:
12.9%
Students in private undergraduate colleges: 351
Here:
27.5%
Florida:
23.6%
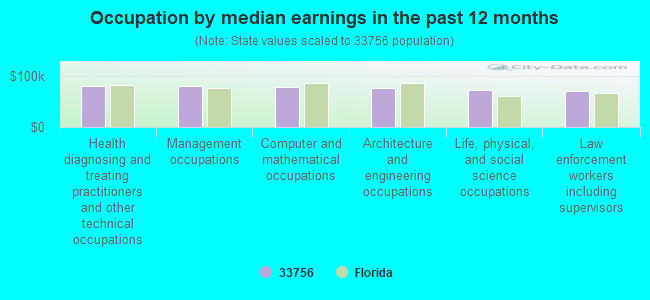
Occupation by median earnings in the past 12 months ($)
80,788Health diagnosing and treating practitioners and other technical occupations
80,139Management occupations
78,268Computer and mathematical occupations
77,679Architecture and engineering occupations
73,066Life, physical, and social science occupations
71,243Law enforcement workers including supervisors
Companies with federal contracts located in this zip code (CLEARWATER, FL):
RETAIL ASSET MANAGEMENT (1801 SOUTH KEENE ROAD; small business) : $531,965 in 35 contractsfrom 2002 to 2006
Contracts for Lease or Rental of Facilities -- Office Buildings by Public Buildings Service Signed by year:2000: $0; 2001: $0; 2002: $27,000; 2003: $178,205; 2004: $89,484; 2005: $109,512; 2006: $127,764.
Biggest contracts:
$27,000 with Public Buildings Service for Lease or Rental of Facilities -- Office Buildings. Signed on 2002-09-15. Completion date: 2002-09-15.
$26,801, same as above.Signed on 2003-09-15. Completion date: 2003-09-15.
$26,801, same as above.Signed on 2003-06-15. Completion date: 2003-06-15.
$26,660, same as above.Signed on 2003-09-15. Completion date: 2003-09-15.
AVXA INC (515 SOUTH ML KING AVE; small business) : $350,154 in 10 contractsfrom 2004 to 2005
Contracts for Motor Freight, Storage Tanks, Maintenance, Repair and Rebuilding of Equipment -- Instruments and Laboratory Equipment by U.S. Army Corps of Engineers - civil program financing only, Army, Navy Signed by year:2000: $0; 2001: $0; 2002: $0; 2003: $0; 2004: $312,780; 2005: $37,374; 2006: $0.
Biggest contracts:
$148,799 with U.S. Army Corps of Engineers - civil program financing only for Motor Freight. Taking place in SD. Signed on 2004-08-09. Completion date: 2004-09-30.
$148,799 with Army for Motor Freight. Taking place in SD. Signed on 2004-08-09. Completion date: 2004-09-30.
$23,749 with Navy for Storage Tanks. Signed on 2005-11-08. Completion date: 2005-11-23.
$13,625, same as above.Signed on 2005-11-30. Completion date: 2005-11-23.
ENGLANDER ENTERPRISES INC (703 GRAND CENTRAL ST; small business) : $324,952 in 6 contractsfrom 2003 to 2006
Contracts for Miscellaneous Electrical and Electronic Components, Converters, Electrical, Nonrotating by Army, Defense Logistics Agency Signed by year:2000: $0; 2001: $0; 2002: $0; 2003: $72,940; 2004: $0; 2005: $179,392; 2006: $72,620.
Biggest contracts:
$169,792 with Army for Miscellaneous Electrical and Electronic Components. Signed on 2005-06-27. Completion date: 2005-11-18.
$72,940, same as above.Signed on 2003-09-18. Completion date: 2004-06-30.
$59,820, same as above.Signed on 2006-03-17. Completion date: 2009-09-30.
$12,800 with Defense Logistics Agency for Converters, Electrical, Nonrotating. Signed on 2006-01-16. Completion date: 2006-06-02.
AIRFLOW ENGINEERED SYSTEMS, IN (1433 S FORT HARRISON AVE,; small business) : $198,307 in 8 contractsfrom 2002 to 2006
Contracts for Clean Work Stations, Controlled Environment and Related Equipment, Sawmill and Planing Mill Machinery, Aircraft Ground Servicing Equipment, Miscellaneous Special Industry Machinery, and moreby Air Force, Navy, Army Signed by year:2000: $0; 2001: $0; 2002: $26,255; 2003: $0; 2004: $101,663; 2005: $36,987; 2006: $33,402.
Biggest contracts:
$60,047 with Air Force for Clean Work Stations, Controlled Environment and Related Equipment. Signed on 2004-09-10. Completion date: 2004-10-15.
$37,794 with Navy for Sawmill and Planing Mill Machinery. Taking place in VA. Signed on 2004-09-02. Completion date: 2004-09-30.
$33,402 with Air Force for Aircraft Ground Servicing Equipment. Signed on 2006-06-28. Completion date: 2006-08-04.
$33,280 with Navy for Miscellaneous Special Industry Machinery. Signed on 2005-03-04. Completion date: 2005-03-31.
MIRAGE TECHNOLOGIES INTERNATIO (1220 ROGERS STREET; small business) : $175,833 in 6 contractsfrom 2002 to 2005
Contracts for Miscellaneous Weapons, X-Ray Equipment and Supplies: Medical, Dental, Veterinary, Individual Equipment, Miscellaneous Alarm, Signal and Security Detection Systems, and moreby Navy, Air Force Signed by year:2000: $0; 2001: $0; 2002: $31,610; 2003: $0; 2004: $122,785; 2005: $21,438; 2006: $0.
Biggest contracts:
$81,784 with Navy for Miscellaneous Weapons. Signed on 2004-07-16. Completion date: 2004-07-29.
$31,610 with Air Force for X-Ray Equipment and Supplies: Medical, Dental, Veterinary. Signed on 2002-03-13. Completion date: 2002-04-13.
$31,200 with Air Force for Individual Equipment. Signed on 2004-01-08. Completion date: 2004-01-13.
$11,468 with Air Force for Miscellaneous Alarm, Signal and Security Detection Systems. Signed on 2005-03-03. Completion date: 2005-04-04.
BELLEVIEW BILTMORE RESORT LTD (25 BELLEVIEW BLVD)
$20,500 with Army for Lodging - Hotel/Motel. Signed on 2005-07-08. Completion date: 2005-08-23.
DYNASYS TECHNOLOGIES INC (800 BELLEAIR RD; small business) : $18,106 in 2 contractsin 2004
$10,985 with Army for Electrical and Electronic assemblies, Boards, Cards, and Associated Hardware. Signed on 2004-09-24. Completion date: 2004-10-22.
$7,121 with Geological Survey for Antennas, Waveguides, and Related Equipment. Signed on 2004-04-12. Completion date: 2004-04-12.
J&M OF OLDSMAR INC (1424 S MISSOURI AVE; small business)
$8,708 with Air Force for Miscellaneous Items. Signed on 2005-09-19. Completion date: 2005-11-18.
RIBBONAIRE INC (1668 EDEN CT; small business)
$6,970 with Navy for Cartridge and Propellant Actuated Devices and Components. Signed on 2005-02-16. Completion date: 2005-03-31.
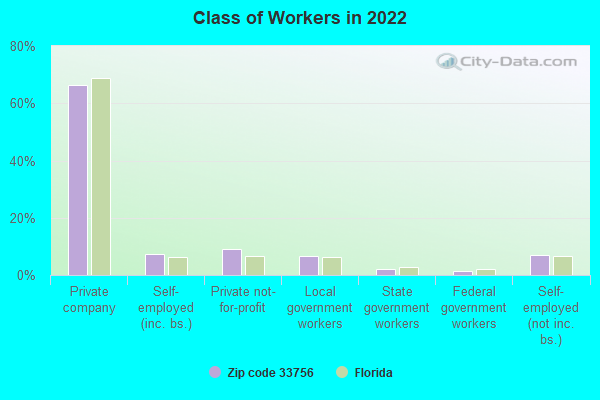
Top industries in this zip code by the number of employees in 2005:
Health Care and Social Assistance: Offices of Physicians (except Mental Health Specialists) (100-249 employees: 3 establishments, 50-99 employees: 4 establishments, 20-49 employees: 11 establishments, 10-19 employees: 20 establishments, 5-9 employees: 39 establishments, 1-4 employees: 51 establishments)
Management of Companies and Enterprises: Corporate, Subsidiary, and Regional Managing Offices (over 1000: 1, 50-99: 2, 5-9: 2, 1-4: 1)
Other Services (except Public Administration): Grantmaking Foundations (over 1000: 1, 1-4: 1)
Health Care and Social Assistance: General Medical and Surgical Hospitals (over 1000: 1)
Health Care and Social Assistance: Nursing Care Facilities (100-249: 4, 20-49: 1)
Accommodation and Food Services: Hotels (except Casino Hotels) and Motels (250-499: 1, 10-19: 1, 5-9: 1)
Administrative and Support and Waste Management and Remediation Services: Professional Employer Organizations (250-499: 1, 1-4: 2)
Professional, Scientific, and Technical Services: Offices of Lawyers (20-49: 4, 10-19: 2, 5-9: 10, 1-4: 61)
Other Services (except Public Administration): Religious Organizations (50-99: 1, 20-49: 5, 10-19: 1, 5-9: 4, 1-4: 7)
People in group quarters in 2010:
585 people in nursing facilities/skilled-nursing facilities
333 people in emergency and transitional shelters (with sleeping facilities) for people experiencing homelessness
295 people in other noninstitutional facilities
56 people in workers' group living quarters and job corps centers
44 people in group homes intended for adults
9 people in group homes for juveniles (non-correctional)
People in group quarters in 2000:
756 people in nursing homes
307 people in other noninstitutional group quarters
20 people in mental (psychiatric) hospitals or wards
9 people in other group homes
6 people in religious group quarters
Fatal accident statistics in 2014:
Fatal accident count: 2
Vehicles involved in fatal accidents: 3
Fatal accidents caused by drunken drivers: 1
Fatalities: 2
Persons involved in fatal accidents: 3
Pedestrians involved in fatal accidents: 1
Fatal accident statistics in 2013:
Fatal accident count: 5
Vehicles involved in fatal accidents: 6
Fatal accidents caused by drunken drivers: 1
Fatalities: 5
Persons involved in fatal accidents: 6
Pedestrians involved in fatal accidents: 3
Home Mortgage Disclosure Act Aggregated Statistics For Year 2009 (Based on 5 full and 14 partial tracts)
A) FHA, FSA/RHS & VA Home Purchase Loans
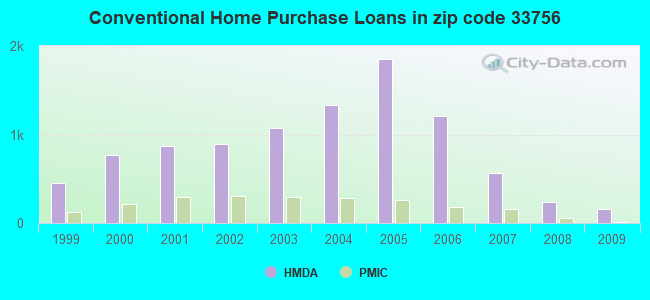
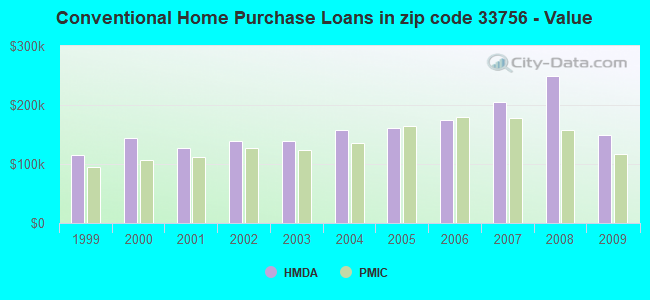
B) Conventional Home Purchase Loans
C) Refinancings
D) Home Improvement Loans
E) Loans on Dwellings For 5+ Families
F) Non-occupant Loans on < 5 Family Dwellings (A B C & D)
G) Loans On Manufactured Home Dwelling (A B C & D)
Number
Average Value
Number
Average Value
Number
Average Value
Number
Average Value
Number
Average Value
Number
Average Value
Number
Average Value
LOANS ORIGINATED
184
$136,208
154
$149,703
378
$178,493
42
$47,717
0
$0
75
$164,836
2
$28,740
APPLICATIONS APPROVED, NOT ACCEPTED
9
$151,531
6
$124,858
60
$208,613
4
$11,395
1
$23,434,440
3
$282,443
0
$0
APPLICATIONS DENIED
27
$126,848
52
$140,751
206
$198,506
30
$45,397
0
$0
37
$136,165
4
$40,290
APPLICATIONS WITHDRAWN
30
$125,922
23
$231,844
140
$209,513
8
$128,180
0
$0
19
$180,092
0
$0
FILES CLOSED FOR INCOMPLETENESS
8
$122,179
8
$182,568
30
$203,252
5
$237,396
0
$0
6
$220,612
0
$0
Aggregated Statistics For Year 2008 (Based on 5 full and 14 partial tracts)
A) FHA, FSA/RHS & VA Home Purchase Loans
B) Conventional Home Purchase Loans
C) Refinancings
D) Home Improvement Loans
E) Loans on Dwellings For 5+ Families
F) Non-occupant Loans on < 5 Family Dwellings (A B C & D)
G) Loans On Manufactured Home Dwelling (A B C & D)
Number
Average Value
Number
Average Value
Number
Average Value
Number
Average Value
Number
Average Value
Number
Average Value
Number
Average Value
LOANS ORIGINATED
111
$160,895
235
$249,603
435
$218,433
73
$94,930
9
$665,041
161
$196,955
1
$68,980
APPLICATIONS APPROVED, NOT ACCEPTED
8
$173,810
35
$223,852
116
$245,558
24
$70,433
0
$0
31
$165,248
0
$0
APPLICATIONS DENIED
30
$164,646
106
$152,060
451
$210,150
76
$106,266
3
$228,807
107
$160,146
18
$44,612
APPLICATIONS WITHDRAWN
17
$173,194
51
$402,058
154
$337,991
19
$143,568
3
$717,420
33
$166,892
2
$43,535
FILES CLOSED FOR INCOMPLETENESS
4
$157,878
20
$771,238
50
$223,817
2
$34,080
0
$0
18
$167,259
0
$0
Aggregated Statistics For Year 2007 (Based on 5 full and 14 partial tracts)
A) FHA, FSA/RHS & VA Home Purchase Loans
B) Conventional Home Purchase Loans
C) Refinancings
D) Home Improvement Loans
E) Loans on Dwellings For 5+ Families
F) Non-occupant Loans on < 5 Family Dwellings (A B C & D)
G) Loans On Manufactured Home Dwelling (A B C & D)
Number
Average Value
Number
Average Value
Number
Average Value
Number
Average Value
Number
Average Value
Number
Average Value
Number
Average Value
LOANS ORIGINATED
28
$171,851
565
$205,637
1,094
$188,465
156
$89,776
23
$1,544,447
325
$225,166
5
$48,476
APPLICATIONS APPROVED, NOT ACCEPTED
4
$165,408
83
$193,965
242
$196,785
32
$86,406
3
$870,150
66
$157,193
9
$94,519
APPLICATIONS DENIED
5
$192,368
186
$196,528
798
$194,407
137
$98,916
4
$324,215
179
$188,779
13
$112,668
APPLICATIONS WITHDRAWN
4
$144,890
59
$175,704
353
$197,076
34
$82,513
3
$545,450
54
$150,663
0
$0
FILES CLOSED FOR INCOMPLETENESS
2
$195,315
27
$152,663
95
$182,097
13
$307,755
1
$5,324,800
13
$160,377
0
$0
Aggregated Statistics For Year 2006 (Based on 5 full and 14 partial tracts)
A) FHA, FSA/RHS & VA Home Purchase Loans
B) Conventional Home Purchase Loans
C) Refinancings
D) Home Improvement Loans
E) Loans on Dwellings For 5+ Families
F) Non-occupant Loans on < 5 Family Dwellings (A B C & D)
G) Loans On Manufactured Home Dwelling (A B C & D)
Number
Average Value
Number
Average Value
Number
Average Value
Number
Average Value
Number
Average Value
Number
Average Value
Number
Average Value
LOANS ORIGINATED
37
$170,892
1,211
$174,245
1,498
$187,405
207
$111,983
23
$651,543
652
$169,126
10
$47,635
APPLICATIONS APPROVED, NOT ACCEPTED
0
$0
191
$173,180
264
$156,769
49
$128,170
5
$200,704
92
$167,423
8
$43,725
APPLICATIONS DENIED
8
$146,231
358
$178,090
749
$198,166
170
$90,623
2
$55,375
251
$231,963
9
$61,943
APPLICATIONS WITHDRAWN
5
$152,000
136
$159,124
518
$162,228
61
$99,001
2
$385,630
105
$169,431
1
$180,810
FILES CLOSED FOR INCOMPLETENESS
0
$0
54
$172,058
196
$176,812
14
$105,479
3
$601,237
39
$154,850
0
$0
Aggregated Statistics For Year 2005 (Based on 5 full and 14 partial tracts)
A) FHA, FSA/RHS & VA Home Purchase Loans
B) Conventional Home Purchase Loans
C) Refinancings
D) Home Improvement Loans
E) Loans on Dwellings For 5+ Families
F) Non-occupant Loans on < 5 Family Dwellings (A B C & D)
G) Loans On Manufactured Home Dwelling (A B C & D)
Number
Average Value
Number
Average Value
Number
Average Value
Number
Average Value
Number
Average Value
Number
Average Value
Number
Average Value
LOANS ORIGINATED
30
$148,996
1,854
$160,454
1,519
$159,581
174
$122,212
26
$881,935
906
$143,548
11
$67,255
APPLICATIONS APPROVED, NOT ACCEPTED
7
$133,014
202
$170,080
245
$156,865
33
$85,417
0
$0
81
$136,961
6
$35,423
APPLICATIONS DENIED
6
$131,235
430
$164,158
728
$152,462
132
$68,613
0
$0
196
$134,438
12
$58,616
APPLICATIONS WITHDRAWN
4
$126,275
207
$178,446
573
$158,773
74
$173,871
0
$0
97
$156,100
3
$49,813
FILES CLOSED FOR INCOMPLETENESS
0
$0
50
$164,365
284
$156,632
16
$70,768
0
$0
39
$171,302
0
$0
Aggregated Statistics For Year 2004 (Based on 5 full and 14 partial tracts)
A) FHA, FSA/RHS & VA Home Purchase Loans
B) Conventional Home Purchase Loans
C) Refinancings
D) Home Improvement Loans
E) Loans on Dwellings For 5+ Families
F) Non-occupant Loans on < 5 Family Dwellings (A B C & D)
G) Loans On Manufactured Home Dwelling (A B C & D)
Number
Average Value
Number
Average Value
Number
Average Value
Number
Average Value
Number
Average Value
Number
Average Value
Number
Average Value
LOANS ORIGINATED
90
$125,457
1,331
$157,370
1,443
$136,876
173
$70,404
25
$1,399,378
580
$141,135
11
$27,989
APPLICATIONS APPROVED, NOT ACCEPTED
0
$0
158
$144,279
281
$134,769
31
$49,276
1
$321,360
79
$132,759
14
$22,339
APPLICATIONS DENIED
9
$131,938
273
$145,470
738
$120,583
156
$47,427
2
$367,860
165
$139,473
23
$44,444
APPLICATIONS WITHDRAWN
12
$112,935
158
$131,419
414
$145,081
53
$63,158
2
$383,685
81
$133,265
0
$0
FILES CLOSED FOR INCOMPLETENESS
3
$135,190
48
$108,095
323
$133,786
21
$95,681
0
$0
24
$122,140
3
$136,943
Aggregated Statistics For Year 2003 (Based on 5 full and 14 partial tracts)
A) FHA, FSA/RHS & VA Home Purchase Loans
B) Conventional Home Purchase Loans
C) Refinancings
D) Home Improvement Loans
E) Loans on Dwellings For 5+ Families
F) Non-occupant Loans on < 5 Family Dwellings (A B C & D)
Number
Average Value
Number
Average Value
Number
Average Value
Number
Average Value
Number
Average Value
Number
Average Value
LOANS ORIGINATED
140
$121,414
1,073
$138,944
2,729
$129,122
83
$41,001
16
$492,933
534
$104,442
APPLICATIONS APPROVED, NOT ACCEPTED
2
$138,515
90
$178,526
386
$110,349
44
$36,737
0
$0
51
$94,182
APPLICATIONS DENIED
18
$97,925
222
$116,216
999
$115,608
124
$34,497
0
$0
134
$110,680
APPLICATIONS WITHDRAWN
5
$119,642
132
$125,740
412
$114,878
18
$52,117
2
$1,085,965
49
$90,128
FILES CLOSED FOR INCOMPLETENESS
4
$89,220
28
$125,829
129
$107,459
7
$56,514
0
$0
17
$81,960
Aggregated Statistics For Year 2002 (Based on 5 full and 14 partial tracts)
A) FHA, FSA/RHS & VA Home Purchase Loans
B) Conventional Home Purchase Loans
C) Refinancings
D) Home Improvement Loans
E) Loans on Dwellings For 5+ Families
F) Non-occupant Loans on < 5 Family Dwellings (A B C & D)
Number
Average Value
Number
Average Value
Number
Average Value
Number
Average Value
Number
Average Value
Number
Average Value
LOANS ORIGINATED
187
$105,077
894
$138,570
1,735
$124,935
153
$46,119
21
$730,680
361
$108,014
APPLICATIONS APPROVED, NOT ACCEPTED
4
$105,878
81
$107,169
324
$114,781
50
$30,154
0
$0
59
$75,369
APPLICATIONS DENIED
27
$102,854
160
$103,943
710
$92,273
148
$29,993
4
$276,775
105
$115,288
APPLICATIONS WITHDRAWN
21
$110,888
77
$153,890
340
$116,340
18
$37,728
2
$412,480
31
$84,729
FILES CLOSED FOR INCOMPLETENESS
5
$109,302
21
$96,567
166
$113,437
2
$42,405
0
$0
8
$133,769
Aggregated Statistics For Year 2001 (Based on 5 full and 14 partial tracts)
A) FHA, FSA/RHS & VA Home Purchase Loans
B) Conventional Home Purchase Loans
C) Refinancings
D) Home Improvement Loans
E) Loans on Dwellings For 5+ Families
F) Non-occupant Loans on < 5 Family Dwellings (A B C & D)
Number
Average Value
Number
Average Value
Number
Average Value
Number
Average Value
Number
Average Value
Number
Average Value
LOANS ORIGINATED
225
$96,970
865
$127,517
1,353
$117,461
156
$34,266
9
$1,505,944
261
$98,293
APPLICATIONS APPROVED, NOT ACCEPTED
2
$90,135
95
$133,098
206
$89,962
34
$36,321
2
$429,955
37
$65,585
APPLICATIONS DENIED
16
$89,697
163
$96,001
681
$83,762
150
$25,283
2
$217,555
66
$78,956
APPLICATIONS WITHDRAWN
12
$80,218
97
$140,518
337
$122,424
51
$32,537
0
$0
29
$78,224
FILES CLOSED FOR INCOMPLETENESS
6
$78,353
28
$131,223
117
$116,821
4
$30,288
0
$0
8
$99,294
Aggregated Statistics For Year 2000 (Based on 5 full and 14 partial tracts)
A) FHA, FSA/RHS & VA Home Purchase Loans
B) Conventional Home Purchase Loans
C) Refinancings
D) Home Improvement Loans
E) Loans on Dwellings For 5+ Families
F) Non-occupant Loans on < 5 Family Dwellings (A B C & D)
Number
Average Value
Number
Average Value
Number
Average Value
Number
Average Value
Number
Average Value
Number
Average Value
LOANS ORIGINATED
241
$83,162
767
$143,562
424
$76,476
174
$22,190
4
$199,185
195
$93,362
APPLICATIONS APPROVED, NOT ACCEPTED
4
$66,185
112
$115,541
98
$63,928
72
$34,500
0
$0
32
$75,239
APPLICATIONS DENIED
17
$76,998
195
$135,740
350
$64,513
150
$27,993
2
$272,310
71
$76,419
APPLICATIONS WITHDRAWN
20
$89,614
84
$122,535
215
$68,819
35
$50,077
0
$0
20
$65,042
FILES CLOSED FOR INCOMPLETENESS
9
$104,977
44
$137,624
66
$72,778
4
$54,508
0
$0
17
$121,438
Aggregated Statistics For Year 1999 (Based on 3 full and 7 partial tracts)
A) FHA, FSA/RHS & VA Home Purchase Loans
B) Conventional Home Purchase Loans
C) Refinancings
D) Home Improvement Loans
E) Loans on Dwellings For 5+ Families
F) Non-occupant Loans on < 5 Family Dwellings (A B C & D)
2002 - 2018 National Fire Incident Reporting System (NFIRS) incidents
Based on the data from the years 2002 - 2018 the average number of fires per year is 126. The highest number of reported fire incidents - 271 took place in 2005, and the least - 65 in 2017. The data has a declining trend.
When looking into fire subcategories, the most reports belonged to: Structure Fires (42.3%), and Outside Fires (30.3%).
Fire incident types reported to NFIRS in Zip Code 33756


 Nearest zip codes: 33770, 33755, 33786, 33767, 33771, 33764.
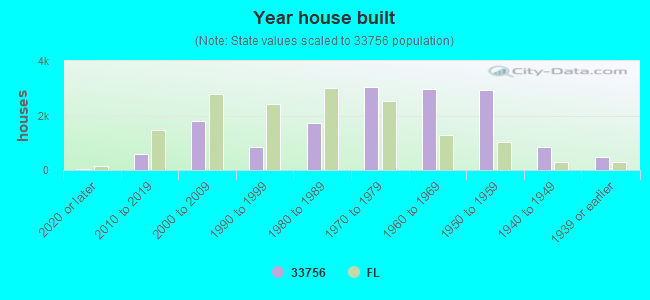


 Based on the data from the years 2002 - 2018 the average number of fires per year is 126. The highest number of reported fire incidents - 271 took place in 2005, and the least - 65 in 2017. The data has a declining trend.
 When looking into fire subcategories, the most reports belonged to: Structure Fires (42.3%), and Outside Fires (30.3%).