Estimated zip code population in 2022: 11,094 Zip code population in 2010: 11,093 Zip code population in 2000: 10,668
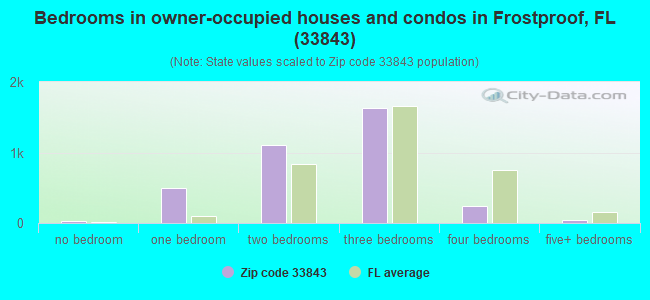
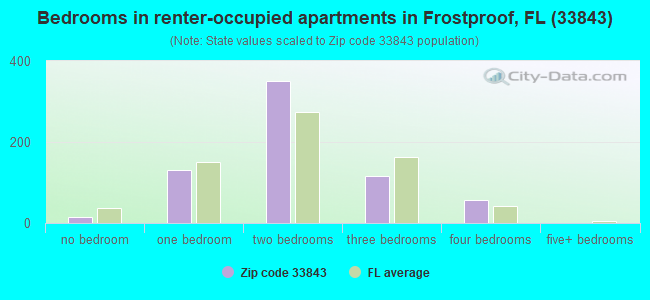
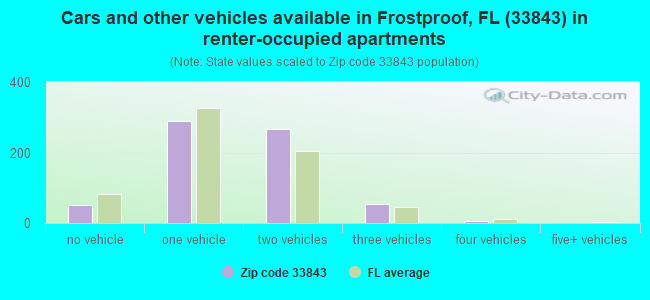
Houses and condos: 6,024 Renter-occupied apartments: 670
% of renters here:
16%
State:
33%
March 2022 cost of living index in zip code 33843: 84.1 (less than average, U.S. average is 100)
Land area: 102.2 sq. mi. Water area: 14.4 sq. mi.
Population density: 109 people per square mile
(very low).
OSM Map
General Map
Google Map
MSN Map
OSM Map
General Map
Google Map
MSN Map
OSM Map
General Map
Google Map
MSN Map
OSM Map
General Map
Google Map
MSN Map
Please wait while loading the map...
Real estate property taxes paid for housing units in 2022:
This zip code:
0.9% ($1,070)
Florida:
0.7% ($2,529)
Median real estate property taxes paid for housing units with mortgages in 2022: $1,600 (0.8%) Median real estate property taxes paid for housing units with no mortgage in 2022: $869 (1.0%)
Averages for the 2020 tax year for zip code 33843, filed in 2021:
Average Adjusted Gross Income (AGI) in 2020: $45,018 (Individual Income Tax Returns)
Here:
$45,018
State:
$82,200
Salary/wage: $38,777 (reported on 74.0% of returns)
Here:
$38,777
State:
$58,347
(% of AGI for various income ranges: 1154.8% for AGIs below $25k, 3400.4% for AGIs $25k-50k, 5890.7% for AGIs $50k-75k, 8973.2% for AGIs $75k-100k, 13511.2% for AGIs $100k-200k)
Taxable interest for individuals: $2,681 (reported on 17.7% of returns)
This zip code:
$2,681
Florida:
$4,272
(% of AGI for various income ranges: 14.3% for AGIs below $25k, 18.6% for AGIs $25k-50k, 53.1% for AGIs $50k-75k, 64.7% for AGIs $75k-100k, 244.7% for AGIs $100k-200k)
Ordinary dividends: $5,635 (reported on 11.5% of returns)
Here:
$5,635
State:
$15,863
(% of AGI for various income ranges: 13.5% for AGIs below $25k, 32.8% for AGIs $25k-50k, 88.3% for AGIs $50k-75k, 100.5% for AGIs $75k-100k, 448.2% for AGIs $100k-200k)
Net capital gain/loss in AGI: +$19,474 (reported on 9.3% of returns)
Here:
+$19,474
State:
+$62,983
(% of AGI for various income ranges: 10.4% for AGIs below $25k, 19.5% for AGIs $25k-50k, 42.1% for AGIs $50k-75k, 178.4% for AGIs $75k-100k, 562.4% for AGIs $100k-200k)
Profit/loss from business: +$8,476 (reported on 13.8% of returns)
Here:
+$8,476
State:
+$9,719
(% of AGI for various income ranges: 153.5% for AGIs below $25k, 85.2% for AGIs $25k-50k, 106.4% for AGIs $50k-75k, 139.5% for AGIs $75k-100k, 784.1% for AGIs $100k-200k)
Taxable individual retirement arrangement distribution: $15,008 (reported on 9.3% of returns)
33843:
$15,008
Florida:
$24,823
(% of AGI for various income ranges: 61.3% for AGIs below $25k, 135.7% for AGIs $25k-50k, 303.3% for AGIs $50k-75k, 436.8% for AGIs $75k-100k, 981.2% for AGIs $100k-200k)
Total itemized deductions: $37,444 (reported on 2.1% of returns)
Here:
$37,444
State:
$45,393
(% of AGI for various income ranges: 74.5% for AGIs $25k-50k, 220.0% for AGIs $50k-75k, 1035.9% for AGIs $100k-200k)
Charity contributions: $13,178 (reported on 2.1% of returns)
Here:
$13,178
State:
$20,178
(% of AGI for various income ranges: 11.5% for AGIs below $25k, 58.3% for AGIs $50k-75k, 461.2% for AGIs $100k-200k)
Taxes paid: $4,344 (reported on 2.1% of returns)
33843:
$4,344
State:
$6,967
(% of AGI for various income ranges: 7.7% for AGIs $25k-50k, 22.6% for AGIs $50k-75k, 132.4% for AGIs $100k-200k)
Earned income credit: $2,643 (reported on 26.5% of returns)
Here:
$2,643
State:
$2,306
(% of AGI for various income ranges: 147.1% for AGIs below $25k, 101.5% for AGIs $25k-50k)
Percentage of individuals using paid preparers for their 2020 taxes: 92.1%
Here:
92%
State:
92%
(% for various income ranges: 91.3% for AGIs below $25k, 93.0% for AGIs $25k-50k, 93.0% for AGIs $50k-75k, 93.1% for AGIs $75k-100k, 92.9% for AGIs $100k-200k, 83.3% for AGIs over 200k)
Averages for the 2012 tax year for zip code 33843, filed in 2013:
Average Adjusted Gross Income (AGI) in 2012: $38,496 (Individual Income Tax Returns)
Here:
$38,496
State:
$60,316
Salary/wage: $30,736 (reported on 77.5% of returns)
Here:
$30,736
State:
$45,277
(% of AGI for various income ranges: 72.2% for AGIs below $25k, 72.6% for AGIs $25k-50k, 66.1% for AGIs $50k-75k, 64.6% for AGIs $75k-100k, 52.7% for AGIs $100k-200k, 30.7% for AGIs over 200k)
Taxable interest for individuals: $2,695 (reported on 24.2% of returns)
This zip code:
$2,695
Florida:
$3,587
(% of AGI for various income ranges: 0.9% for AGIs below $25k, 1.3% for AGIs $25k-50k, 1.4% for AGIs $50k-75k, 0.5% for AGIs $75k-100k, 3.2% for AGIs $100k-200k, 3.4% for AGIs over 200k)
Ordinary dividends: $4,879 (reported on 13.7% of returns)
Here:
$4,879
State:
$12,831
(% of AGI for various income ranges: 1.2% for AGIs below $25k, 1.0% for AGIs $25k-50k, 1.2% for AGIs $50k-75k, 0.8% for AGIs $75k-100k, 1.6% for AGIs $100k-200k, 5.2% for AGIs over 200k)
Net capital gain/loss in AGI: +$8,024 (reported on 10.5% of returns)
Here:
+$8,024
State:
+$33,493
(% of AGI for various income ranges: 0.1% for AGIs below $25k, 0.3% for AGIs $25k-50k, 0.4% for AGIs $50k-75k, 0.4% for AGIs $75k-100k, 3.5% for AGIs $100k-200k, 10.8% for AGIs over 200k)
Profit/loss from business: +$6,319 (reported on 12.3% of returns)
Here:
+$6,319
State:
+$10,012
(% of AGI for various income ranges: 6.8% for AGIs below $25k, 0.9% for AGIs $25k-50k, 1.1% for AGIs $50k-75k, 0.7% for AGIs $75k-100k, 2.1% for AGIs $100k-200k)
Taxable individual retirement arrangement distribution: $14,293 (reported on 12.0% of returns)
33843:
$14,293
Florida:
$21,544
(% of AGI for various income ranges: 4.0% for AGIs below $25k, 4.3% for AGIs $25k-50k, 4.8% for AGIs $50k-75k, 6.1% for AGIs $75k-100k, 8.3% for AGIs $100k-200k)
Total itemized deductions: $22,551 (25% of AGI, reported on 12.8% of returns)
Here:
$22,551
State:
$25,533
Here:
24.9% of AGI
State:
18.0% of AGI
(% of AGI for various income ranges: 4.6% for AGIs below $25k, 6.0% for AGIs $25k-50k, 7.4% for AGIs $50k-75k, 8.0% for AGIs $75k-100k, 7.5% for AGIs $100k-200k, 13.5% for AGIs over 200k)
Charity contributions: $6,106 (reported on 9.4% of returns)
Here:
$6,106
State:
$5,698
(% of AGI for various income ranges: 0.4% for AGIs below $25k, 1.0% for AGIs $25k-50k, 1.2% for AGIs $50k-75k, 1.8% for AGIs $75k-100k, 1.9% for AGIs $100k-200k, 3.5% for AGIs over 200k)
Taxes paid: $3,826 (reported on 12.3% of returns)
33843:
$3,826
State:
$6,203
(% of AGI for various income ranges: 0.7% for AGIs below $25k, 0.8% for AGIs $25k-50k, 1.2% for AGIs $50k-75k, 1.4% for AGIs $75k-100k, 1.8% for AGIs $100k-200k, 2.0% for AGIs over 200k)
Earned income credit: $2,695 (reported on 30.5% of returns)
Here:
$2,695
State:
$2,372
(% of AGI for various income ranges: 9.8% for AGIs below $25k, 1.5% for AGIs $25k-50k)
Percentage of individuals using paid preparers for their 2012 taxes: 46.4%
Here:
46%
State:
54%
(% for various income ranges: 43.9% for AGIs below $25k, 47.3% for AGIs $25k-50k, 47.6% for AGIs $50k-75k, 42.1% for AGIs $75k-100k, 69.2% for AGIs $100k-200k, 75.0% for AGIs over 200k)
Averages for the 2004 tax year for zip code 33843, filed in 2005:
Average Adjusted Gross Income (AGI) in 2004: $35,270 (Individual Income Tax Returns)
Here:
$35,270
State:
$50,523
Salary/wage: $27,419 (reported on 80.1% of returns)
Here:
$27,419
State:
$39,563
(% of AGI for various income ranges: 170.7% for AGIs below $10k, 72.1% for AGIs $10k-25k, 74.2% for AGIs $25k-50k, 67.5% for AGIs $50k-75k, 71.2% for AGIs $75k-100k, 33.1% for AGIs over 100k)
Taxable interest for individuals: $3,479 (reported on 34.7% of returns)
This zip code:
$3,479
Florida:
$3,211
(% of AGI for various income ranges: 13.9% for AGIs below $10k, 2.4% for AGIs $10k-25k, 1.7% for AGIs $25k-50k, 2.2% for AGIs $50k-75k, 3.0% for AGIs $75k-100k, 5.9% for AGIs over 100k)
Taxable dividends: $3,370 (reported on 16.2% of returns)
Here:
$3,370
State:
$6,129
(% of AGI for various income ranges: 4.5% for AGIs below $10k, 0.8% for AGIs $10k-25k, 0.9% for AGIs $25k-50k, 1.0% for AGIs $50k-75k, 1.1% for AGIs $75k-100k, 2.9% for AGIs over 100k)
Net capital gain/loss: +$29,537 (reported on 12.6% of returns)
Here:
+$29,537
State:
+$27,205
(% of AGI for various income ranges: -1.2% for AGIs below $10k, -0.2% for AGIs $10k-25k, 1.6% for AGIs $25k-50k, 1.7% for AGIs $50k-75k, 3.6% for AGIs $75k-100k, 33.5% for AGIs over 100k)
Profit/loss from business: +$7,213 (reported on 11.9% of returns)
Here:
+$7,213
State:
+$10,634
(% of AGI for various income ranges: 5.3% for AGIs below $10k, 3.5% for AGIs $10k-25k, 2.1% for AGIs $25k-50k, 3.7% for AGIs $50k-75k, 1.1% for AGIs $75k-100k, 1.6% for AGIs over 100k)
Profit/loss from farming: +$6,631 (reported on 2.9% of returns)
Here:
+$6,631
State:
-$6,005
(% of AGI for various income ranges: -4.8% for AGIs below $10k, -0.2% for AGIs $10k-25k, -0.5% for AGIs $25k-50k, -0.3% for AGIs $50k-75k, 2.9% for AGIs over 100k)
IRA payment deduction: $3,129 (reported on 2.0% of returns)
33843:
$3,129
Florida:
$3,082
(% of AGI for various income ranges: 0.1% for AGIs $10k-25k, 0.3% for AGIs $25k-50k, 0.3% for AGIs $50k-75k, 0.4% for AGIs $75k-100k)
Total itemized deductions: $18,507 (19% of AGI, reported on 14.7% of returns)
Here:
$18,507
State:
$20,370
Here:
18.7% of AGI
State:
20.7% of AGI
(% of AGI for various income ranges: 10.2% for AGIs below $10k, 4.7% for AGIs $10k-25k, 8.4% for AGIs $25k-50k, 10.7% for AGIs $50k-75k, 9.0% for AGIs $75k-100k, 6.5% for AGIs over 100k)
Charity contributions deductions: $4,625 (4% of AGI, reported on 11.7% of returns)
Here:
$4,625
State:
$4,064
Here:
4.2% of AGI
State:
3.8% of AGI
(% of AGI for various income ranges: 1.1% for AGIs below $10k, 0.7% for AGIs $10k-25k, 1.3% for AGIs $25k-50k, 2.1% for AGIs $50k-75k, 2.2% for AGIs $75k-100k, 1.7% for AGIs over 100k)
Total tax: $5,987 (reported on 61.5% of returns)
33843:
$5,987
State:
$9,431
(% of AGI for various income ranges: 3.8% for AGIs below $10k, 2.6% for AGIs $10k-25k, 5.3% for AGIs $25k-50k, 8.9% for AGIs $50k-75k, 10.8% for AGIs $75k-100k, 20.8% for AGIs over 100k)
Earned income credit: $2,044 (reported on 28.6% of returns)
Here:
$2,044
State:
$1,808
Percentage of individuals using paid preparers for their 2004 taxes: 62.2%
Here:
62%
State:
60%
(% for various income ranges: 59.6% for AGIs below $10k, 63.9% for AGIs $10k-25k, 59.7% for AGIs $25k-50k, 63.5% for AGIs $50k-75k, 61.6% for AGIs $75k-100k, 80.4% for AGIs over 100k)
Likely homosexual households (counted as self-reported same-sex unmarried-partner households)
Lesbian couples: 0.7% of all households
Gay men: 0.0% of all households
Household received Food Stamps/SNAP in the past 12 months: 761 Household did not receive Food Stamps/SNAP in the past 12 months: 3,452
Women who had a birth in the past 12 months: 102 (36 now married, 61 unmarried) Women who did not have a birth in the past 12 months: 1,641 (516 now married, 1,124 unmarried)
Housing units in zip code 33843 with a mortgage: 1,008 (96 second mortgage, 56 both second mortgage and home equity loan) Median monthly owner costs for units with a mortgage: $1,258 Median monthly owner costs for units without a mortgage: $417
Residents with income below the poverty level in 2022:
This zip code:
17.1%
Whole state:
12.7%
Residents with income below 50% of the poverty level in 2022:
This zip code:
9.7%
Whole state:
6.6%
Median number of rooms in houses and condos:
Here:
5.1
State:
5.9
Median number of rooms in apartments:
Here:
4.3
State:
4.2
Notable locations in this zip code not listed on our city pages
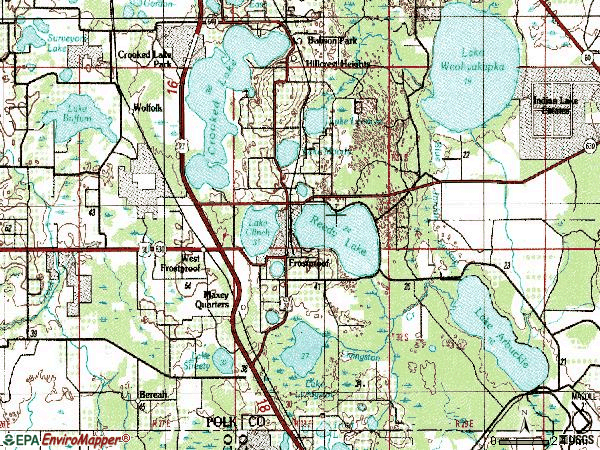
Notable locations in zip code 33843: Frostproof Fire Department Station 1 (A), Polk County Emergency Medical Services Station 4 Frostproof (B), Frostproof Fire Department Station 2 (C), Frostproof Police Department (D), Polk County South County Jail Facility (E), Latt Maxcy Memorial Library (F). Display/hide their locations on the map
Lakes and swamps: Lake Arbuckle (A), Lake Clinch (B), Silver Lake (C), Lake Moody (D), Hickory Lake (E), Lake Ida (F), Lake Streety (G), Reedy Lake (H). Display/hide their locations on the map
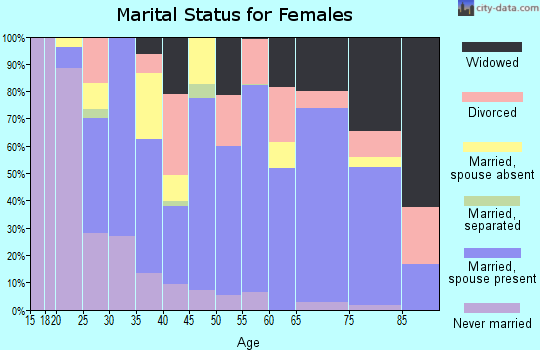
578 married couples with children.
628 single-parent households (360 men, 268 women).
78.9% of residents of 33843 zip code speak English at home.
19.7% of residents speak Spanish at home (63% very well, 20% well, 11% not well, 5% not at all).
0.4% of residents speak other Indo-European language at home (11% very well, 43% well, 46% not well).
0.2% of residents speak Asian or Pacific Island language at home (100% very well).
0.9% of residents speak other language at home (56% very well, 5% well, 38% not well).
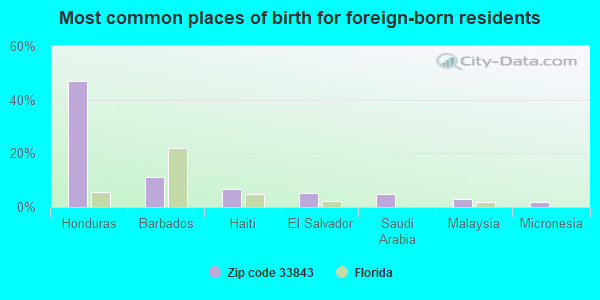
Foreign born population: 940 (8.5%) (42.6% of them are naturalized citizens)
This zip code:
8.5%
Whole state:
21.7%
47%Honduras
11%Barbados
7%Haiti
5%El Salvador
5%Saudi Arabia
3%Malaysia
2%Micronesia
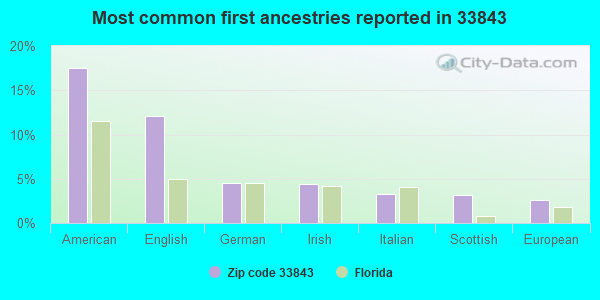
17%American
12%English
4%German
4%Irish
3%Italian
3%Scottish
3%European
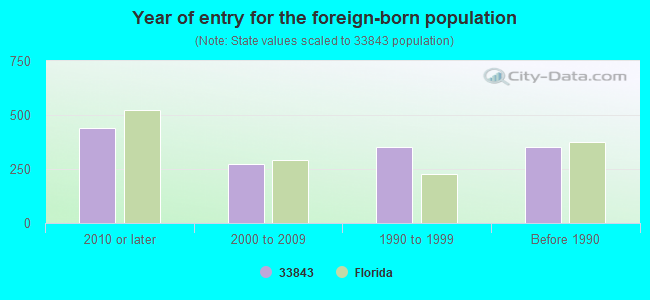
Year of entry for the foreign-born population
4402010 or later
2712000 to 2009
3531990 to 1999
354Before 1990
Facilities with environmental interests located in this zip code:
SOUTH COUNTY CENTER (1103 HIGHWAY 98 WEST in FROSTPROOF, FL)
(National Center for Education Statistics) - STATE ID-9228 Organizations: POLK COUNTY SCHOOL DISTRICT (SCHOOL DISTRICT)
LOWE'S FLATBED DISTRIBUTION CE (NW CORNER OF T.S. WILSON RD. in FROSTPROOF, FL)
National Pollutant Discharge Elimination System NON-MAJOR (Tracking pollutant discharge elimination systems) - permit Organizations: DON WINN (CONTACT/OWNER)
SR 25 (US 27) (FROM HAL MCRAE BLVD TO SR 64 in AVON PARK, FL)
National Pollutant Discharge Elimination System NON-MAJOR (Tracking pollutant discharge elimination systems) - permit Organizations: RICKY LANGLEY (CONTACT/OWNER)
GRIFFIN FORD INC (US HWY 27 ALT & SR 630 in FROSTPROOF, FL)
(Resource Conservation and Recovery Act (tracking hazardous waste)) Organizations: BRUCE DEARDOFF (CONTACT/OWNER)
KENS AUTO SHOP (51 SR 630A in FROSTPROOF, FL)
(Resource Conservation and Recovery Act (tracking hazardous waste)) Business NAICS classification: OTHER AUTOMOTIVE MECHANICAL AND ELECTRICAL REPAIR AND MAINTENANCE. Organizations: JAMES HADDEN, OWNER (CONTACT/OWNER)
RECHARD M MCKENZIE & SONS INC (1762 S LAKE REEDY BLVD in FROSTPROOF, FL)
(Resource Conservation and Recovery Act (tracking hazardous waste)) Business NAICS classification: CROP HARVESTING, PRIMARILY BY MACHINE. Organizations: RICHARD M. MCKENZIE (CONTACT/OWNER)
SOUTH COUNTY JAIL EXPANSION PH (1103 98 W in FROSTPROOF, FL)
National Pollutant Discharge Elimination System NON-MAJOR (Tracking pollutant discharge elimination systems) - permit Organizations: TERRY PITTMAN (CONTACT/OWNER)
SR 17 FROM US 27 TO NORTH OF I ( in FROSTPROOF, FL)
National Pollutant Discharge Elimination System NON-MAJOR (Tracking pollutant discharge elimination systems) - permit Organizations: JOHN HOOPER (CONTACT/OWNER)
POLK FLEET MGT FROSTPROOF (350 SR 630A in FROSTPROOF, FL)
Small Quantity Generators, between 100 kg and 1000 kg of hazardous waste/month (Resource Conservation and Recovery Act (tracking hazardous waste)) Organizations: POLK CTY BOCC FLT MGMT (CONTACT/OWNER)
Housing units lacking complete plumbing facilities: 1.1% Housing units lacking complete kitchen facilities: 2.9%
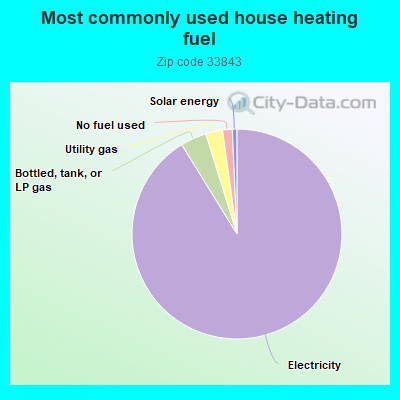
91.2%Electricity
4.0%Bottled, tank, or LP gas
2.6%Utility gas
1.5%No fuel used
0.7%Solar energy
Population in 1990: 8,747. Population change in the 1990s: +1,921 (+22.0%).
Place of birth for U.S.-born residents:
This state: 4,490
Northeast: 1,375
Midwest: 1,882
South: 1,745
West: 107
54% of the 33843 zip code residents lived in the same house 5 years ago. Out of people who lived in different houses, 54% lived in this county. Out of people who lived in different counties, 50% lived in Florida.
87% of the 33843 zip code residents lived in the same house 1 year ago. Out of people who lived in different houses, 37% moved from this county. Out of people who lived in different houses, 31% moved from different county within same state. Out of people who lived in different houses, 29% moved from different state. Out of people who lived in different houses, 4% moved from abroad.
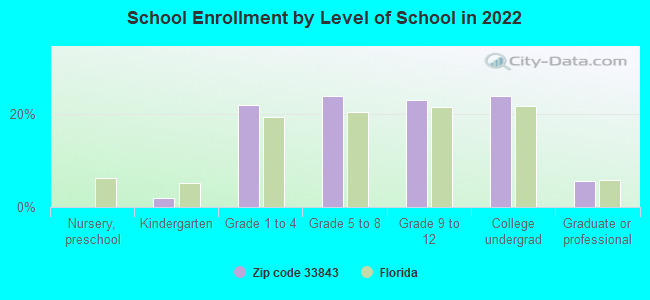
Private vs. public school enrollment:
Students in private schools in grades 1 to 8 (elementary and middle school): 91
Here:
16.2%
Florida:
15.8%
Students in private schools in grades 9 to 12 (high school): 29
Here:
10.3%
Florida:
12.9%
Students in private undergraduate colleges: 43
Here:
14.8%
Florida:
23.6%
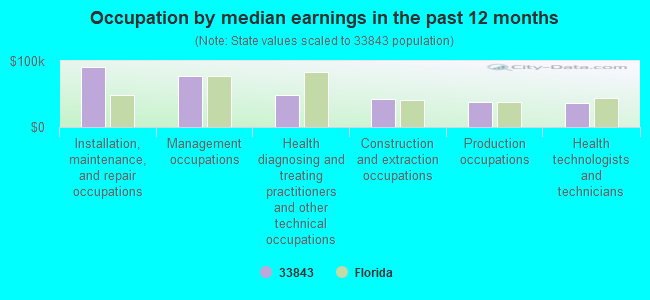
Occupation by median earnings in the past 12 months ($)
90,860Installation, maintenance, and repair occupations
76,591Management occupations
48,856Health diagnosing and treating practitioners and other technical occupations
42,349Construction and extraction occupations
38,346Production occupations
36,005Health technologists and technicians
Companies with federal contracts located in this zip code:
UNIVERSAL SHOOTING ACADEMY (4300 COUNTY ROAD 630E in FROSTPROOF, FL; small business)
$19,096 with Army for Guns, over 30 mm up to 75 mm. Signed on 2003-08-25. Completion date: 2003-09-27.
MORTON, ROSCOE (5 AIRPORT ROAD in FROSTPROOF, FL; small business)
$2,499 with Air Force for Other Defense -- Engineering Development (R&D). Signed on 2005-03-14. Completion date: 2005-03-25.
Top industries in this zip code by the number of employees in 2005:
Administrative and Support and Waste Management and Remediation Services: Temporary Help Services (100-249 employees: 1 establishment, 20-49 employees: 1 establishment, 1-4 employees: 2 establishments)
Accommodation and Food Services: Limited-Service Restaurants (50-99: 1, 10-19: 1)
Health Care and Social Assistance: All Other Outpatient Care Centers (50-99: 1)
Other Services (except Public Administration): Religious Organizations (10-19: 2, 5-9: 2, 1-4: 4)
Finance and Insurance: Commercial Banking (20-49: 1, 1-4: 2)
People in group quarters in 2010:
1,356 people in local jails and other municipal confinement facilities
26 people in workers' group living quarters and job corps centers
People in group quarters in 2000:
805 people in local jails and other confinement facilities (including police lockups)
65 people in college dormitories (includes college quarters off campus)
34 people in agriculture workers' dormitories on farms
4 people in other noninstitutional group quarters
Fatal accident statistics in 2014:
Fatal accident count: 2
Vehicles involved in fatal accidents: 6
Fatal accidents caused by drunken drivers: 0
Fatalities: 3
Persons involved in fatal accidents: 10
Pedestrians involved in fatal accidents: 0
Fatal accident statistics in 2013:
Fatal accident count: 2
Vehicles involved in fatal accidents: 3
Fatal accidents caused by drunken drivers: 0
Fatalities: 2
Persons involved in fatal accidents: 3
Pedestrians involved in fatal accidents: 0
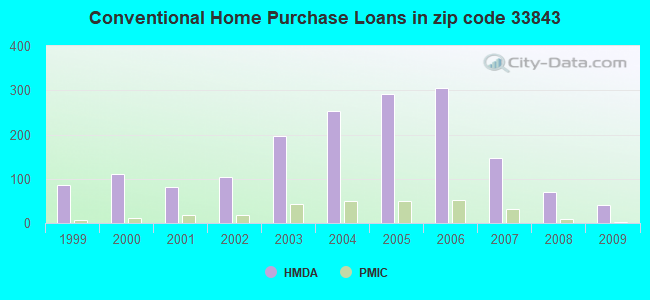
Home Mortgage Disclosure Act Aggregated Statistics For Year 2009 (Based on 12 partial tracts)
A) FHA, FSA/RHS & VA Home Purchase Loans
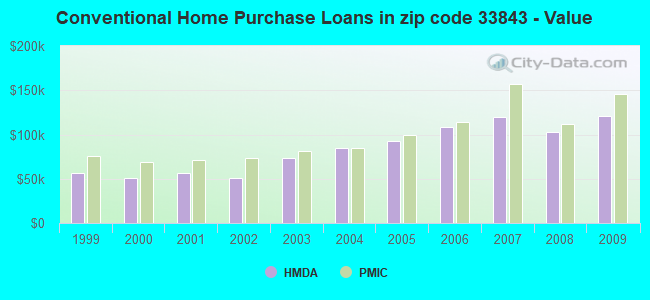
B) Conventional Home Purchase Loans
C) Refinancings
D) Home Improvement Loans
F) Non-occupant Loans on < 5 Family Dwellings (A B C & D)
G) Loans On Manufactured Home Dwelling (A B C & D)
Number
Average Value
Number
Average Value
Number
Average Value
Number
Average Value
Number
Average Value
Number
Average Value
LOANS ORIGINATED
24
$86,836
40
$121,209
144
$108,340
9
$34,444
47
$63,316
74
$61,568
APPLICATIONS APPROVED, NOT ACCEPTED
1
$55,260
10
$138,095
12
$95,288
1
$14,130
7
$67,529
9
$59,233
APPLICATIONS DENIED
7
$167,124
16
$65,177
79
$139,665
18
$28,522
15
$98,073
30
$61,108
APPLICATIONS WITHDRAWN
2
$32,770
5
$57,082
26
$138,168
1
$77,850
4
$60,052
4
$116,848
FILES CLOSED FOR INCOMPLETENESS
0
$0
0
$0
11
$152,008
0
$0
0
$0
2
$133,495
Aggregated Statistics For Year 2008 (Based on 12 partial tracts)
A) FHA, FSA/RHS & VA Home Purchase Loans
B) Conventional Home Purchase Loans
C) Refinancings
D) Home Improvement Loans
F) Non-occupant Loans on < 5 Family Dwellings (A B C & D)
G) Loans On Manufactured Home Dwelling (A B C & D)
Number
Average Value
Number
Average Value
Number
Average Value
Number
Average Value
Number
Average Value
Number
Average Value
LOANS ORIGINATED
31
$111,471
69
$102,573
156
$104,217
17
$25,456
65
$74,282
107
$62,828
APPLICATIONS APPROVED, NOT ACCEPTED
2
$101,680
12
$95,351
18
$143,412
0
$0
8
$91,408
11
$72,439
APPLICATIONS DENIED
9
$113,787
36
$147,979
143
$118,557
33
$34,628
24
$106,367
53
$75,574
APPLICATIONS WITHDRAWN
3
$88,163
10
$139,578
53
$130,036
2
$73,840
8
$193,955
13
$75,572
FILES CLOSED FOR INCOMPLETENESS
2
$116,050
1
$133,850
11
$136,089
0
$0
4
$118,795
0
$0
Aggregated Statistics For Year 2007 (Based on 12 partial tracts)
A) FHA, FSA/RHS & VA Home Purchase Loans
B) Conventional Home Purchase Loans
C) Refinancings
D) Home Improvement Loans
E) Loans on Dwellings For 5+ Families
F) Non-occupant Loans on < 5 Family Dwellings (A B C & D)
G) Loans On Manufactured Home Dwelling (A B C & D)
Number
Average Value
Number
Average Value
Number
Average Value
Number
Average Value
Number
Average Value
Number
Average Value
Number
Average Value
LOANS ORIGINATED
28
$114,780
146
$119,923
229
$118,991
48
$66,948
0
$0
88
$101,318
125
$72,665
APPLICATIONS APPROVED, NOT ACCEPTED
1
$31,810
39
$105,317
37
$132,930
11
$44,977
0
$0
11
$111,278
17
$78,475
APPLICATIONS DENIED
9
$109,872
53
$143,788
253
$125,999
63
$47,331
0
$0
25
$147,860
62
$65,800
APPLICATIONS WITHDRAWN
4
$106,445
18
$167,086
117
$124,942
5
$91,260
1
$248,160
11
$160,395
8
$104,206
FILES CLOSED FOR INCOMPLETENESS
1
$143,670
4
$138,818
21
$135,361
0
$0
0
$0
2
$112,485
0
$0
Aggregated Statistics For Year 2006 (Based on 12 partial tracts)
A) FHA, FSA/RHS & VA Home Purchase Loans
B) Conventional Home Purchase Loans
C) Refinancings
D) Home Improvement Loans
F) Non-occupant Loans on < 5 Family Dwellings (A B C & D)
G) Loans On Manufactured Home Dwelling (A B C & D)
Number
Average Value
Number
Average Value
Number
Average Value
Number
Average Value
Number
Average Value
Number
Average Value
LOANS ORIGINATED
20
$116,294
304
$108,093
289
$106,010
58
$47,356
126
$100,145
146
$70,957
APPLICATIONS APPROVED, NOT ACCEPTED
3
$75,020
70
$73,233
54
$107,342
8
$58,886
32
$80,217
50
$60,399
APPLICATIONS DENIED
5
$104,548
99
$141,878
225
$106,675
66
$49,140
34
$93,666
87
$107,834
APPLICATIONS WITHDRAWN
4
$91,695
26
$136,078
156
$126,608
12
$76,687
5
$177,966
18
$87,673
FILES CLOSED FOR INCOMPLETENESS
4
$94,890
10
$109,776
15
$136,189
2
$90,215
3
$74,457
2
$61,035
Aggregated Statistics For Year 2005 (Based on 12 partial tracts)
A) FHA, FSA/RHS & VA Home Purchase Loans
B) Conventional Home Purchase Loans
C) Refinancings
D) Home Improvement Loans
E) Loans on Dwellings For 5+ Families
F) Non-occupant Loans on < 5 Family Dwellings (A B C & D)
G) Loans On Manufactured Home Dwelling (A B C & D)
Number
Average Value
Number
Average Value
Number
Average Value
Number
Average Value
Number
Average Value
Number
Average Value
Number
Average Value
LOANS ORIGINATED
28
$99,131
291
$92,886
220
$95,911
51
$54,231
1
$91,430
122
$84,973
148
$62,840
APPLICATIONS APPROVED, NOT ACCEPTED
3
$120,927
47
$72,339
49
$86,608
9
$47,156
0
$0
14
$57,321
34
$63,772
APPLICATIONS DENIED
4
$107,312
107
$87,629
207
$85,856
53
$48,992
0
$0
36
$86,264
78
$63,570
APPLICATIONS WITHDRAWN
2
$142,965
41
$102,271
138
$96,223
14
$92,242
0
$0
19
$88,528
16
$74,291
FILES CLOSED FOR INCOMPLETENESS
0
$0
21
$88,265
21
$102,629
1
$65,300
0
$0
3
$170,373
2
$79,005
Aggregated Statistics For Year 2004 (Based on 12 partial tracts)
A) FHA, FSA/RHS & VA Home Purchase Loans
B) Conventional Home Purchase Loans
C) Refinancings
D) Home Improvement Loans
F) Non-occupant Loans on < 5 Family Dwellings (A B C & D)
G) Loans On Manufactured Home Dwelling (A B C & D)
Number
Average Value
Number
Average Value
Number
Average Value
Number
Average Value
Number
Average Value
Number
Average Value
LOANS ORIGINATED
23
$92,724
252
$85,084
156
$75,859
50
$34,178
116
$71,847
130
$54,021
APPLICATIONS APPROVED, NOT ACCEPTED
5
$82,374
40
$84,226
49
$78,211
11
$27,230
17
$74,208
30
$63,471
APPLICATIONS DENIED
6
$96,337
75
$65,207
138
$80,796
47
$32,907
15
$57,256
68
$49,940
APPLICATIONS WITHDRAWN
5
$69,518
21
$92,290
101
$81,831
9
$47,322
8
$85,021
13
$74,077
FILES CLOSED FOR INCOMPLETENESS
0
$0
6
$94,847
9
$93,113
1
$19,220
1
$43,120
0
$0
Aggregated Statistics For Year 2003 (Based on 12 partial tracts)
A) FHA, FSA/RHS & VA Home Purchase Loans
B) Conventional Home Purchase Loans
C) Refinancings
D) Home Improvement Loans
F) Non-occupant Loans on < 5 Family Dwellings (A B C & D)
Number
Average Value
Number
Average Value
Number
Average Value
Number
Average Value
Number
Average Value
LOANS ORIGINATED
41
$83,393
197
$73,469
253
$84,649
31
$17,336
88
$66,411
APPLICATIONS APPROVED, NOT ACCEPTED
2
$73,070
24
$75,430
53
$74,497
2
$40,815
11
$58,972
APPLICATIONS DENIED
12
$66,851
49
$70,615
160
$67,811
28
$14,354
16
$72,386
APPLICATIONS WITHDRAWN
4
$76,008
17
$91,434
84
$83,051
3
$21,177
9
$149,297
FILES CLOSED FOR INCOMPLETENESS
2
$73,240
6
$58,407
13
$62,028
1
$18,560
2
$79,645
Aggregated Statistics For Year 2002 (Based on 8 partial tracts)
A) FHA, FSA/RHS & VA Home Purchase Loans
B) Conventional Home Purchase Loans
C) Refinancings
D) Home Improvement Loans
F) Non-occupant Loans on < 5 Family Dwellings (A B C & D)
Number
Average Value
Number
Average Value
Number
Average Value
Number
Average Value
Number
Average Value
LOANS ORIGINATED
16
$78,008
104
$51,312
103
$76,951
46
$12,452
52
$44,507
APPLICATIONS APPROVED, NOT ACCEPTED
1
$35,680
20
$71,544
23
$60,957
2
$9,700
2
$98,145
APPLICATIONS DENIED
1
$133,990
46
$48,750
89
$66,658
33
$11,204
16
$21,339
APPLICATIONS WITHDRAWN
3
$82,170
9
$41,527
44
$82,215
8
$14,365
4
$40,432
FILES CLOSED FOR INCOMPLETENESS
0
$0
1
$96,430
10
$80,563
0
$0
1
$40,110
Aggregated Statistics For Year 2001 (Based on 8 partial tracts)
A) FHA, FSA/RHS & VA Home Purchase Loans
B) Conventional Home Purchase Loans
C) Refinancings
D) Home Improvement Loans
F) Non-occupant Loans on < 5 Family Dwellings (A B C & D)
Number
Average Value
Number
Average Value
Number
Average Value
Number
Average Value
Number
Average Value
LOANS ORIGINATED
18
$66,686
81
$56,990
85
$62,636
38
$9,184
31
$47,796
APPLICATIONS APPROVED, NOT ACCEPTED
2
$57,665
9
$44,608
15
$51,515
5
$15,914
3
$46,930
APPLICATIONS DENIED
1
$55,980
51
$50,942
113
$53,125
45
$11,285
7
$37,380
APPLICATIONS WITHDRAWN
2
$49,015
15
$46,358
48
$62,470
6
$22,385
4
$50,352
FILES CLOSED FOR INCOMPLETENESS
1
$58,690
0
$0
8
$59,328
0
$0
1
$71,900
Aggregated Statistics For Year 2000 (Based on 8 partial tracts)
A) FHA, FSA/RHS & VA Home Purchase Loans
B) Conventional Home Purchase Loans
C) Refinancings
D) Home Improvement Loans
E) Loans on Dwellings For 5+ Families
F) Non-occupant Loans on < 5 Family Dwellings (A B C & D)
Number
Average Value
Number
Average Value
Number
Average Value
Number
Average Value
Number
Average Value
Number
Average Value
LOANS ORIGINATED
27
$55,089
110
$51,256
60
$46,716
24
$13,359
0
$0
36
$51,682
APPLICATIONS APPROVED, NOT ACCEPTED
1
$43,480
18
$45,636
26
$41,981
7
$28,790
0
$0
4
$46,155
APPLICATIONS DENIED
6
$39,018
55
$38,666
88
$46,749
26
$9,259
1
$572,560
5
$38,220
APPLICATIONS WITHDRAWN
2
$79,070
13
$61,767
49
$49,435
10
$22,147
0
$0
3
$39,727
FILES CLOSED FOR INCOMPLETENESS
2
$95,860
2
$34,965
3
$45,707
0
$0
0
$0
0
$0
Aggregated Statistics For Year 1999 (Based on 5 partial tracts)
A) FHA, FSA/RHS & VA Home Purchase Loans
B) Conventional Home Purchase Loans
C) Refinancings
D) Home Improvement Loans
F) Non-occupant Loans on < 5 Family Dwellings (A B C & D)
2002 - 2018 National Fire Incident Reporting System (NFIRS) incidents
According to the data from the years 2002 - 2018 the average number of fires per year is 65. The highest number of reported fires - 96 took place in 2006, and the least - 54 in 2007. The data has a rising trend.
When looking into fire subcategories, the most reports belonged to: Outside Fires (58.8%), and Structure Fires (21.2%).
Fire incident types reported to NFIRS in Zip Code 33843


+$6,631
-$6,005
(% of AGI for various income ranges: -4.8% for AGIs below $10k, -0.2% for AGIs $10k-25k, -0.5% for AGIs $25k-50k, -0.3% for AGIs $50k-75k, 2.9% for AGIs over 100k) Nearest zip codes: 33827, 33825, 33856, 33859, 33854, 33853.
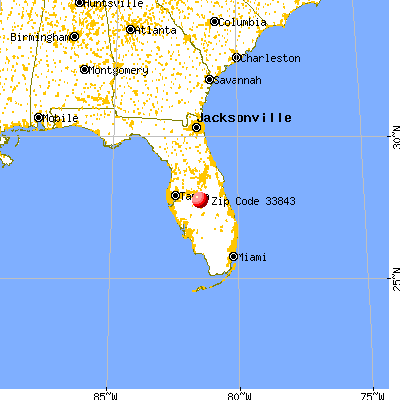


 According to the data from the years 2002 - 2018 the average number of fires per year is 65. The highest number of reported fires - 96 took place in 2006, and the least - 54 in 2007. The data has a rising trend.
 When looking into fire subcategories, the most reports belonged to: Outside Fires (58.8%), and Structure Fires (21.2%).