Estimated zip code population in 2022: 18,960
Zip code population in 2010: 15,958
Zip code population in 2000: 14,692
Houses and condos: 9,709
Renter-occupied apartments: 1,131
% of renters here:
14%State:
33%
March 2022 cost of living index in zip code 33948: 91.0
(less than average, U.S. average is 100)
Land area: 13.0
sq. mi.
Water area: 1.5
sq. mi.
Population density: 1,462 people per square mile (low).
OSM Map
General Map
Google Map
MSN Map
OSM Map
General Map
Google Map
MSN Map
OSM Map
General Map
Google Map
MSN Map
OSM Map
General Map
Google Map
MSN Map
Please wait while loading the map...
Real estate property taxes paid for housing units in 2022:
This zip code:
0.8% ($2,470)Florida:
0.7% ($2,529)
Median real estate property taxes paid for housing units with mortgages in 2022: $2,410 (0.8%)
Median real estate property taxes paid for housing units with no mortgage in 2022: $2,549 (0.8%)
Profiles of local businesses
Business Search - 14 Million verified businesses
Males: 9,191 Females: 9,768
For population 25 years and over in 33948:
High school or higher: 91.2%Bachelor's degree or higher: 21.4%Graduate or professional degree: 7.0%Unemployed: 5.7%Mean travel time to work (commute): 27.4 minutes
For population 15 years and over in 33948:
Never married: 20.5%Now married: 59.3%Separated: 0.7%Widowed: 9.2%Divorced: 10.4%
Zip code 33948 compared to state average:
Black race population percentage below state average. Hispanic race population percentage significantly below state average. Median age significantly above state average. Foreign-born population percentage below state average. Renting percentage significantly below state average. Length of stay since moving in significantly above state average. Number of college students below state average. 15,097 79.6% White 1,515 8.0% Hispanic or Latino 1,286 6.8% Black 594 3.1% Two or more races 348 1.8% Asian 81 0.4% Some other race 37 0.2% Native Hawaiian and Other
Data:
Median household income ($)
Median household income (% change since 2000)
Household income diversity
Ratio of average income to average house value (%)
Ratio of average income to average rent
Median household income ($) - White
Median household income ($) - Black or African American
Median household income ($) - Asian
Median household income ($) - Hispanic or Latino
Median household income ($) - American Indian and Alaska Native
Median household income ($) - Multirace
Median household income ($) - Other Race
Median household income for houses/condos with a mortgage ($)
Median household income for apartments without a mortgage ($)
Races - White alone (%)
Races - White alone (% change since 2000)
Races - Black alone (%)
Races - Black alone (% change since 2000)
Races - American Indian alone (%)
Races - American Indian alone (% change since 2000)
Races - Asian alone (%)
Races - Asian alone (% change since 2000)
Races - Hispanic (%)
Races - Hispanic (% change since 2000)
Races - Native Hawaiian and Other Pacific Islander alone (%)
Races - Native Hawaiian and Other Pacific Islander alone (% change since 2000)
Races - Two or more races (%)
Races - Two or more races (% change since 2000)
Races - Other race alone (%)
Races - Other race alone (% change since 2000)
Racial diversity
Unemployment (%)
Unemployment (% change since 2000)
Unemployment (%) - White
Unemployment (%) - Black or African American
Unemployment (%) - Asian
Unemployment (%) - Hispanic or Latino
Unemployment (%) - American Indian and Alaska Native
Unemployment (%) - Multirace
Unemployment (%) - Other Race
Population density (people per square mile)
Population - Males (%)
Population - Females (%)
Population - Males (%) - White
Population - Males (%) - Black or African American
Population - Males (%) - Asian
Population - Males (%) - Hispanic or Latino
Population - Males (%) - American Indian and Alaska Native
Population - Males (%) - Multirace
Population - Males (%) - Other Race
Population - Females (%) - White
Population - Females (%) - Black or African American
Population - Females (%) - Asian
Population - Females (%) - Hispanic or Latino
Population - Females (%) - American Indian and Alaska Native
Population - Females (%) - Multirace
Population - Females (%) - Other Race
Coronavirus confirmed cases (Apr 27, 2024)
Deaths caused by coronavirus (Apr 27, 2024)
Coronavirus confirmed cases (per 100k population) (Apr 27, 2024)
Deaths caused by coronavirus (per 100k population) (Apr 27, 2024)
Daily increase in number of cases (Apr 27, 2024)
Weekly increase in number of cases (Apr 27, 2024)
Cases doubled (in days) (Apr 27, 2024)
Hospitalized patients (Apr 18, 2022)
Negative test results (Apr 18, 2022)
Total test results (Apr 18, 2022)
COVID Vaccine doses distributed (per 100k population) (Sep 19, 2023)
COVID Vaccine doses administered (per 100k population) (Sep 19, 2023)
COVID Vaccine doses distributed (Sep 19, 2023)
COVID Vaccine doses administered (Sep 19, 2023)
Likely homosexual households (%)
Likely homosexual households (% change since 2000)
Likely homosexual households - Lesbian couples (%)
Likely homosexual households - Lesbian couples (% change since 2000)
Likely homosexual households - Gay men (%)
Likely homosexual households - Gay men (% change since 2000)
Cost of living index
Median gross rent ($)
Median contract rent ($)
Median monthly housing costs ($)
Median house or condo value ($)
Median house or condo value ($ change since 2000)
Mean house or condo value by units in structure - 1, detached ($)
Mean house or condo value by units in structure - 1, attached ($)
Mean house or condo value by units in structure - 2 ($)
Mean house or condo value by units in structure by units in structure - 3 or 4 ($)
Mean house or condo value by units in structure - 5 or more ($)
Mean house or condo value by units in structure - Boat, RV, van, etc. ($)
Mean house or condo value by units in structure - Mobile home ($)
Median house or condo value ($) - White
Median house or condo value ($) - Black or African American
Median house or condo value ($) - Asian
Median house or condo value ($) - Hispanic or Latino
Median house or condo value ($) - American Indian and Alaska Native
Median house or condo value ($) - Multirace
Median house or condo value ($) - Other Race
Median resident age
Resident age diversity
Median resident age - Males
Median resident age - Females
Median resident age - White
Median resident age - Black or African American
Median resident age - Asian
Median resident age - Hispanic or Latino
Median resident age - American Indian and Alaska Native
Median resident age - Multirace
Median resident age - Other Race
Median resident age - Males - White
Median resident age - Males - Black or African American
Median resident age - Males - Asian
Median resident age - Males - Hispanic or Latino
Median resident age - Males - American Indian and Alaska Native
Median resident age - Males - Multirace
Median resident age - Males - Other Race
Median resident age - Females - White
Median resident age - Females - Black or African American
Median resident age - Females - Asian
Median resident age - Females - Hispanic or Latino
Median resident age - Females - American Indian and Alaska Native
Median resident age - Females - Multirace
Median resident age - Females - Other Race
Commute - mean travel time to work (minutes)
Travel time to work - Less than 5 minutes (%)
Travel time to work - Less than 5 minutes (% change since 2000)
Travel time to work - 5 to 9 minutes (%)
Travel time to work - 5 to 9 minutes (% change since 2000)
Travel time to work - 10 to 19 minutes (%)
Travel time to work - 10 to 19 minutes (% change since 2000)
Travel time to work - 20 to 29 minutes (%)
Travel time to work - 20 to 29 minutes (% change since 2000)
Travel time to work - 30 to 39 minutes (%)
Travel time to work - 30 to 39 minutes (% change since 2000)
Travel time to work - 40 to 59 minutes (%)
Travel time to work - 40 to 59 minutes (% change since 2000)
Travel time to work - 60 to 89 minutes (%)
Travel time to work - 60 to 89 minutes (% change since 2000)
Travel time to work - 90 or more minutes (%)
Travel time to work - 90 or more minutes (% change since 2000)
Marital status - Never married (%)
Marital status - Now married (%)
Marital status - Separated (%)
Marital status - Widowed (%)
Marital status - Divorced (%)
Median family income ($)
Median family income (% change since 2000)
Median non-family income ($)
Median non-family income (% change since 2000)
Median per capita income ($)
Median per capita income (% change since 2000)
Median family income ($) - White
Median family income ($) - Black or African American
Median family income ($) - Asian
Median family income ($) - Hispanic or Latino
Median family income ($) - American Indian and Alaska Native
Median family income ($) - Multirace
Median family income ($) - Other Race
Median year house/condo built
Median year apartment built
Year house built - Built 2005 or later (%)
Year house built - Built 2000 to 2004 (%)
Year house built - Built 1990 to 1999 (%)
Year house built - Built 1980 to 1989 (%)
Year house built - Built 1970 to 1979 (%)
Year house built - Built 1960 to 1969 (%)
Year house built - Built 1950 to 1959 (%)
Year house built - Built 1940 to 1949 (%)
Year house built - Built 1939 or earlier (%)
Average household size
Household density (households per square mile)
Average household size - White
Average household size - Black or African American
Average household size - Asian
Average household size - Hispanic or Latino
Average household size - American Indian and Alaska Native
Average household size - Multirace
Average household size - Other Race
Occupied housing units (%)
Vacant housing units (%)
Owner occupied housing units (%)
Renter occupied housing units (%)
Vacancy status - For rent (%)
Vacancy status - For sale only (%)
Vacancy status - Rented or sold, not occupied (%)
Vacancy status - For seasonal, recreational, or occasional use (%)
Vacancy status - For migrant workers (%)
Vacancy status - Other vacant (%)
Residents with income below the poverty level (%)
Residents with income below 50% of the poverty level (%)
Children below poverty level (%)
Poor families by family type - Married-couple family (%)
Poor families by family type - Male, no wife present (%)
Poor families by family type - Female, no husband present (%)
Poverty status for native-born residents (%)
Poverty status for foreign-born residents (%)
Poverty among high school graduates not in families (%)
Poverty among people who did not graduate high school not in families (%)
Residents with income below the poverty level (%) - White
Residents with income below the poverty level (%) - Black or African American
Residents with income below the poverty level (%) - Asian
Residents with income below the poverty level (%) - Hispanic or Latino
Residents with income below the poverty level (%) - American Indian and Alaska Native
Residents with income below the poverty level (%) - Multirace
Residents with income below the poverty level (%) - Other Race
Air pollution - Air Quality Index (AQI)
Air pollution - CO
Air pollution - NO2
Air pollution - SO2
Air pollution - Ozone
Air pollution - PM10
Air pollution - PM25
Air pollution - Pb
Crime - Murders per 100,000 population
Crime - Rapes per 100,000 population
Crime - Robberies per 100,000 population
Crime - Assaults per 100,000 population
Crime - Burglaries per 100,000 population
Crime - Thefts per 100,000 population
Crime - Auto thefts per 100,000 population
Crime - Arson per 100,000 population
Crime - City-data.com crime index
Crime - Violent crime index
Crime - Property crime index
Crime - Murders per 100,000 population (5 year average)
Crime - Rapes per 100,000 population (5 year average)
Crime - Robberies per 100,000 population (5 year average)
Crime - Assaults per 100,000 population (5 year average)
Crime - Burglaries per 100,000 population (5 year average)
Crime - Thefts per 100,000 population (5 year average)
Crime - Auto thefts per 100,000 population (5 year average)
Crime - Arson per 100,000 population (5 year average)
Crime - City-data.com crime index (5 year average)
Crime - Violent crime index (5 year average)
Crime - Property crime index (5 year average)
1996 Presidential Elections Results (%) - Democratic Party (Clinton)
1996 Presidential Elections Results (%) - Republican Party (Dole)
1996 Presidential Elections Results (%) - Other
2000 Presidential Elections Results (%) - Democratic Party (Gore)
2000 Presidential Elections Results (%) - Republican Party (Bush)
2000 Presidential Elections Results (%) - Other
2004 Presidential Elections Results (%) - Democratic Party (Kerry)
2004 Presidential Elections Results (%) - Republican Party (Bush)
2004 Presidential Elections Results (%) - Other
2008 Presidential Elections Results (%) - Democratic Party (Obama)
2008 Presidential Elections Results (%) - Republican Party (McCain)
2008 Presidential Elections Results (%) - Other
2012 Presidential Elections Results (%) - Democratic Party (Obama)
2012 Presidential Elections Results (%) - Republican Party (Romney)
2012 Presidential Elections Results (%) - Other
2016 Presidential Elections Results (%) - Democratic Party (Clinton)
2016 Presidential Elections Results (%) - Republican Party (Trump)
2016 Presidential Elections Results (%) - Other
2020 Presidential Elections Results (%) - Democratic Party (Biden)
2020 Presidential Elections Results (%) - Republican Party (Trump)
2020 Presidential Elections Results (%) - Other
Ancestries Reported - Arab (%)
Ancestries Reported - Czech (%)
Ancestries Reported - Danish (%)
Ancestries Reported - Dutch (%)
Ancestries Reported - English (%)
Ancestries Reported - French (%)
Ancestries Reported - French Canadian (%)
Ancestries Reported - German (%)
Ancestries Reported - Greek (%)
Ancestries Reported - Hungarian (%)
Ancestries Reported - Irish (%)
Ancestries Reported - Italian (%)
Ancestries Reported - Lithuanian (%)
Ancestries Reported - Norwegian (%)
Ancestries Reported - Polish (%)
Ancestries Reported - Portuguese (%)
Ancestries Reported - Russian (%)
Ancestries Reported - Scotch-Irish (%)
Ancestries Reported - Scottish (%)
Ancestries Reported - Slovak (%)
Ancestries Reported - Subsaharan African (%)
Ancestries Reported - Swedish (%)
Ancestries Reported - Swiss (%)
Ancestries Reported - Ukrainian (%)
Ancestries Reported - United States (%)
Ancestries Reported - Welsh (%)
Ancestries Reported - West Indian (%)
Ancestries Reported - Other (%)
Educational Attainment - No schooling completed (%)
Educational Attainment - Less than high school (%)
Educational Attainment - High school or equivalent (%)
Educational Attainment - Less than 1 year of college (%)
Educational Attainment - 1 or more years of college (%)
Educational Attainment - Associate degree (%)
Educational Attainment - Bachelor's degree (%)
Educational Attainment - Master's degree (%)
Educational Attainment - Professional school degree (%)
Educational Attainment - Doctorate degree (%)
School Enrollment - Nursery, preschool (%)
School Enrollment - Kindergarten (%)
School Enrollment - Grade 1 to 4 (%)
School Enrollment - Grade 5 to 8 (%)
School Enrollment - Grade 9 to 12 (%)
School Enrollment - College undergrad (%)
School Enrollment - Graduate or professional (%)
School Enrollment - Not enrolled in school (%)
School enrollment - Public schools (%)
School enrollment - Private schools (%)
School enrollment - Not enrolled (%)
Median number of rooms in houses and condos
Median number of rooms in apartments
Housing units lacking complete plumbing facilities (%)
Housing units lacking complete kitchen facilities (%)
Density of houses
Urban houses (%)
Rural houses (%)
Households with people 60 years and over (%)
Households with people 65 years and over (%)
Households with people 75 years and over (%)
Households with one or more nonrelatives (%)
Households with no nonrelatives (%)
Population in households (%)
Family households (%)
Nonfamily households (%)
Population in families (%)
Family households with own children (%)
Median number of bedrooms in owner occupied houses
Mean number of bedrooms in owner occupied houses
Median number of bedrooms in renter occupied houses
Mean number of bedrooms in renter occupied houses
Median number of vehichles in owner occupied houses
Mean number of vehichles in owner occupied houses
Median number of vehichles in renter occupied houses
Mean number of vehichles in renter occupied houses
Mortgage status - with mortgage (%)
Mortgage status - with second mortgage (%)
Mortgage status - with home equity loan (%)
Mortgage status - with both second mortgage and home equity loan (%)
Mortgage status - without a mortgage (%)
Average family size
Average family size - White
Average family size - Black or African American
Average family size - Asian
Average family size - Hispanic or Latino
Average family size - American Indian and Alaska Native
Average family size - Multirace
Average family size - Other Race
Geographical mobility - Same house 1 year ago (%)
Geographical mobility - Moved within same county (%)
Geographical mobility - Moved from different county within same state (%)
Geographical mobility - Moved from different state (%)
Geographical mobility - Moved from abroad (%)
Place of birth - Born in state of residence (%)
Place of birth - Born in other state (%)
Place of birth - Native, outside of US (%)
Place of birth - Foreign born (%)
Housing units in structures - 1, detached (%)
Housing units in structures - 1, attached (%)
Housing units in structures - 2 (%)
Housing units in structures - 3 or 4 (%)
Housing units in structures - 5 to 9 (%)
Housing units in structures - 10 to 19 (%)
Housing units in structures - 20 to 49 (%)
Housing units in structures - 50 or more (%)
Housing units in structures - Mobile home (%)
Housing units in structures - Boat, RV, van, etc. (%)
House/condo owner moved in on average (years ago)
Renter moved in on average (years ago)
Year householder moved into unit - Moved in 1999 to March 2000 (%)
Year householder moved into unit - Moved in 1995 to 1998 (%)
Year householder moved into unit - Moved in 1990 to 1994 (%)
Year householder moved into unit - Moved in 1980 to 1989 (%)
Year householder moved into unit - Moved in 1970 to 1979 (%)
Year householder moved into unit - Moved in 1969 or earlier (%)
Means of transportation to work - Drove car alone (%)
Means of transportation to work - Carpooled (%)
Means of transportation to work - Public transportation (%)
Means of transportation to work - Bus or trolley bus (%)
Means of transportation to work - Streetcar or trolley car (%)
Means of transportation to work - Subway or elevated (%)
Means of transportation to work - Railroad (%)
Means of transportation to work - Ferryboat (%)
Means of transportation to work - Taxicab (%)
Means of transportation to work - Motorcycle (%)
Means of transportation to work - Bicycle (%)
Means of transportation to work - Walked (%)
Means of transportation to work - Other means (%)
Working at home (%)
Industry diversity
Most Common Industries - Agriculture, forestry, fishing and hunting, and mining (%)
Most Common Industries - Agriculture, forestry, fishing and hunting (%)
Most Common Industries - Mining, quarrying, and oil and gas extraction (%)
Most Common Industries - Construction (%)
Most Common Industries - Manufacturing (%)
Most Common Industries - Wholesale trade (%)
Most Common Industries - Retail trade (%)
Most Common Industries - Transportation and warehousing, and utilities (%)
Most Common Industries - Transportation and warehousing (%)
Most Common Industries - Utilities (%)
Most Common Industries - Information (%)
Most Common Industries - Finance and insurance, and real estate and rental and leasing (%)
Most Common Industries - Finance and insurance (%)
Most Common Industries - Real estate and rental and leasing (%)
Most Common Industries - Professional, scientific, and management, and administrative and waste management services (%)
Most Common Industries - Professional, scientific, and technical services (%)
Most Common Industries - Management of companies and enterprises (%)
Most Common Industries - Administrative and support and waste management services (%)
Most Common Industries - Educational services, and health care and social assistance (%)
Most Common Industries - Educational services (%)
Most Common Industries - Health care and social assistance (%)
Most Common Industries - Arts, entertainment, and recreation, and accommodation and food services (%)
Most Common Industries - Arts, entertainment, and recreation (%)
Most Common Industries - Accommodation and food services (%)
Most Common Industries - Other services, except public administration (%)
Most Common Industries - Public administration (%)
Occupation diversity
Most Common Occupations - Management, business, science, and arts occupations (%)
Most Common Occupations - Management, business, and financial occupations (%)
Most Common Occupations - Management occupations (%)
Most Common Occupations - Business and financial operations occupations (%)
Most Common Occupations - Computer, engineering, and science occupations (%)
Most Common Occupations - Computer and mathematical occupations (%)
Most Common Occupations - Architecture and engineering occupations (%)
Most Common Occupations - Life, physical, and social science occupations (%)
Most Common Occupations - Education, legal, community service, arts, and media occupations (%)
Most Common Occupations - Community and social service occupations (%)
Most Common Occupations - Legal occupations (%)
Most Common Occupations - Education, training, and library occupations (%)
Most Common Occupations - Arts, design, entertainment, sports, and media occupations (%)
Most Common Occupations - Healthcare practitioners and technical occupations (%)
Most Common Occupations - Health diagnosing and treating practitioners and other technical occupations (%)
Most Common Occupations - Health technologists and technicians (%)
Most Common Occupations - Service occupations (%)
Most Common Occupations - Healthcare support occupations (%)
Most Common Occupations - Protective service occupations (%)
Most Common Occupations - Fire fighting and prevention, and other protective service workers including supervisors (%)
Most Common Occupations - Law enforcement workers including supervisors (%)
Most Common Occupations - Food preparation and serving related occupations (%)
Most Common Occupations - Building and grounds cleaning and maintenance occupations (%)
Most Common Occupations - Personal care and service occupations (%)
Most Common Occupations - Sales and office occupations (%)
Most Common Occupations - Sales and related occupations (%)
Most Common Occupations - Office and administrative support occupations (%)
Most Common Occupations - Natural resources, construction, and maintenance occupations (%)
Most Common Occupations - Farming, fishing, and forestry occupations (%)
Most Common Occupations - Construction and extraction occupations (%)
Most Common Occupations - Installation, maintenance, and repair occupations (%)
Most Common Occupations - Production, transportation, and material moving occupations (%)
Most Common Occupations - Production occupations (%)
Most Common Occupations - Transportation occupations (%)
Most Common Occupations - Material moving occupations (%)
People in Group quarters - Institutionalized population (%)
People in Group quarters - Correctional institutions (%)
People in Group quarters - Federal prisons and detention centers (%)
People in Group quarters - Halfway houses (%)
People in Group quarters - Local jails and other confinement facilities (including police lockups) (%)
People in Group quarters - Military disciplinary barracks (%)
People in Group quarters - State prisons (%)
People in Group quarters - Other types of correctional institutions (%)
People in Group quarters - Nursing homes (%)
People in Group quarters - Hospitals/wards, hospices, and schools for the handicapped (%)
People in Group quarters - Hospitals/wards and hospices for chronically ill (%)
People in Group quarters - Hospices or homes for chronically ill (%)
People in Group quarters - Military hospitals or wards for chronically ill (%)
People in Group quarters - Other hospitals or wards for chronically ill (%)
People in Group quarters - Hospitals or wards for drug/alcohol abuse (%)
People in Group quarters - Mental (Psychiatric) hospitals or wards (%)
People in Group quarters - Schools, hospitals, or wards for the mentally retarded (%)
People in Group quarters - Schools, hospitals, or wards for the physically handicapped (%)
People in Group quarters - Institutions for the deaf (%)
People in Group quarters - Institutions for the blind (%)
People in Group quarters - Orthopedic wards and institutions for the physically handicapped (%)
People in Group quarters - Wards in general hospitals for patients who have no usual home elsewhere (%)
People in Group quarters - Wards in military hospitals for patients who have no usual home elsewhere (%)
People in Group quarters - Juvenile institutions (%)
People in Group quarters - Long-term care (%)
People in Group quarters - Homes for abused, dependent, and neglected children (%)
People in Group quarters - Residential treatment centers for emotionally disturbed children (%)
People in Group quarters - Training schools for juvenile delinquents (%)
People in Group quarters - Short-term care, detention or diagnostic centers for delinquent children (%)
People in Group quarters - Type of juvenile institution unknown (%)
People in Group quarters - Noninstitutionalized population (%)
People in Group quarters - College dormitories (includes college quarters off campus) (%)
People in Group quarters - Military quarters (%)
People in Group quarters - On base (%)
People in Group quarters - Barracks, unaccompanied personnel housing (UPH), (Enlisted/Officer), ;and similar group living quarters for military personnel (%)
People in Group quarters - Transient quarters for temporary residents (%)
People in Group quarters - Military ships (%)
People in Group quarters - Group homes (%)
People in Group quarters - Homes or halfway houses for drug/alcohol abuse (%)
People in Group quarters - Homes for the mentally ill (%)
People in Group quarters - Homes for the mentally retarded (%)
People in Group quarters - Homes for the physically handicapped (%)
People in Group quarters - Other group homes (%)
People in Group quarters - Religious group quarters (%)
People in Group quarters - Dormitories (%)
People in Group quarters - Agriculture workers' dormitories on farms (%)
People in Group quarters - Job Corps and vocational training facilities (%)
People in Group quarters - Other workers' dormitories (%)
People in Group quarters - Crews of maritime vessels (%)
People in Group quarters - Other nonhousehold living situations (%)
People in Group quarters - Other noninstitutional group quarters (%)
Residents speaking English at home (%)
Residents speaking English at home - Born in the United States (%)
Residents speaking English at home - Native, born elsewhere (%)
Residents speaking English at home - Foreign born (%)
Residents speaking Spanish at home (%)
Residents speaking Spanish at home - Born in the United States (%)
Residents speaking Spanish at home - Native, born elsewhere (%)
Residents speaking Spanish at home - Foreign born (%)
Residents speaking other language at home (%)
Residents speaking other language at home - Born in the United States (%)
Residents speaking other language at home - Native, born elsewhere (%)
Residents speaking other language at home - Foreign born (%)
Class of Workers - Employee of private company (%)
Class of Workers - Self-employed in own incorporated business (%)
Class of Workers - Private not-for-profit wage and salary workers (%)
Class of Workers - Local government workers (%)
Class of Workers - State government workers (%)
Class of Workers - Federal government workers (%)
Class of Workers - Self-employed workers in own not incorporated business and Unpaid family workers (%)
House heating fuel used in houses and condos - Utility gas (%)
House heating fuel used in houses and condos - Bottled, tank, or LP gas (%)
House heating fuel used in houses and condos - Electricity (%)
House heating fuel used in houses and condos - Fuel oil, kerosene, etc. (%)
House heating fuel used in houses and condos - Coal or coke (%)
House heating fuel used in houses and condos - Wood (%)
House heating fuel used in houses and condos - Solar energy (%)
House heating fuel used in houses and condos - Other fuel (%)
House heating fuel used in houses and condos - No fuel used (%)
House heating fuel used in apartments - Utility gas (%)
House heating fuel used in apartments - Bottled, tank, or LP gas (%)
House heating fuel used in apartments - Electricity (%)
House heating fuel used in apartments - Fuel oil, kerosene, etc. (%)
House heating fuel used in apartments - Coal or coke (%)
House heating fuel used in apartments - Wood (%)
House heating fuel used in apartments - Solar energy (%)
House heating fuel used in apartments - Other fuel (%)
House heating fuel used in apartments - No fuel used (%)
Armed forces status - In Armed Forces (%)
Armed forces status - Civilian (%)
Armed forces status - Civilian - Veteran (%)
Armed forces status - Civilian - Nonveteran (%)
Fatal accidents locations in years 2005-2021
Fatal accidents locations in 2005
Fatal accidents locations in 2006
Fatal accidents locations in 2007
Fatal accidents locations in 2008
Fatal accidents locations in 2009
Fatal accidents locations in 2010
Fatal accidents locations in 2011
Fatal accidents locations in 2012
Fatal accidents locations in 2013
Fatal accidents locations in 2014
Fatal accidents locations in 2015
Fatal accidents locations in 2016
Fatal accidents locations in 2017
Fatal accidents locations in 2018
Fatal accidents locations in 2019
Fatal accidents locations in 2020
Fatal accidents locations in 2021
Alcohol use - People drinking some alcohol every month (%)
Alcohol use - People not drinking at all (%)
Alcohol use - Average days/month drinking alcohol
Alcohol use - Average drinks/week
Alcohol use - Average days/year people drink much
Audiometry - Average condition of hearing (%)
Audiometry - People that can hear a whisper from across a quiet room (%)
Audiometry - People that can hear normal voice from across a quiet room (%)
Audiometry - Ears ringing, roaring, buzzing (%)
Audiometry - Had a job exposure to loud noise (%)
Audiometry - Had off-work exposure to loud noise (%)
Blood Pressure & Cholesterol - Has high blood pressure (%)
Blood Pressure & Cholesterol - Checking blood pressure at home (%)
Blood Pressure & Cholesterol - Frequently checking blood cholesterol (%)
Blood Pressure & Cholesterol - Has high cholesterol level (%)
Consumer Behavior - Money monthly spent on food at supermarket/grocery store
Consumer Behavior - Money monthly spent on food at other stores
Consumer Behavior - Money monthly spent on eating out
Consumer Behavior - Money monthly spent on carryout/delivered foods
Consumer Behavior - Income spent on food at supermarket/grocery store (%)
Consumer Behavior - Income spent on food at other stores (%)
Consumer Behavior - Income spent on eating out (%)
Consumer Behavior - Income spent on carryout/delivered foods (%)
Current Health Status - General health condition (%)
Current Health Status - Blood donors (%)
Current Health Status - Has blood ever tested for HIV virus (%)
Current Health Status - Left-handed people (%)
Dermatology - People using sunscreen (%)
Diabetes - Diabetics (%)
Diabetes - Had a blood test for high blood sugar (%)
Diabetes - People taking insulin (%)
Diet Behavior & Nutrition - Diet health (%)
Diet Behavior & Nutrition - Milk product consumption (# of products/month)
Diet Behavior & Nutrition - Meals not home prepared (#/week)
Diet Behavior & Nutrition - Meals from fast food or pizza place (#/week)
Diet Behavior & Nutrition - Ready-to-eat foods (#/month)
Diet Behavior & Nutrition - Frozen meals/pizza (#/month)
Drug Use - People that ever used marijuana or hashish (%)
Drug Use - Ever used hard drugs (%)
Drug Use - Ever used any form of cocaine (%)
Drug Use - Ever used heroin (%)
Drug Use - Ever used methamphetamine (%)
Health Insurance - People covered by health insurance (%)
Kidney Conditions-Urology - Avg. # of times urinating at night
Medical Conditions - People with asthma (%)
Medical Conditions - People with anemia (%)
Medical Conditions - People with psoriasis (%)
Medical Conditions - People with overweight (%)
Medical Conditions - Elderly people having difficulties in thinking or remembering (%)
Medical Conditions - People who ever received blood transfusion (%)
Medical Conditions - People having trouble seeing even with glass/contacts (%)
Medical Conditions - People with arthritis (%)
Medical Conditions - People with gout (%)
Medical Conditions - People with congestive heart failure (%)
Medical Conditions - People with coronary heart disease (%)
Medical Conditions - People with angina pectoris (%)
Medical Conditions - People who ever had heart attack (%)
Medical Conditions - People who ever had stroke (%)
Medical Conditions - People with emphysema (%)
Medical Conditions - People with thyroid problem (%)
Medical Conditions - People with chronic bronchitis (%)
Medical Conditions - People with any liver condition (%)
Medical Conditions - People who ever had cancer or malignancy (%)
Mental Health - People who have little interest in doing things (%)
Mental Health - People feeling down, depressed, or hopeless (%)
Mental Health - People who have trouble sleeping or sleeping too much (%)
Mental Health - People feeling tired or having little energy (%)
Mental Health - People with poor appetite or overeating (%)
Mental Health - People feeling bad about themself (%)
Mental Health - People who have trouble concentrating on things (%)
Mental Health - People moving or speaking slowly or too fast (%)
Mental Health - People having thoughts they would be better off dead (%)
Oral Health - Average years since last visit a dentist
Oral Health - People embarrassed because of mouth (%)
Oral Health - People with gum disease (%)
Oral Health - General health of teeth and gums (%)
Oral Health - Average days a week using dental floss/device
Oral Health - Average days a week using mouthwash for dental problem
Oral Health - Average number of teeth
Pesticide Use - Households using pesticides to control insects (%)
Pesticide Use - Households using pesticides to kill weeds (%)
Physical Activity - People doing vigorous-intensity work activities (%)
Physical Activity - People doing moderate-intensity work activities (%)
Physical Activity - People walking or bicycling (%)
Physical Activity - People doing vigorous-intensity recreational activities (%)
Physical Activity - People doing moderate-intensity recreational activities (%)
Physical Activity - Average hours a day doing sedentary activities
Physical Activity - Average hours a day watching TV or videos
Physical Activity - Average hours a day using computer
Physical Functioning - People having limitations keeping them from working (%)
Physical Functioning - People limited in amount of work they can do (%)
Physical Functioning - People that need special equipment to walk (%)
Physical Functioning - People experiencing confusion/memory problems (%)
Physical Functioning - People requiring special healthcare equipment (%)
Prescription Medications - Average number of prescription medicines taking
Preventive Aspirin Use - Adults 40+ taking low-dose aspirin (%)
Reproductive Health - Vaginal deliveries (%)
Reproductive Health - Cesarean deliveries (%)
Reproductive Health - Deliveries resulted in a live birth (%)
Reproductive Health - Pregnancies resulted in a delivery (%)
Reproductive Health - Women breastfeeding newborns (%)
Reproductive Health - Women that had a hysterectomy (%)
Reproductive Health - Women that had both ovaries removed (%)
Reproductive Health - Women that have ever taken birth control pills (%)
Reproductive Health - Women taking birth control pills (%)
Reproductive Health - Women that have ever used Depo-Provera or injectables (%)
Reproductive Health - Women that have ever used female hormones (%)
Sexual Behavior - People 18+ that ever had sex (vaginal, anal, or oral) (%)
Sexual Behavior - Males 18+ that ever had vaginal sex with a woman (%)
Sexual Behavior - Males 18+ that ever performed oral sex on a woman (%)
Sexual Behavior - Males 18+ that ever had anal sex with a woman (%)
Sexual Behavior - Males 18+ that ever had any sex with a man (%)
Sexual Behavior - Females 18+ that ever had vaginal sex with a man (%)
Sexual Behavior - Females 18+ that ever performed oral sex on a man (%)
Sexual Behavior - Females 18+ that ever had anal sex with a man (%)
Sexual Behavior - Females 18+ that ever had any kind of sex with a woman (%)
Sexual Behavior - Average age people first had sex
Sexual Behavior - Average number of female sex partners in lifetime (males 18+)
Sexual Behavior - Average number of female vaginal sex partners in lifetime (males 18+)
Sexual Behavior - Average age people first performed oral sex on a woman (18+)
Sexual Behavior - Average number of woman performed oral sex on in lifetime (18+)
Sexual Behavior - Average number of male sex partners in lifetime (males 18+)
Sexual Behavior - Average number of male anal sex partners in lifetime (males 18+)
Sexual Behavior - Average age people first performed oral sex on a man (18+)
Sexual Behavior - Average number of male oral sex partners in lifetime (18+)
Sexual Behavior - People using protection when performing oral sex (%)
Sexual Behavior - Average number of times people have vaginal or anal sex a year
Sexual Behavior - People having sex without condom (%)
Sexual Behavior - Average number of male sex partners in lifetime (females 18+)
Sexual Behavior - Average number of male vaginal sex partners in lifetime (females 18+)
Sexual Behavior - Average number of female sex partners in lifetime (females 18+)
Sexual Behavior - Circumcised males 18+ (%)
Sleep Disorders - Average hours sleeping at night
Sleep Disorders - People that has trouble sleeping (%)
Smoking-Cigarette Use - People smoking cigarettes (%)
Taste & Smell - People 40+ having problems with smell (%)
Taste & Smell - People 40+ having problems with taste (%)
Taste & Smell - People 40+ that ever had wisdom teeth removed (%)
Taste & Smell - People 40+ that ever had tonsils teeth removed (%)
Taste & Smell - People 40+ that ever had a loss of consciousness because of a head injury (%)
Taste & Smell - People 40+ that ever had a broken nose or other serious injury to face or skull (%)
Taste & Smell - People 40+ that ever had two or more sinus infections (%)
Weight - Average height (inches)
Weight - Average weight (pounds)
Weight - Average BMI
Weight - People that are obese (%)
Weight - People that ever were obese (%)
Weight - People trying to lose weight (%)
Urban population: 18,607
Rural population: 352
Estimated median house/condo value in 2022: $302,354
33948:
$302,354Florida:
$354,100
According to our research of Florida and other state lists, there were 31 registered sex offenders living in 33948 zip code as of April 27, 2024 . The ratio of all residents to sex offenders in zip code 33948 is 542 to 1.The ratio of registered sex offenders to all residents in this zip code is near the state average.
Median resident age: This zip code:
60.5 yearsFlorida median age:
42.7 years
Average household size: This zip code:
2.3 peopleFlorida:
2.5 people
Averages for the 2020 tax year for zip code 33948, filed in 2021:
Average Adjusted Gross Income (AGI) in 2020: $56,101 (Individual Income Tax Returns) Here:
$56,101State:
$82,200
Salary/wage: $44,571 (reported on 69.9% of returns )Here:
$44,571State:
$58,347
(% of AGI for various income ranges: 1101.5% for AGIs below $25k , 3191.5% for AGIs $25k-50k , 5592.1% for AGIs $50k-75k , 7804.9% for AGIs $75k-100k , 12962.4% for AGIs $100k-200k , 64631.7% for AGIs over 200k ) Taxable interest for individuals: $1,635 (reported on 31.6% of returns )This zip code:
$1,635Florida:
$4,272
(% of AGI for various income ranges: 30.9% for AGIs below $25k , 40.7% for AGIs $25k-50k , 81.8% for AGIs $50k-75k , 106.9% for AGIs $75k-100k , 198.4% for AGIs $100k-200k , 1460.0% for AGIs over 200k ) Ordinary dividends: $5,805 (reported on 21.5% of returns )(% of AGI for various income ranges: 52.9% for AGIs below $25k , 61.4% for AGIs $25k-50k , 150.9% for AGIs $50k-75k , 265.7% for AGIs $75k-100k , 571.0% for AGIs $100k-200k , 5303.3% for AGIs over 200k ) Net capital gain/loss in AGI: +$10,666 (reported on 19.8% of returns )Here:
+$10,666State:
+$62,983
(% of AGI for various income ranges: 14.5% for AGIs below $25k , 50.2% for AGIs $25k-50k , 176.0% for AGIs $50k-75k , 345.9% for AGIs $75k-100k , 1219.8% for AGIs $100k-200k , 13325.0% for AGIs over 200k ) Profit/loss from business: +$7,626 (reported on 14.4% of returns )Here:
+$7,626State:
+$9,719
(% of AGI for various income ranges: 101.5% for AGIs below $25k , 139.1% for AGIs $25k-50k , 180.5% for AGIs $50k-75k , 238.4% for AGIs $75k-100k , 379.4% for AGIs $100k-200k , 403.3% for AGIs over 200k ) Taxable individual retirement arrangement distribution: $20,616 (reported on 16.0% of returns )33948:
$20,616Florida:
$24,823
(% of AGI for various income ranges: 103.2% for AGIs below $25k , 183.9% for AGIs $25k-50k , 505.7% for AGIs $50k-75k , 941.8% for AGIs $75k-100k , 1702.7% for AGIs $100k-200k , 9585.0% for AGIs over 200k ) Total itemized deductions: $31,134 (reported on 5.7% of returns )Here:
$31,134State:
$45,393
(% of AGI for various income ranges: 65.4% for AGIs below $25k , 131.7% for AGIs $25k-50k , 321.1% for AGIs $50k-75k , 391.2% for AGIs $75k-100k , 762.4% for AGIs $100k-200k , 5185.0% for AGIs over 200k ) Charity contributions: $7,102 (reported on 4.7% of returns )(% of AGI for various income ranges: 7.4% for AGIs below $25k , 26.9% for AGIs $25k-50k , 43.6% for AGIs $50k-75k , 66.7% for AGIs $75k-100k , 167.3% for AGIs $100k-200k , 1183.3% for AGIs over 200k ) Taxes paid: $6,200 (reported on 5.4% of returns )(% of AGI for various income ranges: 9.7% for AGIs below $25k , 22.5% for AGIs $25k-50k , 58.5% for AGIs $50k-75k , 81.6% for AGIs $75k-100k , 152.7% for AGIs $100k-200k , 1105.0% for AGIs over 200k ) Earned income credit: $2,124 (reported on 15.1% of returns )(% of AGI for various income ranges: 84.6% for AGIs below $25k , 53.1% for AGIs $25k-50k , 1.8% for AGIs $50k-75k ) Percentage of individuals using paid preparers for their 2020 taxes: 93.1%(% for various income ranges: 92.6% for AGIs below $25k , 94.0% for AGIs $25k-50k , 94.1% for AGIs $50k-75k , 93.0% for AGIs $75k-100k , 90.4% for AGIs $100k-200k , 95.5% for AGIs over 200k )
Averages for the 2012 tax year for zip code 33948, filed in 2013:
Average Adjusted Gross Income (AGI) in 2012: $41,505 (Individual Income Tax Returns) Here:
$41,505State:
$60,316
Salary/wage: $34,073 (reported on 71.2% of returns )Here:
$34,073State:
$45,277
(% of AGI for various income ranges: 63.8% for AGIs below $25k , 66.9% for AGIs $25k-50k , 60.3% for AGIs $50k-75k , 51.6% for AGIs $75k-100k , 50.9% for AGIs $100k-200k , 53.0% for AGIs over 200k ) Taxable interest for individuals: $1,654 (reported on 35.5% of returns )This zip code:
$1,654Florida:
$3,587
(% of AGI for various income ranges: 1.8% for AGIs below $25k , 1.6% for AGIs $25k-50k , 1.4% for AGIs $50k-75k , 1.4% for AGIs $75k-100k , 1.2% for AGIs $100k-200k , 0.8% for AGIs over 200k ) Ordinary dividends: $4,478 (reported on 23.3% of returns )(% of AGI for various income ranges: 3.2% for AGIs below $25k , 1.7% for AGIs $25k-50k , 1.9% for AGIs $50k-75k , 2.6% for AGIs $75k-100k , 2.8% for AGIs $100k-200k , 4.2% for AGIs over 200k ) Net capital gain/loss in AGI: +$3,408 (reported on 18.6% of returns )Here:
+$3,408State:
+$33,493
(% of AGI for various income ranges: 0.3% for AGIs $25k-50k , 0.6% for AGIs $50k-75k , 1.5% for AGIs $75k-100k , 3.1% for AGIs $100k-200k , 7.0% for AGIs over 200k ) Profit/loss from business: +$7,797 (reported on 13.4% of returns )Here:
+$7,797State:
+$10,012
(% of AGI for various income ranges: 7.3% for AGIs below $25k , 2.9% for AGIs $25k-50k , 1.0% for AGIs $50k-75k , 1.5% for AGIs $75k-100k , 2.3% for AGIs $100k-200k ) Taxable individual retirement arrangement distribution: $16,051 (reported on 16.2% of returns )33948:
$16,051Florida:
$21,544
(% of AGI for various income ranges: 4.5% for AGIs below $25k , 4.4% for AGIs $25k-50k , 5.2% for AGIs $50k-75k , 7.7% for AGIs $75k-100k , 12.8% for AGIs $100k-200k ) Total itemized deductions: $18,763 (27% of AGI, reported on 23.6% of returns )Here:
$18,763State:
$25,533
Here:
26.8% of AGIState:
18.0% of AGI
(% of AGI for various income ranges: 12.6% for AGIs below $25k , 10.5% for AGIs $25k-50k , 10.3% for AGIs $50k-75k , 10.9% for AGIs $75k-100k , 10.6% for AGIs $100k-200k , 8.7% for AGIs over 200k ) Charity contributions: $2,807 (reported on 18.3% of returns )(% of AGI for various income ranges: 0.7% for AGIs below $25k , 1.0% for AGIs $25k-50k , 1.2% for AGIs $50k-75k , 1.6% for AGIs $75k-100k , 1.5% for AGIs $100k-200k , 1.7% for AGIs over 200k ) Taxes paid: $4,501 (reported on 23.0% of returns )(% of AGI for various income ranges: 2.4% for AGIs below $25k , 2.1% for AGIs $25k-50k , 2.2% for AGIs $50k-75k , 2.5% for AGIs $75k-100k , 3.1% for AGIs $100k-200k , 3.2% for AGIs over 200k ) Earned income credit: $2,069 (reported on 20.3% of returns )(% of AGI for various income ranges: 5.8% for AGIs below $25k , 1.0% for AGIs $25k-50k ) Percentage of individuals using paid preparers for their 2012 taxes: 47.1%(% for various income ranges: 41.8% for AGIs below $25k , 46.8% for AGIs $25k-50k , 54.5% for AGIs $50k-75k , 50.9% for AGIs $75k-100k , 60.5% for AGIs $100k-200k , 75.0% for AGIs over 200k )
Averages for the 2004 tax year for zip code 33948, filed in 2005:
Average Adjusted Gross Income (AGI) in 2004: $39,127 (Individual Income Tax Returns) Here:
$39,127State:
$50,523
Salary/wage: $31,172 (reported on 74.7% of returns )Here:
$31,172State:
$39,563
(% of AGI for various income ranges: 96.3% for AGIs below $10k , 66.3% for AGIs $10k-25k , 68.2% for AGIs $25k-50k , 61.5% for AGIs $50k-75k , 62.5% for AGIs $75k-100k , 42.4% for AGIs over 100k ) Taxable interest for individuals: $1,915 (reported on 48.8% of returns )This zip code:
$1,915Florida:
$3,211
(% of AGI for various income ranges: 8.6% for AGIs below $10k , 3.6% for AGIs $10k-25k , 2.1% for AGIs $25k-50k , 2.0% for AGIs $50k-75k , 2.0% for AGIs $75k-100k , 2.1% for AGIs over 100k ) Taxable dividends: $2,881 (reported on 27.4% of returns )(% of AGI for various income ranges: 6.5% for AGIs below $10k , 2.1% for AGIs $10k-25k , 1.5% for AGIs $25k-50k , 1.6% for AGIs $50k-75k , 1.7% for AGIs $75k-100k , 2.6% for AGIs over 100k ) Net capital gain/loss: +$13,349 (reported on 23.6% of returns )Here:
+$13,349State:
+$27,205
(% of AGI for various income ranges: -4.2% for AGIs below $10k , 0.5% for AGIs $10k-25k , 1.0% for AGIs $25k-50k , 3.4% for AGIs $50k-75k , 4.9% for AGIs $75k-100k , 24.6% for AGIs over 100k ) Profit/loss from business: +$11,293 (reported on 14.2% of returns )Here:
+$11,293State:
+$10,634
(% of AGI for various income ranges: 4.0% for AGIs below $10k , 5.9% for AGIs $10k-25k , 2.7% for AGIs $25k-50k , 3.1% for AGIs $50k-75k , 3.8% for AGIs $75k-100k , 5.4% for AGIs over 100k ) IRA payment deduction: $3,264 (reported on 3.0% of returns )33948:
$3,264Florida:
$3,082
(% of AGI for various income ranges: 0.5% for AGIs below $10k , 0.3% for AGIs $10k-25k , 0.3% for AGIs $25k-50k , 0.3% for AGIs $50k-75k , 0.2% for AGIs $75k-100k , 0.1% for AGIs over 100k ) Self-employed pension: $13,700 (reported on 0.3% of returns )Here:
$13,700Florida:
$15,857
Total itemized deductions: $18,319 (30% of AGI, reported on 32.5% of returns )Here:
$18,319State:
$20,370
Here:
29.6% of AGIState:
20.7% of AGI
(% of AGI for various income ranges: 30.9% for AGIs below $10k , 17.3% for AGIs $10k-25k , 17.1% for AGIs $25k-50k , 17.3% for AGIs $50k-75k , 14.8% for AGIs $75k-100k , 9.8% for AGIs over 100k ) Charity contributions deductions: $2,328 (4% of AGI, reported on 25.8% of returns )Here:
3.5% of AGIState:
3.8% of AGI
(% of AGI for various income ranges: 1.6% for AGIs below $10k , 1.3% for AGIs $10k-25k , 1.6% for AGIs $25k-50k , 1.6% for AGIs $50k-75k , 1.7% for AGIs $75k-100k , 1.4% for AGIs over 100k ) Total tax: $5,432 (reported on 72.7% of returns )(% of AGI for various income ranges: 2.7% for AGIs below $10k , 3.8% for AGIs $10k-25k , 6.3% for AGIs $25k-50k , 8.8% for AGIs $50k-75k , 10.7% for AGIs $75k-100k , 18.1% for AGIs over 100k ) Earned income credit: $1,679 (reported on 14.2% of returns )Percentage of individuals using paid preparers for their 2004 taxes: 57.2%(% for various income ranges: 50.0% for AGIs below $10k , 56.1% for AGIs $10k-25k , 58.2% for AGIs $25k-50k , 59.2% for AGIs $50k-75k , 60.9% for AGIs $75k-100k , 74.7% for AGIs over 100k )
Estimated median household income in 2022: This zip code:
$61,083Florida:
$69,303
Nearest zip codes: 33954 ,
33952 ,
33953 ,
34288 ,
33981 ,
34289 .
Port Charlotte Zip Code Map
Percentage of family households: This zip code:
29.3%Florida:
41.2%
Percentage of households with unmarried partners: This zip code:
3.2%Florida:
46.7%
Likely homosexual households (counted as self-reported same-sex unmarried-partner households)
Lesbian couples: 0.1% of all households Gay men: 0.0% of all households
Household received Food Stamps/SNAP in the past 12 months: 758Household did not receive Food Stamps/SNAP in the past 12 months: 7,541
Women who had a birth in the past 12 months: 302 (217 now married , 87 unmarried) Women who did not have a birth in the past 12 months: 2,060 (917 now married , 1,143 unmarried)
Housing units in zip code 33948 with a mortgage: 3,754 (257
second mortgage , 222
both second mortgage and home equity loan )
Houses without a mortgage: 505
Median monthly owner costs for units with a mortgage: $1,427
Median monthly owner costs for units without a mortgage: $573
Residents with income below the poverty level in 2022:
This zip code:
7.9%Whole state:
12.7%
Residents with income below 50% of the poverty level in 2022:
This zip code:
5.1%Whole state:
6.6%
Median number of rooms in houses and condos: Median number of rooms in apartments:
Year house built (houses)
9 2020 or later205 2010 to 20191,940 2000 to 20091,361 1990 to 19993,834 1980 to 19891,714 1970 to 1979228 1960 to 196967 1950 to 19590 1940 to 19490 1939 or earlier
Zip code 33948 household income distribution in 2022 174 Less than $10,000297 $10,000 to $14,999338 $15,000 to $19,999339 $20,000 to $24,999330 $25,000 to $29,999534 $30,000 to $34,999249 $35,000 to $39,999448 $40,000 to $44,999301 $45,000 to $49,9991,048 $50,000 to $59,999996 $60,000 to $74,9991,114 $75,000 to $99,999613 $100,000 to $124,999535 $125,000 to $149,999496 $150,000 to $199,999405 $200,000 or moreEstimate of home value of owner-occupied houses/condos in 2022 in zip code 33948 42 $10,000 to $14,99926 $15,000 to $19,99913 $20,000 to $24,99912 $25,000 to $29,99915 $30,000 to $34,9998 $35,000 to $39,99961 $40,000 to $49,99921 $80,000 to $89,99930 $90,000 to $99,999213 $100,000 to $124,999165 $125,000 to $149,999325 $150,000 to $174,999408 $175,000 to $199,9991,191 $200,000 to $249,999759 $250,000 to $299,9991,413 $300,000 to $399,999921 $400,000 to $499,999572 $500,000 to $749,999231 $750,000 to $999,99938 $1,000,000 to $1,499,99948 $2,000,000 or moreRent paid by renters in 2022 in zip code 33948 14 $200 to $24942 $400 to $44931 $650 to $6999 $750 to $799176 $800 to $89984 $900 to $999212 $1,000 to $1,249162 $1,250 to $1,499251 $1,500 to $1,99940 $2,000 to $2,49950 No cash rent
Median gross rent in 2022: $1,336.
Median price asked for vacant for-sale houses and condos in 2022: $386,335.
Estimated median house (or condo) value in 2022 for: White Non-Hispanic householders: $306,919Black or African American householders: $325,180American Indian or Alaska Native householders: $224,746Asian householders: $384,176Some other race householders: $238,793Two or more races householders: $237,037Hispanic or Latino householders: $311,835Estimated median house or condo value in 2022: $302,354
33948:
$302,354Florida:
$354,100
Lower value quartile - upper value quartile: $236,748 - $433,075
Mean price in 2022: Detached houses: $381,696Here:
$381,696State:
$500,941
Townhouses or other attached units: $1,029,103Here:
$1,029,103State:
$370,869
In 3-to-4-unit structures: $176,126Here:
$176,126State:
$309,944
In 5-or-more-unit structures: $132,259Here:
$132,259State:
$447,145
Mobile homes: $175,845Here:
$175,845State:
$113,202
Housing units in structures:
One, detached: 7,890One, attached: 6073 or 4: 2135 to 9: 29210 to 19: 40520 to 49: 7450 or more: 84Mobile homes: 97Unemployment : 5.7%
Means of transportation to work in zip code 33948 68.0% 4,891 Drove a car alone7.8% 564 Carpooled0.2% 11 Bus or trolley bus0.7% 50 Motorcycle1.3% 90 Bicycle0.4% 29 Walked1.0% 73 Other means22.3% 1,603 Worked at homeTravel time to work (commute) in zip code 33948 64 Less than 5 minutes373 5 to 9 minutes770 10 to 14 minutes1,264 15 to 19 minutes1,096 20 to 24 minutes283 25 to 29 minutes573 30 to 34 minutes98 35 to 39 minutes180 40 to 44 minutes482 45 to 59 minutes346 60 to 89 minutes189 90 or more minutes
Percentage of zip code residents living and working in this county: 74.6%
Household type by relationship:
Households: 18,960
Male householders: 3,972 (833 living alone ), Female householders: 4,313 (1,176 living alone )4,789 spouses (4,760 opposite-sex spouses ), 331 unmarried partners , (331 opposite-sex unmarried partners ), 3,633 children (3,368 natural , 180 adopted , 93 stepchildren ), 257 grandchildren , 158 brothers or sisters , 575 parents , 0 foster children , 183 other relatives , 521 non-relatives In group quarters: 309 (-1 institutionalized population )
Size of family households: 3,741 2-persons , 1,222 3-persons , 501 4-persons , 156 5-persons , 98 6-persons , 34 7-or-more-persons
Size of nonfamily households: 2,009 1-person , 472 2-persons , 38 3-persons
1,238 married couples with children. single-parent households (74 men , 376 women ).
87.8% of residents of 33948 zip code speak English at home. of residents speak Spanish at home (74% very well, 14% well, 5% not well, 6% not at all ).of residents speak other Indo-European language at home (80% very well, 11% well, 7% not well, 2% not at all ).of residents speak Asian or Pacific Island language at home (65% very well, 35% well ).of residents speak other language at home (85% very well, 15% not well ).
Foreign born population: 2,030 (10.7%)
(69.0%
of them are naturalized citizens )
This zip code:
10.7%Whole state:
21.7%
11% Honduras 10% Haiti 10% Grenada 8% Sweden 8% Malaysia 6% Romania 5% Serbia 18% English 17% American 12% German 6% Irish 6% Italian 3% Russian 3% Jamaican
Year of entry for the foreign-born population
442 2010 or later 214 2000 to 2009 544 1990 to 1999 1,154 Before 1990
There are
122 Medical Specialists in Zip Code 33948 .
Major facilities with environmental interests located in this zip code:
SHELL STATION MURDOCK (1783 TAMIAMI TRL in PORT CHARLOTTE, FL)
STATE MASTER (FDM) - CHAZ-FLD984223446, HAZARDOUS WASTE REGULATION PROGRAM Small Quantity Generators, between 100 kg and 1000 kg of hazardous waste/month (Resource Conservation and Recovery Act (tracking hazardous waste)) - notification Business SIC classification: GASOLINE SERVICE STATIONSOrganizations: SUPERAMERICA OF FLORIDA #8012, CASEY MCKENZIE, ADMIN (CONTACT/OWNER)
, MOTIVA ENTERPRISES LLC (CONTACT/OWNER)
Alternative names: SUPERAMERICA OF FLORIDA #8012
MEADOW PARK ELEMENTARY SCHOOL (3131 LAKE VIEW BOULEVARD in PORT CHARLOTTE, FL)
(Geographic Names Information System) (National Center for Education Statistics) - STATE ID-0141 Organizations: CHARLOTTE COUNTY SCHOOL DISTRICT (SCHOOL DISTRICT)
PORT CHARLOTTE HIGH SCHOOL (18200 TOLEDO BLADE BLVD. in PORT CHARLOTTE, FL)
(Geographic Names Information System) (National Center for Education Statistics) - STATE ID-0151 Organizations: CHARLOTTE COUNTY SCHOOL DISTRICT (SCHOOL DISTRICT)
MURDOCK MIDDLE SCHOOL (17325 MARINER WAY in PORT CHARLOTTE, FL)
(National Center for Education Statistics) - STATE ID-0211 Organizations: CHARLOTTE COUNTY SCHOOL DISTRICT (SCHOOL DISTRICT)
COUNTY SUPERINTENDENT'S OFFICE (1445 EDUCATION WAY in PORT CHARLOTTE, FL)
(National Center for Education Statistics) - STATE ID-9001 Organizations: CHARLOTTE COUNTY SCHOOL DISTRICT (SCHOOL DISTRICT)
ALGAR'S GREAT AMERICAN CLEANERS (1931 TAMIAMI TRAIL UNIT 9 in PORT CHARLOTTE, FL)
AIR MINOR (AIRS/AFS) (Resource Conservation and Recovery Act (tracking hazardous waste)) Business SIC classification: DRYCLEANING PLANTS, EXCEPT RUG CLEANINGOrganizations: ANTHONY CAMARCO, OWNER (CONTACT/OWNER)
CORAL CREEK CLUB LCC (GASPARILLA POINT in PLACIDA, FL)
National Pollutant Discharge Elimination System NON-MAJOR (Tracking pollutant discharge elimination systems) - permit National Pollutant Discharge Elimination System NON-MAJOR (Tracking pollutant discharge elimination systems) - permit Alternative names: QUALITY GRASSING & SERVICES
MCCALL SUBSTATION (7301 SAWYER CIRCLE ROAD in PORT CHARLOTTE, FL)
National Pollutant Discharge Elimination System NON-MAJOR (Tracking pollutant discharge elimination systems) - permit Organizations: DEAN BUSCH (CONTACT/OWNER)
COLONIAL BANK - PORT CHARLOTTE (19530 TOLEDO BLADE BLVD in PORT CHARLOTTE, FL)
National Pollutant Discharge Elimination System NON-MAJOR (Tracking pollutant discharge elimination systems) - permit Organizations: RICHARD BRYLANSKI (CONTACT/OWNER)
HOME DEPOT #250 (1800 TAMIAMI TR in PORT CHARLOTTE, FL)
(Resource Conservation and Recovery Act (tracking hazardous waste)) Organizations: KEITH ROSENBLUM (CONTACT/OWNER)
KC BUILDERS SUPPLY WAREHOUSE (19450 PEACHLAND BLVD in PORT CHARLOTTE, FL)
National Pollutant Discharge Elimination System NON-MAJOR (Tracking pollutant discharge elimination systems) - permit Organizations: JOE CALAFIORE (CONTACT/OWNER)
KREHLING INDUSTRIES - PLANT #1 (19300 PEACHLAND BLVD in PORT CHARLOTTE, FL)
National Pollutant Discharge Elimination System NON-MAJOR (Tracking pollutant discharge elimination systems) - permit Business SIC classification: READY-MIXED CONCRETEOrganizations: HENRY KREHLING (CONTACT/OWNER)
LOWE'S OF PORT CHARLOTTE (2000 TAMIAMI TRAIL in PORT CHARLOTTE, FL)
National Pollutant Discharge Elimination System NON-MAJOR (Tracking pollutant discharge elimination systems) - permit Organizations: HOWARD BAYLESS (CONTACT/OWNER)
Housing units lacking complete plumbing facilities: 0.3%
Housing units lacking complete kitchen facilities: 0.8%
97.1% Electricity 1.8% Utility gas 0.8% No fuel used
Population in 1990: 12,212. Population change in the 1990s: +2,480 (+20.3%).
Place of birth for U.S.-born residents:
This state: 3,035Northeast: 5,892Midwest: 4,873South: 1,843West: 885
51% of the 33948 zip code residents lived in the same house 5 years ago.
Out of people who lived in different houses, 39% lived in this county.
Out of people who lived in different counties, 50% lived in Florida.
88% of the 33948 zip code residents lived in the same house 1 year ago.
Out of people who lived in different houses, 24% moved from this county.
Out of people who lived in different houses, 26% moved from different county within same state.
Out of people who lived in different houses, 53% moved from different state.
Out of people who lived in different houses, 2% moved from abroad.
Private vs. public school enrollment:
Students in private schools in grades 1 to 8 (elementary and middle school): 74
Students in private schools in grades 9 to 12 (high school): 99
Students in private undergraduate colleges: 44
Occupation by median earnings in the past 12 months ($)
84,877 Health diagnosing and treating practitioners and other technical occupations 65,936 Architecture and engineering occupations 63,933 Law enforcement workers including supervisors 60,963 Health technologists and technicians 57,565 Business and financial operations occupations 51,575 Education, training, and library occupations
Top industries in this zip code by the number of employees in 2005:
Accommodation and Food Services: Full-Service Restaurants (100-249 employees: 3 establishments, 50-99 employees: 8 establishments, 20-49 employees: 1 establishment, 10-19 employees: 1 establishment, 5-9 employees: 4 establishments, 1-4 employees: 3 establishments)Accommodation and Food Services: Limited-Service Restaurants (50-99: 2, 20-49: 9, 5-9: 8)Health Care and Social Assistance: Nursing Care Facilities (100-249: 1, 1-4: 1)Finance and Insurance: Commercial Banking (20-49: 2, 10-19: 4, 5-9: 1, 1-4: 2)
People in group quarters in 2010:
104 people in nursing facilities/skilled-nursing facilities
47 people in emergency and transitional shelters (with sleeping facilities) for people experiencing homelessness
41 people in other noninstitutional facilities
12 people in workers' group living quarters and job corps centers
10 people in group homes intended for adults
People in group quarters in 2000:
132 people in nursing homes
78 people in other group homes
4 people in other noninstitutional group quarters
3 people in homes for the mentally ill
Fatal accident statistics in 2012:
Fatal accident count: 2Vehicles involved in fatal accidents: 3Fatal accidents caused by drunken drivers: 0Fatalities: 2Persons involved in fatal accidents: 4Pedestrians involved in fatal accidents: 0
Fatal accident statistics in 2011:
Fatal accident count: 1Vehicles involved in fatal accidents: 1Fatal accidents caused by drunken drivers: 0Fatalities: 1Persons involved in fatal accidents: 2Pedestrians involved in fatal accidents: 1
Home Mortgage Disclosure Act Aggregated Statistics For Year 2009(Based on 2 full and 10 partial tracts) A) FHA, FSA/RHS & VA B) Conventional C) Refinancings D) Home Improvement Loans F) Non-occupant Loans on G) Loans On Manufactured Number Average Value Number Average Value Number Average Value Number Average Value Number Average Value Number Average Value
LOANS ORIGINATED 72 $97,549 190 $130,698 209 $143,046 6 $74,330 129 $124,567 0 $0 APPLICATIONS APPROVED, NOT ACCEPTED 4 $68,142 23 $123,557 27 $220,923 4 $12,580 18 $110,136 1 $64,680 APPLICATIONS DENIED 29 $102,016 40 $159,425 231 $168,443 17 $71,979 66 $144,563 3 $136,403 APPLICATIONS WITHDRAWN 17 $84,839 21 $118,699 78 $147,744 6 $115,677 28 $116,912 0 $0 FILES CLOSED FOR INCOMPLETENESS 4 $94,315 4 $43,050 20 $109,768 0 $0 2 $27,045 0 $0
Aggregated Statistics For Year 2008(Based on 2 full and 10 partial tracts) A) FHA, FSA/RHS & VA B) Conventional C) Refinancings D) Home Improvement Loans F) Non-occupant Loans on G) Loans On Manufactured Number Average Value Number Average Value Number Average Value Number Average Value Number Average Value Number Average Value
LOANS ORIGINATED 64 $111,558 197 $153,748 288 $143,887 29 $94,890 122 $153,515 2 $54,010 APPLICATIONS APPROVED, NOT ACCEPTED 1 $262,020 28 $120,190 54 $199,527 14 $58,477 23 $185,370 0 $0 APPLICATIONS DENIED 22 $135,219 59 $177,470 306 $177,239 44 $44,926 74 $180,059 2 $71,150 APPLICATIONS WITHDRAWN 8 $118,294 19 $171,586 106 $177,145 12 $93,183 15 $187,003 1 $36,220 FILES CLOSED FOR INCOMPLETENESS 1 $71,580 12 $153,597 29 $187,247 3 $80,533 10 $159,799 0 $0
Aggregated Statistics For Year 2007(Based on 2 full and 10 partial tracts) A) FHA, FSA/RHS & VA B) Conventional C) Refinancings D) Home Improvement Loans F) Non-occupant Loans on G) Loans On Manufactured Number Average Value Number Average Value Number Average Value Number Average Value Number Average Value Number Average Value
LOANS ORIGINATED 39 $153,134 428 $180,016 714 $157,959 92 $81,208 232 $172,737 3 $50,020 APPLICATIONS APPROVED, NOT ACCEPTED 1 $93,230 72 $197,317 197 $179,771 25 $129,962 52 $192,038 2 $98,450 APPLICATIONS DENIED 9 $151,123 199 $216,951 670 $191,033 111 $92,542 134 $209,916 6 $56,867 APPLICATIONS WITHDRAWN 5 $131,056 68 $236,505 325 $195,858 23 $212,234 68 $251,429 0 $0 FILES CLOSED FOR INCOMPLETENESS 0 $0 31 $441,408 140 $210,938 8 $69,779 24 $264,700 0 $0
Aggregated Statistics For Year 2006(Based on 2 full and 10 partial tracts) A) FHA, FSA/RHS & VA B) Conventional C) Refinancings D) Home Improvement Loans F) Non-occupant Loans on G) Loans On Manufactured Number Average Value Number Average Value Number Average Value Number Average Value Number Average Value Number Average Value
LOANS ORIGINATED 38 $171,741 816 $177,600 1,245 $168,067 130 $120,474 462 $193,400 5 $59,554 APPLICATIONS APPROVED, NOT ACCEPTED 4 $174,530 141 $164,661 236 $162,115 27 $67,450 65 $178,915 7 $83,721 APPLICATIONS DENIED 3 $207,470 290 $213,291 673 $183,168 106 $92,201 137 $231,839 13 $71,110 APPLICATIONS WITHDRAWN 5 $130,076 154 $202,010 541 $178,539 34 $96,525 101 $243,454 2 $107,135 FILES CLOSED FOR INCOMPLETENESS 0 $0 21 $171,644 151 $175,545 8 $70,422 24 $183,283 0 $0
Aggregated Statistics For Year 2005(Based on 2 full and 10 partial tracts) A) FHA, FSA/RHS & VA B) Conventional C) Refinancings D) Home Improvement Loans F) Non-occupant Loans on G) Loans On Manufactured Number Average Value Number Average Value Number Average Value Number Average Value Number Average Value Number Average Value
LOANS ORIGINATED 38 $150,607 1,199 $177,448 1,259 $155,625 128 $94,954 574 $190,084 5 $51,808 APPLICATIONS APPROVED, NOT ACCEPTED 7 $154,626 145 $171,135 210 $150,319 38 $91,359 69 $162,153 5 $65,682 APPLICATIONS DENIED 11 $163,349 309 $167,662 575 $163,482 113 $86,873 140 $197,789 10 $88,438 APPLICATIONS WITHDRAWN 6 $166,972 169 $173,192 476 $146,850 65 $134,045 91 $163,660 0 $0 FILES CLOSED FOR INCOMPLETENESS 0 $0 55 $150,784 294 $154,025 13 $65,919 23 $223,347 0 $0
Aggregated Statistics For Year 2004(Based on 2 full and 10 partial tracts) A) FHA, FSA/RHS & VA B) Conventional C) Refinancings D) Home Improvement Loans F) Non-occupant Loans on G) Loans On Manufactured Number Average Value Number Average Value Number Average Value Number Average Value Number Average Value Number Average Value
LOANS ORIGINATED 53 $116,054 1,059 $155,759 913 $132,078 89 $66,087 520 $158,912 3 $91,327 APPLICATIONS APPROVED, NOT ACCEPTED 0 $0 133 $160,304 172 $127,290 16 $81,332 79 $151,297 4 $62,895 APPLICATIONS DENIED 4 $105,762 185 $150,576 506 $117,839 120 $47,913 72 $149,719 4 $47,690 APPLICATIONS WITHDRAWN 19 $131,156 115 $176,026 392 $121,107 22 $80,538 53 $175,253 1 $84,730 FILES CLOSED FOR INCOMPLETENESS 2 $143,325 20 $144,744 218 $132,579 14 $33,973 15 $214,625 0 $0
Aggregated Statistics For Year 2003(Based on 2 full and 10 partial tracts) A) FHA, FSA/RHS & VA B) Conventional C) Refinancings D) Home Improvement Loans F) Non-occupant Loans on Number Average Value Number Average Value Number Average Value Number Average Value Number Average Value
LOANS ORIGINATED 108 $109,156 1,026 $130,285 1,883 $110,227 85 $44,815 514 $125,343 APPLICATIONS APPROVED, NOT ACCEPTED 0 $0 85 $126,591 250 $113,323 34 $43,170 51 $101,849 APPLICATIONS DENIED 11 $104,902 131 $127,456 779 $106,299 110 $43,365 79 $111,068 APPLICATIONS WITHDRAWN 5 $79,312 80 $117,636 312 $112,179 17 $46,615 47 $126,928 FILES CLOSED FOR INCOMPLETENESS 3 $105,197 20 $137,989 90 $126,027 13 $61,405 15 $120,124
Aggregated Statistics For Year 2002(Based on 6 partial tracts) A) FHA, FSA/RHS & VA B) Conventional C) Refinancings D) Home Improvement Loans F) Non-occupant Loans on Number Average Value Number Average Value Number Average Value Number Average Value Number Average Value
LOANS ORIGINATED 21 $91,461 405 $145,570 504 $131,171 40 $58,422 212 $133,392 APPLICATIONS APPROVED, NOT ACCEPTED 0 $0 42 $176,245 80 $136,444 12 $29,086 34 $134,851 APPLICATIONS DENIED 3 $100,673 47 $106,006 159 $105,734 45 $36,448 26 $63,345 APPLICATIONS WITHDRAWN 1 $33,630 26 $121,491 82 $114,021 4 $8,228 6 $136,538 FILES CLOSED FOR INCOMPLETENESS 0 $0 17 $126,456 37 $116,920 0 $0 6 $123,052
Aggregated Statistics For Year 2001(Based on 6 partial tracts) A) FHA, FSA/RHS & VA B) Conventional C) Refinancings D) Home Improvement Loans E) Loans on Dwellings For 5+ Families F) Non-occupant Loans on Number Average Value Number Average Value Number Average Value Number Average Value Number Average Value Number Average Value
LOANS ORIGINATED 58 $81,738 360 $145,025 390 $111,641 44 $40,600 1 $1,188,530 156 $128,362 APPLICATIONS APPROVED, NOT ACCEPTED 0 $0 47 $144,664 45 $92,809 12 $50,429 0 $0 14 $72,043 APPLICATIONS DENIED 7 $82,727 22 $103,121 159 $84,122 29 $38,286 0 $0 16 $89,513 APPLICATIONS WITHDRAWN 4 $73,758 23 $243,499 104 $87,588 7 $35,847 0 $0 10 $114,167 FILES CLOSED FOR INCOMPLETENESS 1 $230,950 4 $138,520 19 $159,483 3 $42,320 0 $0 0 $0
Aggregated Statistics For Year 2000(Based on 6 partial tracts) A) FHA, FSA/RHS & VA B) Conventional C) Refinancings D) Home Improvement Loans F) Non-occupant Loans on Number Average Value Number Average Value Number Average Value Number Average Value Number Average Value
LOANS ORIGINATED 54 $75,346 288 $118,215 122 $79,509 48 $25,101 92 $97,399 APPLICATIONS APPROVED, NOT ACCEPTED 0 $0 28 $151,815 37 $83,519 20 $33,144 10 $182,415 APPLICATIONS DENIED 2 $57,875 51 $97,969 91 $61,306 36 $25,921 14 $106,099 APPLICATIONS WITHDRAWN 0 $0 23 $95,661 55 $65,341 1 $26,200 10 $94,133 FILES CLOSED FOR INCOMPLETENESS 0 $0 10 $94,480 13 $67,411 1 $17,560 4 $141,138
Aggregated Statistics For Year 1999(Based on 4 partial tracts) A) FHA, FSA/RHS & VA B) Conventional C) Refinancings D) Home Improvement Loans F) Non-occupant Loans on Number Average Value Number Average Value Number Average Value Number Average Value Number Average Value
LOANS ORIGINATED 87 $72,141 250 $85,597 236 $73,152 25 $20,286 80 $79,182 APPLICATIONS APPROVED, NOT ACCEPTED 4 $77,980 25 $63,489 65 $64,639 9 $20,949 10 $53,344 APPLICATIONS DENIED 7 $66,597 44 $68,087 153 $64,814 37 $25,976 8 $58,082 APPLICATIONS WITHDRAWN 6 $66,758 19 $75,237 99 $65,272 8 $43,424 7 $60,991 FILES CLOSED FOR INCOMPLETENESS 1 $68,380 8 $75,679 18 $73,139 1 $31,370 4 $59,848
Private Mortgage Insurance Companies Aggregated Statistics For Year 2009(Based on 2 full and 10 partial tracts) A) Conventional B) Refinancings C) Non-occupant Loans on Number Average Value Number Average Value Number Average Value
LOANS ORIGINATED 9 $151,354 0 $0 2 $53,720 APPLICATIONS APPROVED, NOT ACCEPTED 13 $205,112 1 $333,600 6 $251,228 APPLICATIONS DENIED 0 $0 0 $0 0 $0 APPLICATIONS WITHDRAWN 0 $0 1 $97,240 0 $0 FILES CLOSED FOR INCOMPLETENESS 0 $0 2 $326,505 2 $335,240
Aggregated Statistics For Year 2008(Based on 2 full and 10 partial tracts) A) Conventional B) Refinancings C) Non-occupant Loans on Number Average Value Number Average Value Number Average Value
LOANS ORIGINATED 44 $143,604 31 $156,219 21 $163,139 APPLICATIONS APPROVED, NOT ACCEPTED 40 $225,933 23 $223,918 24 $249,676 APPLICATIONS DENIED 11 $175,334 12 $227,086 11 $223,696 APPLICATIONS WITHDRAWN 5 $135,088 3 $383,010 4 $158,188 FILES CLOSED FOR INCOMPLETENESS 2 $219,210 2 $282,150 3 $179,667
Aggregated Statistics For Year 2007(Based on 2 full and 10 partial tracts) A) Conventional B) Refinancings C) Non-occupant Loans on Number Average Value Number Average Value Number Average Value
LOANS ORIGINATED 96 $190,094 45 $211,164 51 $222,037 APPLICATIONS APPROVED, NOT ACCEPTED 55 $235,985 20 $235,626 37 $241,635 APPLICATIONS DENIED 3 $364,570 6 $214,125 3 $188,450 APPLICATIONS WITHDRAWN 9 $238,033 8 $249,845 7 $267,264 FILES CLOSED FOR INCOMPLETENESS 0 $0 0 $0 0 $0
Aggregated Statistics For Year 2006(Based on 2 full and 10 partial tracts) A) Conventional B) Refinancings C) Non-occupant Loans on Number Average Value Number Average Value Number Average Value
LOANS ORIGINATED 83 $188,437 47 $203,474 30 $205,845 APPLICATIONS APPROVED, NOT ACCEPTED 34 $223,350 21 $210,073 23 $241,637 APPLICATIONS DENIED 1 $244,800 1 $122,230 1 $244,800 APPLICATIONS WITHDRAWN 16 $222,041 4 $199,820 14 $230,945 FILES CLOSED FOR INCOMPLETENESS 9 $278,611 0 $0 2 $232,800
Aggregated Statistics For Year 2005(Based on 2 full and 10 partial tracts) A) Conventional B) Refinancings C) Non-occupant Loans on Number Average Value Number Average Value Number Average Value
LOANS ORIGINATED 169 $188,401 29 $167,287 60 $203,492 APPLICATIONS APPROVED, NOT ACCEPTED 29 $182,238 15 $169,835 24 $150,977 APPLICATIONS DENIED 0 $0 0 $0 0 $0 APPLICATIONS WITHDRAWN 19 $207,562 2 $381,185 12 $229,844 FILES CLOSED FOR INCOMPLETENESS 0 $0 0 $0 0 $0
Aggregated Statistics For Year 2004(Based on 2 full and 10 partial tracts) A) Conventional B) Refinancings C) Non-occupant Loans on Number Average Value Number Average Value Number Average Value
LOANS ORIGINATED 184 $140,288 35 $127,588 84 $143,173 APPLICATIONS APPROVED, NOT ACCEPTED 41 $180,969 16 $161,519 22 $161,491 APPLICATIONS DENIED 1 $129,780 0 $0 0 $0 APPLICATIONS WITHDRAWN 10 $163,017 2 $109,500 3 $158,103 FILES CLOSED FOR INCOMPLETENESS 2 $186,165 0 $0 1 $324,140
Aggregated Statistics For Year 2003(Based on 2 full and 10 partial tracts) A) Conventional B) Refinancings C) Non-occupant Loans on Number Average Value Number Average Value Number Average Value
LOANS ORIGINATED 219 $132,490 74 $110,605 82 $130,819 APPLICATIONS APPROVED, NOT ACCEPTED 30 $127,546 32 $128,380 6 $142,393 APPLICATIONS DENIED 2 $191,940 2 $116,820 2 $168,330 APPLICATIONS WITHDRAWN 12 $132,307 22 $180,185 3 $227,350 FILES CLOSED FOR INCOMPLETENESS 0 $0 0 $0 0 $0
Aggregated Statistics For Year 2002(Based on 6 partial tracts) A) Conventional B) Refinancings C) Non-occupant Loans on Number Average Value Number Average Value Number Average Value
LOANS ORIGINATED 68 $123,376 32 $101,903 29 $124,178 APPLICATIONS APPROVED, NOT ACCEPTED 18 $141,218 14 $124,183 6 $140,897 APPLICATIONS DENIED 3 $108,233 2 $91,510 0 $0 APPLICATIONS WITHDRAWN 3 $179,770 1 $59,430 3 $162,307 FILES CLOSED FOR INCOMPLETENESS 0 $0 0 $0 0 $0
Aggregated Statistics For Year 2001(Based on 6 partial tracts) A) Conventional B) Refinancings C) Non-occupant Loans on Number Average Value Number Average Value Number Average Value
LOANS ORIGINATED 67 $119,258 17 $113,178 26 $108,838 APPLICATIONS APPROVED, NOT ACCEPTED 13 $152,626 0 $0 6 $162,767 APPLICATIONS DENIED 1 $218,800 3 $144,963 0 $0 APPLICATIONS WITHDRAWN 3 $135,060 5 $148,294 3 $135,060 FILES CLOSED FOR INCOMPLETENESS 0 $0 0 $0 0 $0
Aggregated Statistics For Year 2000(Based on 6 partial tracts) A) Conventional B) Refinancings C) Non-occupant Loans on Number Average Value Number Average Value Number Average Value
LOANS ORIGINATED 50 $126,710 8 $92,364 9 $113,058 APPLICATIONS APPROVED, NOT ACCEPTED 3 $72,513 0 $0 0 $0 APPLICATIONS DENIED 0 $0 0 $0 0 $0 APPLICATIONS WITHDRAWN 3 $120,900 0 $0 0 $0 FILES CLOSED FOR INCOMPLETENESS 0 $0 0 $0 0 $0
Aggregated Statistics For Year 1999(Based on 4 partial tracts) A) Conventional B) Refinancings C) Non-occupant Loans on Number Average Value Number Average Value Number Average Value
LOANS ORIGINATED 49 $87,000 12 $77,975 10 $72,071 APPLICATIONS APPROVED, NOT ACCEPTED 5 $71,758 4 $57,382 2 $60,900 APPLICATIONS DENIED 3 $77,113 1 $83,700 0 $0 APPLICATIONS WITHDRAWN 1 $38,980 1 $30,740 0 $0 FILES CLOSED FOR INCOMPLETENESS 0 $0 1 $123,320 0 $0
2002 - 2018 National Fire Incident Reporting System (NFIRS) incidents See full 2006 National Fire Incident Reporting System statistics for zip code 33948, Florida
Most common first names in zip code 33948 among deceased individuals Name Count Lived (average)
John 90 76.6 years Robert 86 72.5 years William 70 75.2 years Joseph 55 74.6 years George 55 78.6 years James 54 75.5 years Charles 54 73.7 years Mary 44 79.2 years Dorothy 40 80.6 years Edward 38 73.9 years
Most common last names in zip code 33948 among deceased individuals Last name Count Lived (average)
Johnson 21 76.6 years Williams 17 76.7 years Smith 15 78.1 years Wilson 13 76.0 years Brown 13 72.3 years Davis 12 76.2 years Baker 12 75.5 years Thomas 10 74.7 years Harris 9 78.9 years Moore 9 78.9 years
Businesses in zip code 33948
Name Count Name Count
AT&T 1 Nike 11 Advance Auto Parts 1 Office Depot 1 Aeropostale 1 Old Navy 1 American Eagle Outfitters 1 Olive Garden 1 Applebee's 1 Outback 1 Arby's 1 Outback Steakhouse 1 Bath & Body Works 1 Pac Sun 1 Blockbuster 1 Panera Bread 1 Burger King 1 Papa John's Pizza 1 Charlotte Russe 1 Payless 1 Chick-Fil-A 2 PetSmart 1 Circle K 1 Publix Super Markets 1 Curves 1 RadioShack 1 Days Inn 1 Red Lobster 1 Dennys 1 Ruby Tuesday 1 Domino's Pizza 1 Sam's Club 1 FedEx 6 Sears 2 Foot Locker 1 Spencer Gifts 1 GNC 1 Sprint Nextel 2 GameStop 1 Staples 1 H&R Block 1 Starbucks 2 Havertys Furniture 1 Steak 'n Shake 1 Hollister Co. 1 Subway 2 Home Depot 1 T-Mobile 3 IHOP 1 Taco Bell 1 JCPenney 1 Target 1 Jones New York 3 Toys"R"Us 2 Journeys 1 U-Haul 1 Kincaid 1 UPS 10 Kmart 1 Value City Furniture 1 Kohl's 1 Vans 2 La-Z-Boy 1 Verizon Wireless 2 Lane Furniture 1 Victoria's Secret 1 Lowe's 1 Walgreens 1 Macy's 1 Walmart 1 MasterBrand Cabinets 2 Wet Seal 1 McDonald's 1 YMCA 2 Motherhood Maternity 1
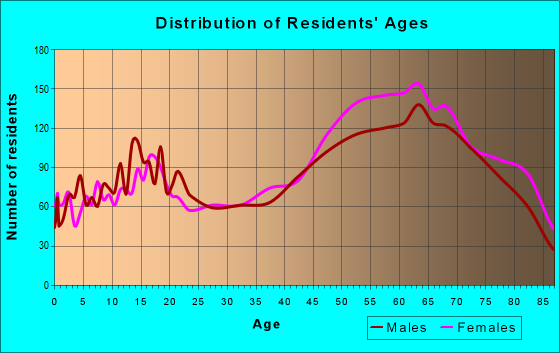
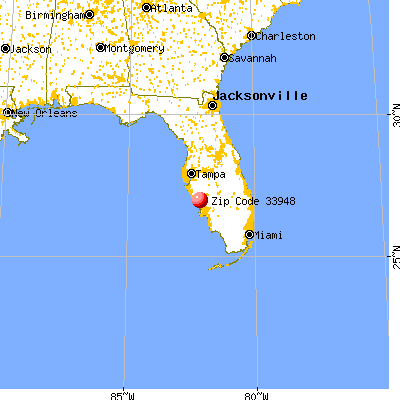


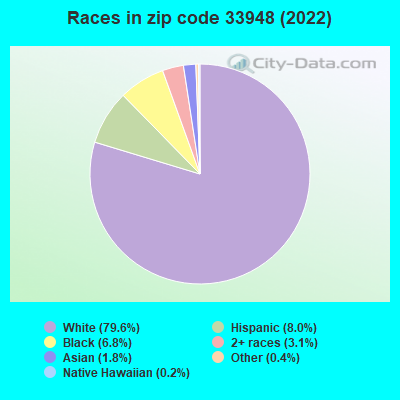


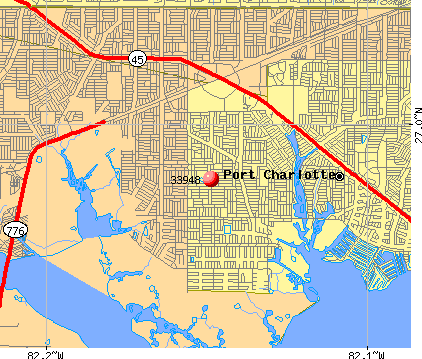 Nearest zip codes: 33954, 33952, 33953, 34288, 33981, 34289.
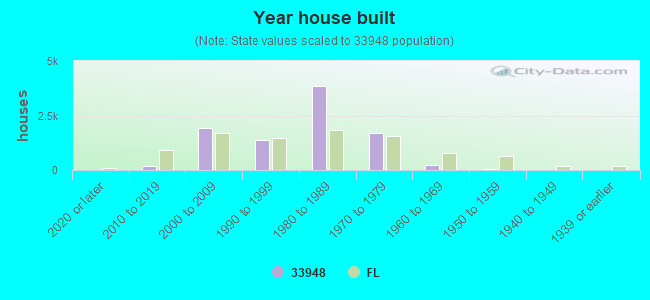
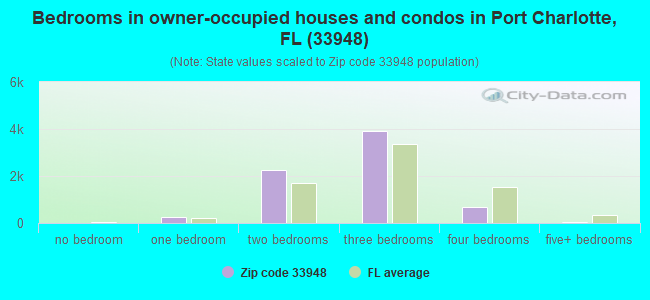
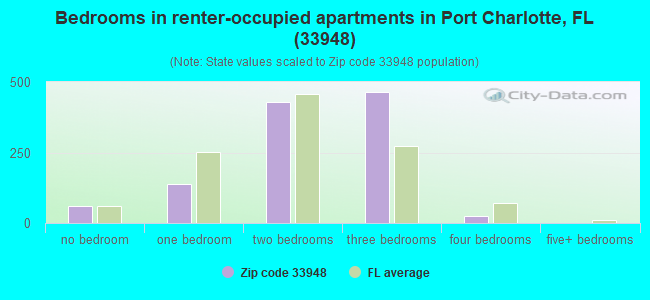
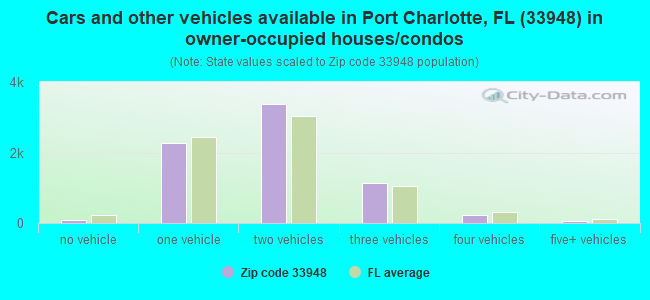
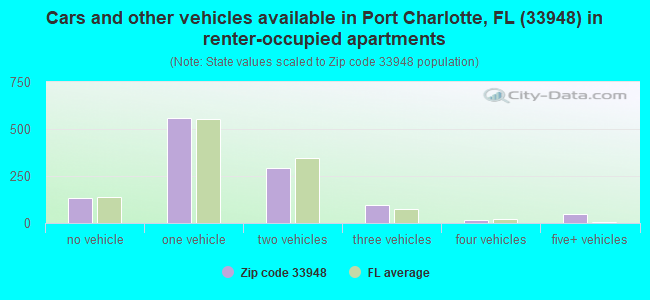


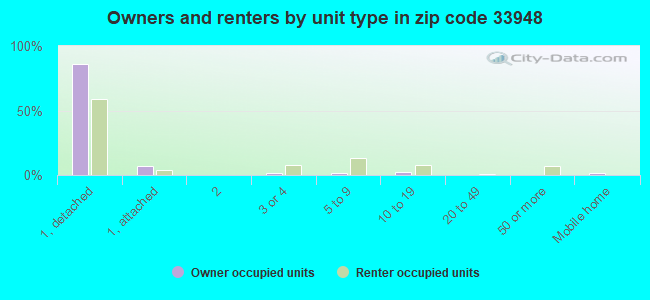
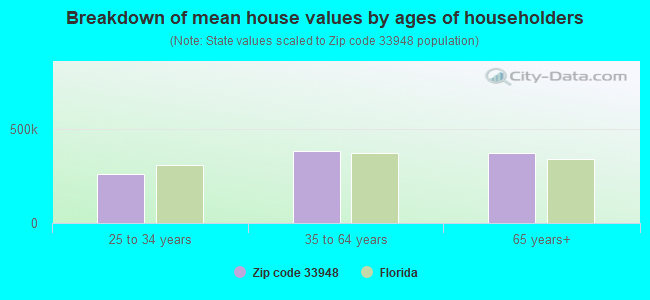


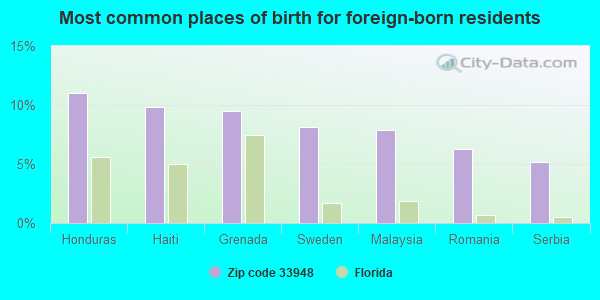
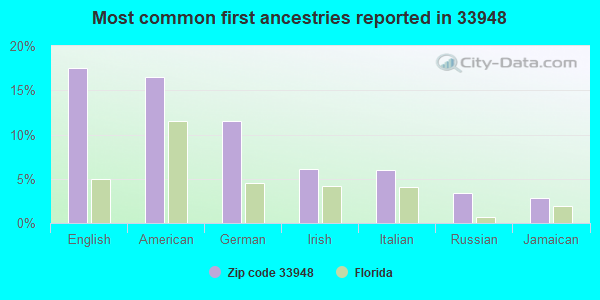
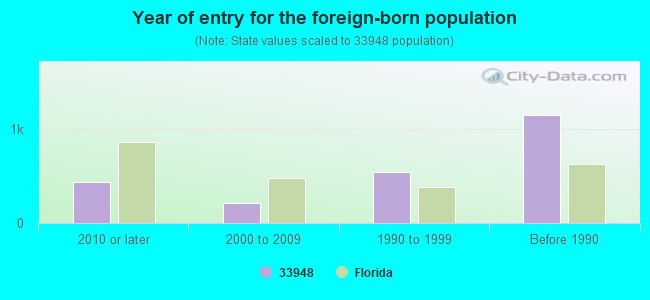
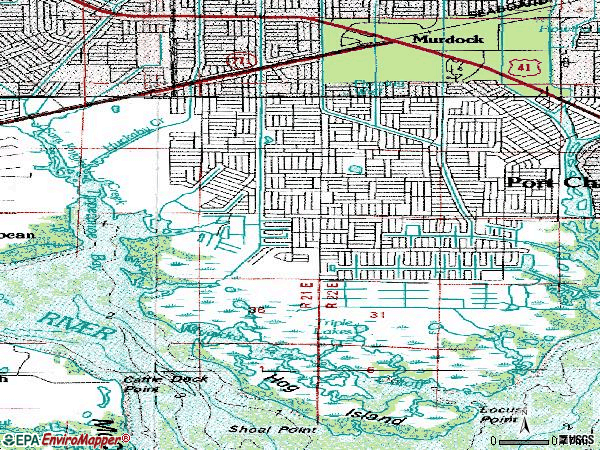

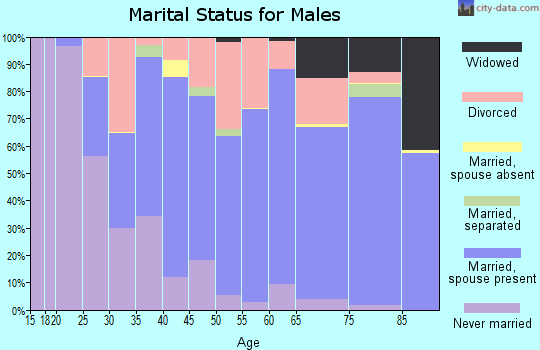
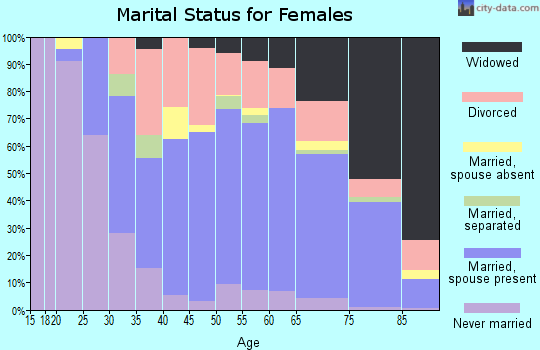
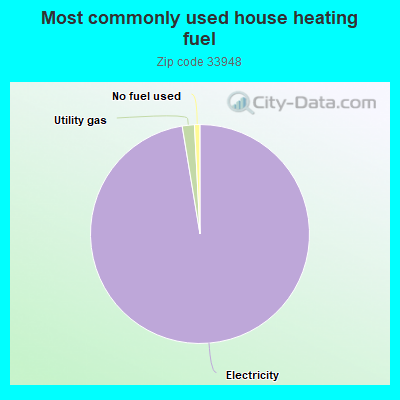

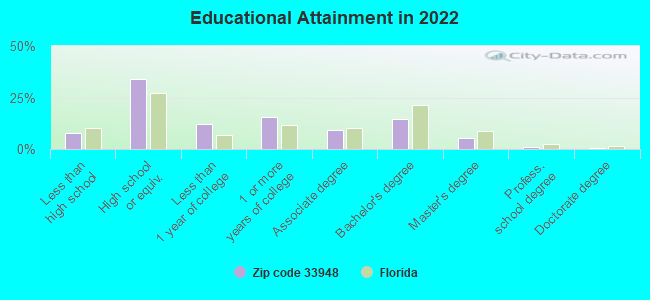
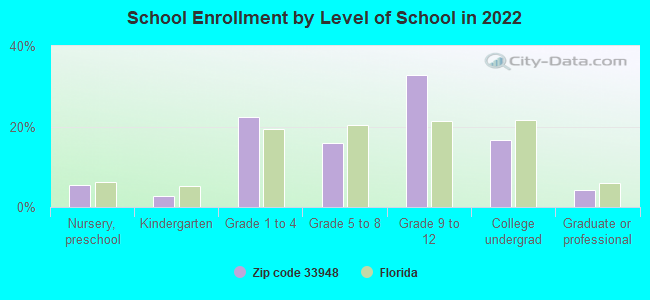
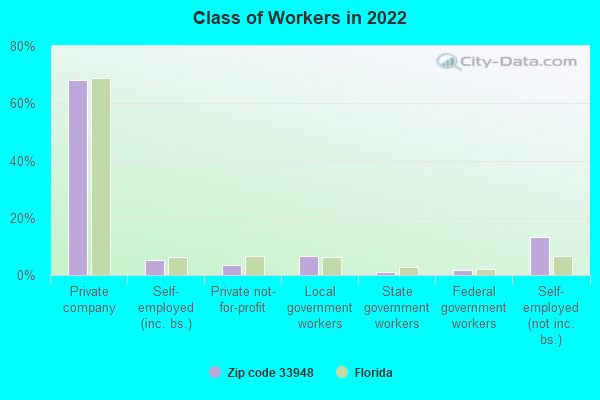
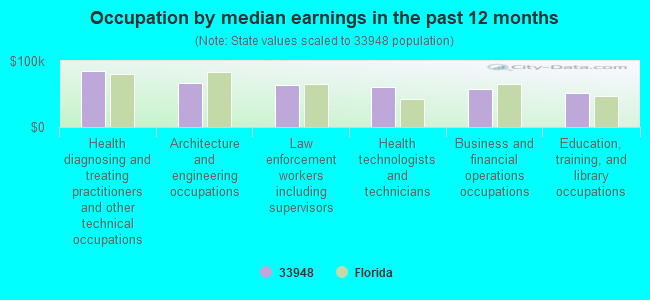
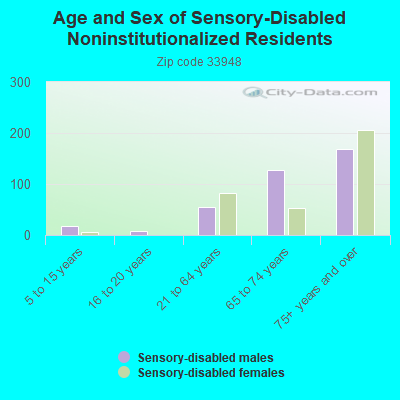
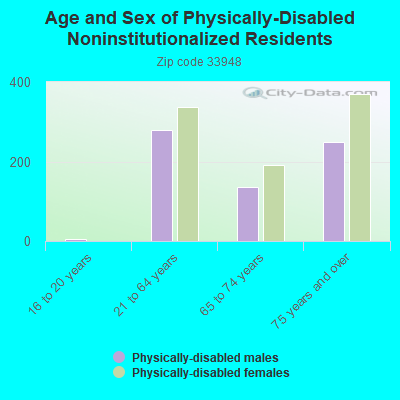
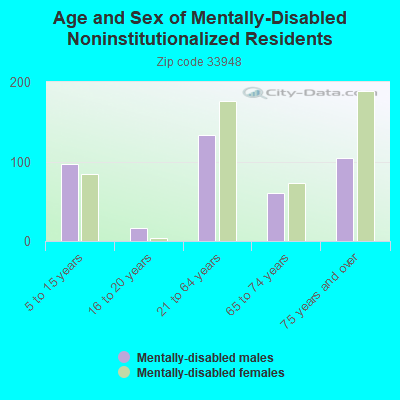
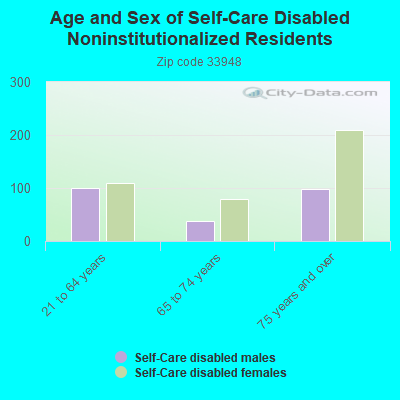
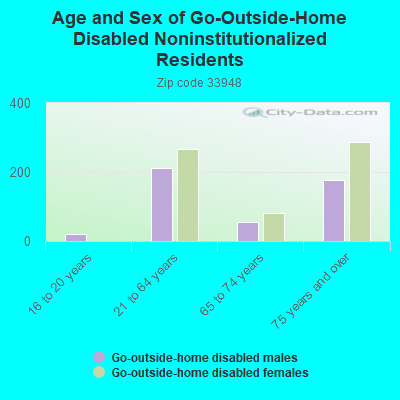
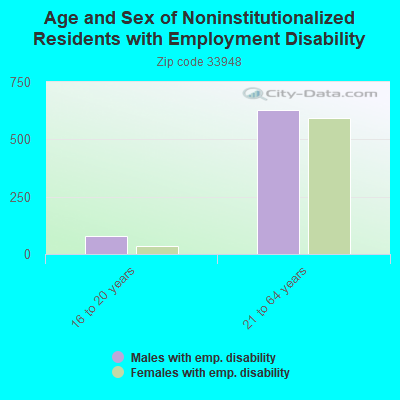
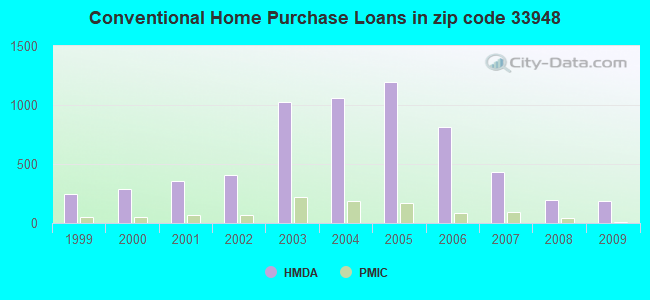
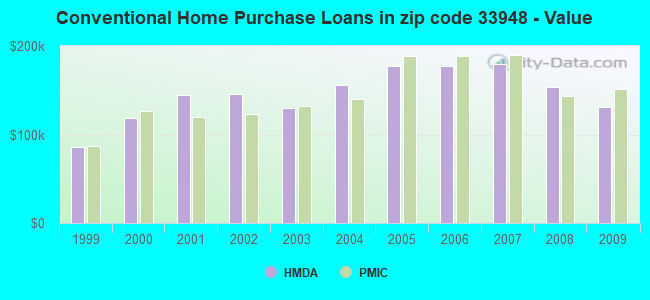
 According to the data from the years 2002 - 2018 the average number of fire incidents per year is 73. The highest number of fires - 123 took place in 2004, and the least - 0 in 2003. The data has a dropping trend.
 When looking into fire subcategories, the most incidents belonged to: Outside Fires (58.0%), and Structure Fires (17.5%).