Estimated zip code population in 2022: 35,710
Zip code population in 2010: 28,382
Zip code population in 2000: 30,543
Houses and condos: 18,119
Renter-occupied apartments: 3,719
% of renters here:
24%State:
33%
March 2022 cost of living index in zip code 33952: 90.4
(less than average, U.S. average is 100)
Land area: 11.0
sq. mi.
Water area: 2.4
sq. mi.
Population density: 3,233 people per square mile (average).
OSM Map
General Map
Google Map
MSN Map
OSM Map
General Map
Google Map
MSN Map
OSM Map
General Map
Google Map
MSN Map
OSM Map
General Map
Google Map
MSN Map
Please wait while loading the map...
Real estate property taxes paid for housing units in 2022:
This zip code:
0.7% ($1,825)Florida:
0.7% ($2,529)
Median real estate property taxes paid for housing units with mortgages in 2022: $1,857 (0.8%)
Median real estate property taxes paid for housing units with no mortgage in 2022: $1,799 (0.7%)
Profiles of local businesses
Business Search - 14 Million verified businesses
Males: 17,581 Females: 18,129
For population 25 years and over in 33952:
High school or higher: 88.4%Bachelor's degree or higher: 20.6%Graduate or professional degree: 6.8%Unemployed: 5.9%Mean travel time to work (commute): 25.4 minutes
For population 15 years and over in 33952:
Never married: 29.0%Now married: 46.3%Separated: 1.4%Widowed: 8.6%Divorced: 14.7%
Zip code 33952 compared to state average:
Black race population percentage below state average. Hispanic race population percentage below state average. Median age significantly above state average. Foreign-born population percentage below state average. Length of stay since moving in above state average. Percentage of population with a bachelor's degree or higher below state average. 26,687 74.7% White 4,922 13.8% Hispanic or Latino 2,240 6.3% Black 1,042 2.9% Two or more races 498 1.4% Asian 312 0.9% Some other race 7 0.02% American Indian
Data:
Median household income ($)
Median household income (% change since 2000)
Household income diversity
Ratio of average income to average house value (%)
Ratio of average income to average rent
Median household income ($) - White
Median household income ($) - Black or African American
Median household income ($) - Asian
Median household income ($) - Hispanic or Latino
Median household income ($) - American Indian and Alaska Native
Median household income ($) - Multirace
Median household income ($) - Other Race
Median household income for houses/condos with a mortgage ($)
Median household income for apartments without a mortgage ($)
Races - White alone (%)
Races - White alone (% change since 2000)
Races - Black alone (%)
Races - Black alone (% change since 2000)
Races - American Indian alone (%)
Races - American Indian alone (% change since 2000)
Races - Asian alone (%)
Races - Asian alone (% change since 2000)
Races - Hispanic (%)
Races - Hispanic (% change since 2000)
Races - Native Hawaiian and Other Pacific Islander alone (%)
Races - Native Hawaiian and Other Pacific Islander alone (% change since 2000)
Races - Two or more races (%)
Races - Two or more races (% change since 2000)
Races - Other race alone (%)
Races - Other race alone (% change since 2000)
Racial diversity
Unemployment (%)
Unemployment (% change since 2000)
Unemployment (%) - White
Unemployment (%) - Black or African American
Unemployment (%) - Asian
Unemployment (%) - Hispanic or Latino
Unemployment (%) - American Indian and Alaska Native
Unemployment (%) - Multirace
Unemployment (%) - Other Race
Population density (people per square mile)
Population - Males (%)
Population - Females (%)
Population - Males (%) - White
Population - Males (%) - Black or African American
Population - Males (%) - Asian
Population - Males (%) - Hispanic or Latino
Population - Males (%) - American Indian and Alaska Native
Population - Males (%) - Multirace
Population - Males (%) - Other Race
Population - Females (%) - White
Population - Females (%) - Black or African American
Population - Females (%) - Asian
Population - Females (%) - Hispanic or Latino
Population - Females (%) - American Indian and Alaska Native
Population - Females (%) - Multirace
Population - Females (%) - Other Race
Coronavirus confirmed cases (Apr 27, 2024)
Deaths caused by coronavirus (Apr 27, 2024)
Coronavirus confirmed cases (per 100k population) (Apr 27, 2024)
Deaths caused by coronavirus (per 100k population) (Apr 27, 2024)
Daily increase in number of cases (Apr 27, 2024)
Weekly increase in number of cases (Apr 27, 2024)
Cases doubled (in days) (Apr 27, 2024)
Hospitalized patients (Apr 18, 2022)
Negative test results (Apr 18, 2022)
Total test results (Apr 18, 2022)
COVID Vaccine doses distributed (per 100k population) (Sep 19, 2023)
COVID Vaccine doses administered (per 100k population) (Sep 19, 2023)
COVID Vaccine doses distributed (Sep 19, 2023)
COVID Vaccine doses administered (Sep 19, 2023)
Likely homosexual households (%)
Likely homosexual households (% change since 2000)
Likely homosexual households - Lesbian couples (%)
Likely homosexual households - Lesbian couples (% change since 2000)
Likely homosexual households - Gay men (%)
Likely homosexual households - Gay men (% change since 2000)
Cost of living index
Median gross rent ($)
Median contract rent ($)
Median monthly housing costs ($)
Median house or condo value ($)
Median house or condo value ($ change since 2000)
Mean house or condo value by units in structure - 1, detached ($)
Mean house or condo value by units in structure - 1, attached ($)
Mean house or condo value by units in structure - 2 ($)
Mean house or condo value by units in structure by units in structure - 3 or 4 ($)
Mean house or condo value by units in structure - 5 or more ($)
Mean house or condo value by units in structure - Boat, RV, van, etc. ($)
Mean house or condo value by units in structure - Mobile home ($)
Median house or condo value ($) - White
Median house or condo value ($) - Black or African American
Median house or condo value ($) - Asian
Median house or condo value ($) - Hispanic or Latino
Median house or condo value ($) - American Indian and Alaska Native
Median house or condo value ($) - Multirace
Median house or condo value ($) - Other Race
Median resident age
Resident age diversity
Median resident age - Males
Median resident age - Females
Median resident age - White
Median resident age - Black or African American
Median resident age - Asian
Median resident age - Hispanic or Latino
Median resident age - American Indian and Alaska Native
Median resident age - Multirace
Median resident age - Other Race
Median resident age - Males - White
Median resident age - Males - Black or African American
Median resident age - Males - Asian
Median resident age - Males - Hispanic or Latino
Median resident age - Males - American Indian and Alaska Native
Median resident age - Males - Multirace
Median resident age - Males - Other Race
Median resident age - Females - White
Median resident age - Females - Black or African American
Median resident age - Females - Asian
Median resident age - Females - Hispanic or Latino
Median resident age - Females - American Indian and Alaska Native
Median resident age - Females - Multirace
Median resident age - Females - Other Race
Commute - mean travel time to work (minutes)
Travel time to work - Less than 5 minutes (%)
Travel time to work - Less than 5 minutes (% change since 2000)
Travel time to work - 5 to 9 minutes (%)
Travel time to work - 5 to 9 minutes (% change since 2000)
Travel time to work - 10 to 19 minutes (%)
Travel time to work - 10 to 19 minutes (% change since 2000)
Travel time to work - 20 to 29 minutes (%)
Travel time to work - 20 to 29 minutes (% change since 2000)
Travel time to work - 30 to 39 minutes (%)
Travel time to work - 30 to 39 minutes (% change since 2000)
Travel time to work - 40 to 59 minutes (%)
Travel time to work - 40 to 59 minutes (% change since 2000)
Travel time to work - 60 to 89 minutes (%)
Travel time to work - 60 to 89 minutes (% change since 2000)
Travel time to work - 90 or more minutes (%)
Travel time to work - 90 or more minutes (% change since 2000)
Marital status - Never married (%)
Marital status - Now married (%)
Marital status - Separated (%)
Marital status - Widowed (%)
Marital status - Divorced (%)
Median family income ($)
Median family income (% change since 2000)
Median non-family income ($)
Median non-family income (% change since 2000)
Median per capita income ($)
Median per capita income (% change since 2000)
Median family income ($) - White
Median family income ($) - Black or African American
Median family income ($) - Asian
Median family income ($) - Hispanic or Latino
Median family income ($) - American Indian and Alaska Native
Median family income ($) - Multirace
Median family income ($) - Other Race
Median year house/condo built
Median year apartment built
Year house built - Built 2005 or later (%)
Year house built - Built 2000 to 2004 (%)
Year house built - Built 1990 to 1999 (%)
Year house built - Built 1980 to 1989 (%)
Year house built - Built 1970 to 1979 (%)
Year house built - Built 1960 to 1969 (%)
Year house built - Built 1950 to 1959 (%)
Year house built - Built 1940 to 1949 (%)
Year house built - Built 1939 or earlier (%)
Average household size
Household density (households per square mile)
Average household size - White
Average household size - Black or African American
Average household size - Asian
Average household size - Hispanic or Latino
Average household size - American Indian and Alaska Native
Average household size - Multirace
Average household size - Other Race
Occupied housing units (%)
Vacant housing units (%)
Owner occupied housing units (%)
Renter occupied housing units (%)
Vacancy status - For rent (%)
Vacancy status - For sale only (%)
Vacancy status - Rented or sold, not occupied (%)
Vacancy status - For seasonal, recreational, or occasional use (%)
Vacancy status - For migrant workers (%)
Vacancy status - Other vacant (%)
Residents with income below the poverty level (%)
Residents with income below 50% of the poverty level (%)
Children below poverty level (%)
Poor families by family type - Married-couple family (%)
Poor families by family type - Male, no wife present (%)
Poor families by family type - Female, no husband present (%)
Poverty status for native-born residents (%)
Poverty status for foreign-born residents (%)
Poverty among high school graduates not in families (%)
Poverty among people who did not graduate high school not in families (%)
Residents with income below the poverty level (%) - White
Residents with income below the poverty level (%) - Black or African American
Residents with income below the poverty level (%) - Asian
Residents with income below the poverty level (%) - Hispanic or Latino
Residents with income below the poverty level (%) - American Indian and Alaska Native
Residents with income below the poverty level (%) - Multirace
Residents with income below the poverty level (%) - Other Race
Air pollution - Air Quality Index (AQI)
Air pollution - CO
Air pollution - NO2
Air pollution - SO2
Air pollution - Ozone
Air pollution - PM10
Air pollution - PM25
Air pollution - Pb
Crime - Murders per 100,000 population
Crime - Rapes per 100,000 population
Crime - Robberies per 100,000 population
Crime - Assaults per 100,000 population
Crime - Burglaries per 100,000 population
Crime - Thefts per 100,000 population
Crime - Auto thefts per 100,000 population
Crime - Arson per 100,000 population
Crime - City-data.com crime index
Crime - Violent crime index
Crime - Property crime index
Crime - Murders per 100,000 population (5 year average)
Crime - Rapes per 100,000 population (5 year average)
Crime - Robberies per 100,000 population (5 year average)
Crime - Assaults per 100,000 population (5 year average)
Crime - Burglaries per 100,000 population (5 year average)
Crime - Thefts per 100,000 population (5 year average)
Crime - Auto thefts per 100,000 population (5 year average)
Crime - Arson per 100,000 population (5 year average)
Crime - City-data.com crime index (5 year average)
Crime - Violent crime index (5 year average)
Crime - Property crime index (5 year average)
1996 Presidential Elections Results (%) - Democratic Party (Clinton)
1996 Presidential Elections Results (%) - Republican Party (Dole)
1996 Presidential Elections Results (%) - Other
2000 Presidential Elections Results (%) - Democratic Party (Gore)
2000 Presidential Elections Results (%) - Republican Party (Bush)
2000 Presidential Elections Results (%) - Other
2004 Presidential Elections Results (%) - Democratic Party (Kerry)
2004 Presidential Elections Results (%) - Republican Party (Bush)
2004 Presidential Elections Results (%) - Other
2008 Presidential Elections Results (%) - Democratic Party (Obama)
2008 Presidential Elections Results (%) - Republican Party (McCain)
2008 Presidential Elections Results (%) - Other
2012 Presidential Elections Results (%) - Democratic Party (Obama)
2012 Presidential Elections Results (%) - Republican Party (Romney)
2012 Presidential Elections Results (%) - Other
2016 Presidential Elections Results (%) - Democratic Party (Clinton)
2016 Presidential Elections Results (%) - Republican Party (Trump)
2016 Presidential Elections Results (%) - Other
2020 Presidential Elections Results (%) - Democratic Party (Biden)
2020 Presidential Elections Results (%) - Republican Party (Trump)
2020 Presidential Elections Results (%) - Other
Ancestries Reported - Arab (%)
Ancestries Reported - Czech (%)
Ancestries Reported - Danish (%)
Ancestries Reported - Dutch (%)
Ancestries Reported - English (%)
Ancestries Reported - French (%)
Ancestries Reported - French Canadian (%)
Ancestries Reported - German (%)
Ancestries Reported - Greek (%)
Ancestries Reported - Hungarian (%)
Ancestries Reported - Irish (%)
Ancestries Reported - Italian (%)
Ancestries Reported - Lithuanian (%)
Ancestries Reported - Norwegian (%)
Ancestries Reported - Polish (%)
Ancestries Reported - Portuguese (%)
Ancestries Reported - Russian (%)
Ancestries Reported - Scotch-Irish (%)
Ancestries Reported - Scottish (%)
Ancestries Reported - Slovak (%)
Ancestries Reported - Subsaharan African (%)
Ancestries Reported - Swedish (%)
Ancestries Reported - Swiss (%)
Ancestries Reported - Ukrainian (%)
Ancestries Reported - United States (%)
Ancestries Reported - Welsh (%)
Ancestries Reported - West Indian (%)
Ancestries Reported - Other (%)
Educational Attainment - No schooling completed (%)
Educational Attainment - Less than high school (%)
Educational Attainment - High school or equivalent (%)
Educational Attainment - Less than 1 year of college (%)
Educational Attainment - 1 or more years of college (%)
Educational Attainment - Associate degree (%)
Educational Attainment - Bachelor's degree (%)
Educational Attainment - Master's degree (%)
Educational Attainment - Professional school degree (%)
Educational Attainment - Doctorate degree (%)
School Enrollment - Nursery, preschool (%)
School Enrollment - Kindergarten (%)
School Enrollment - Grade 1 to 4 (%)
School Enrollment - Grade 5 to 8 (%)
School Enrollment - Grade 9 to 12 (%)
School Enrollment - College undergrad (%)
School Enrollment - Graduate or professional (%)
School Enrollment - Not enrolled in school (%)
School enrollment - Public schools (%)
School enrollment - Private schools (%)
School enrollment - Not enrolled (%)
Median number of rooms in houses and condos
Median number of rooms in apartments
Housing units lacking complete plumbing facilities (%)
Housing units lacking complete kitchen facilities (%)
Density of houses
Urban houses (%)
Rural houses (%)
Households with people 60 years and over (%)
Households with people 65 years and over (%)
Households with people 75 years and over (%)
Households with one or more nonrelatives (%)
Households with no nonrelatives (%)
Population in households (%)
Family households (%)
Nonfamily households (%)
Population in families (%)
Family households with own children (%)
Median number of bedrooms in owner occupied houses
Mean number of bedrooms in owner occupied houses
Median number of bedrooms in renter occupied houses
Mean number of bedrooms in renter occupied houses
Median number of vehichles in owner occupied houses
Mean number of vehichles in owner occupied houses
Median number of vehichles in renter occupied houses
Mean number of vehichles in renter occupied houses
Mortgage status - with mortgage (%)
Mortgage status - with second mortgage (%)
Mortgage status - with home equity loan (%)
Mortgage status - with both second mortgage and home equity loan (%)
Mortgage status - without a mortgage (%)
Average family size
Average family size - White
Average family size - Black or African American
Average family size - Asian
Average family size - Hispanic or Latino
Average family size - American Indian and Alaska Native
Average family size - Multirace
Average family size - Other Race
Geographical mobility - Same house 1 year ago (%)
Geographical mobility - Moved within same county (%)
Geographical mobility - Moved from different county within same state (%)
Geographical mobility - Moved from different state (%)
Geographical mobility - Moved from abroad (%)
Place of birth - Born in state of residence (%)
Place of birth - Born in other state (%)
Place of birth - Native, outside of US (%)
Place of birth - Foreign born (%)
Housing units in structures - 1, detached (%)
Housing units in structures - 1, attached (%)
Housing units in structures - 2 (%)
Housing units in structures - 3 or 4 (%)
Housing units in structures - 5 to 9 (%)
Housing units in structures - 10 to 19 (%)
Housing units in structures - 20 to 49 (%)
Housing units in structures - 50 or more (%)
Housing units in structures - Mobile home (%)
Housing units in structures - Boat, RV, van, etc. (%)
House/condo owner moved in on average (years ago)
Renter moved in on average (years ago)
Year householder moved into unit - Moved in 1999 to March 2000 (%)
Year householder moved into unit - Moved in 1995 to 1998 (%)
Year householder moved into unit - Moved in 1990 to 1994 (%)
Year householder moved into unit - Moved in 1980 to 1989 (%)
Year householder moved into unit - Moved in 1970 to 1979 (%)
Year householder moved into unit - Moved in 1969 or earlier (%)
Means of transportation to work - Drove car alone (%)
Means of transportation to work - Carpooled (%)
Means of transportation to work - Public transportation (%)
Means of transportation to work - Bus or trolley bus (%)
Means of transportation to work - Streetcar or trolley car (%)
Means of transportation to work - Subway or elevated (%)
Means of transportation to work - Railroad (%)
Means of transportation to work - Ferryboat (%)
Means of transportation to work - Taxicab (%)
Means of transportation to work - Motorcycle (%)
Means of transportation to work - Bicycle (%)
Means of transportation to work - Walked (%)
Means of transportation to work - Other means (%)
Working at home (%)
Industry diversity
Most Common Industries - Agriculture, forestry, fishing and hunting, and mining (%)
Most Common Industries - Agriculture, forestry, fishing and hunting (%)
Most Common Industries - Mining, quarrying, and oil and gas extraction (%)
Most Common Industries - Construction (%)
Most Common Industries - Manufacturing (%)
Most Common Industries - Wholesale trade (%)
Most Common Industries - Retail trade (%)
Most Common Industries - Transportation and warehousing, and utilities (%)
Most Common Industries - Transportation and warehousing (%)
Most Common Industries - Utilities (%)
Most Common Industries - Information (%)
Most Common Industries - Finance and insurance, and real estate and rental and leasing (%)
Most Common Industries - Finance and insurance (%)
Most Common Industries - Real estate and rental and leasing (%)
Most Common Industries - Professional, scientific, and management, and administrative and waste management services (%)
Most Common Industries - Professional, scientific, and technical services (%)
Most Common Industries - Management of companies and enterprises (%)
Most Common Industries - Administrative and support and waste management services (%)
Most Common Industries - Educational services, and health care and social assistance (%)
Most Common Industries - Educational services (%)
Most Common Industries - Health care and social assistance (%)
Most Common Industries - Arts, entertainment, and recreation, and accommodation and food services (%)
Most Common Industries - Arts, entertainment, and recreation (%)
Most Common Industries - Accommodation and food services (%)
Most Common Industries - Other services, except public administration (%)
Most Common Industries - Public administration (%)
Occupation diversity
Most Common Occupations - Management, business, science, and arts occupations (%)
Most Common Occupations - Management, business, and financial occupations (%)
Most Common Occupations - Management occupations (%)
Most Common Occupations - Business and financial operations occupations (%)
Most Common Occupations - Computer, engineering, and science occupations (%)
Most Common Occupations - Computer and mathematical occupations (%)
Most Common Occupations - Architecture and engineering occupations (%)
Most Common Occupations - Life, physical, and social science occupations (%)
Most Common Occupations - Education, legal, community service, arts, and media occupations (%)
Most Common Occupations - Community and social service occupations (%)
Most Common Occupations - Legal occupations (%)
Most Common Occupations - Education, training, and library occupations (%)
Most Common Occupations - Arts, design, entertainment, sports, and media occupations (%)
Most Common Occupations - Healthcare practitioners and technical occupations (%)
Most Common Occupations - Health diagnosing and treating practitioners and other technical occupations (%)
Most Common Occupations - Health technologists and technicians (%)
Most Common Occupations - Service occupations (%)
Most Common Occupations - Healthcare support occupations (%)
Most Common Occupations - Protective service occupations (%)
Most Common Occupations - Fire fighting and prevention, and other protective service workers including supervisors (%)
Most Common Occupations - Law enforcement workers including supervisors (%)
Most Common Occupations - Food preparation and serving related occupations (%)
Most Common Occupations - Building and grounds cleaning and maintenance occupations (%)
Most Common Occupations - Personal care and service occupations (%)
Most Common Occupations - Sales and office occupations (%)
Most Common Occupations - Sales and related occupations (%)
Most Common Occupations - Office and administrative support occupations (%)
Most Common Occupations - Natural resources, construction, and maintenance occupations (%)
Most Common Occupations - Farming, fishing, and forestry occupations (%)
Most Common Occupations - Construction and extraction occupations (%)
Most Common Occupations - Installation, maintenance, and repair occupations (%)
Most Common Occupations - Production, transportation, and material moving occupations (%)
Most Common Occupations - Production occupations (%)
Most Common Occupations - Transportation occupations (%)
Most Common Occupations - Material moving occupations (%)
People in Group quarters - Institutionalized population (%)
People in Group quarters - Correctional institutions (%)
People in Group quarters - Federal prisons and detention centers (%)
People in Group quarters - Halfway houses (%)
People in Group quarters - Local jails and other confinement facilities (including police lockups) (%)
People in Group quarters - Military disciplinary barracks (%)
People in Group quarters - State prisons (%)
People in Group quarters - Other types of correctional institutions (%)
People in Group quarters - Nursing homes (%)
People in Group quarters - Hospitals/wards, hospices, and schools for the handicapped (%)
People in Group quarters - Hospitals/wards and hospices for chronically ill (%)
People in Group quarters - Hospices or homes for chronically ill (%)
People in Group quarters - Military hospitals or wards for chronically ill (%)
People in Group quarters - Other hospitals or wards for chronically ill (%)
People in Group quarters - Hospitals or wards for drug/alcohol abuse (%)
People in Group quarters - Mental (Psychiatric) hospitals or wards (%)
People in Group quarters - Schools, hospitals, or wards for the mentally retarded (%)
People in Group quarters - Schools, hospitals, or wards for the physically handicapped (%)
People in Group quarters - Institutions for the deaf (%)
People in Group quarters - Institutions for the blind (%)
People in Group quarters - Orthopedic wards and institutions for the physically handicapped (%)
People in Group quarters - Wards in general hospitals for patients who have no usual home elsewhere (%)
People in Group quarters - Wards in military hospitals for patients who have no usual home elsewhere (%)
People in Group quarters - Juvenile institutions (%)
People in Group quarters - Long-term care (%)
People in Group quarters - Homes for abused, dependent, and neglected children (%)
People in Group quarters - Residential treatment centers for emotionally disturbed children (%)
People in Group quarters - Training schools for juvenile delinquents (%)
People in Group quarters - Short-term care, detention or diagnostic centers for delinquent children (%)
People in Group quarters - Type of juvenile institution unknown (%)
People in Group quarters - Noninstitutionalized population (%)
People in Group quarters - College dormitories (includes college quarters off campus) (%)
People in Group quarters - Military quarters (%)
People in Group quarters - On base (%)
People in Group quarters - Barracks, unaccompanied personnel housing (UPH), (Enlisted/Officer), ;and similar group living quarters for military personnel (%)
People in Group quarters - Transient quarters for temporary residents (%)
People in Group quarters - Military ships (%)
People in Group quarters - Group homes (%)
People in Group quarters - Homes or halfway houses for drug/alcohol abuse (%)
People in Group quarters - Homes for the mentally ill (%)
People in Group quarters - Homes for the mentally retarded (%)
People in Group quarters - Homes for the physically handicapped (%)
People in Group quarters - Other group homes (%)
People in Group quarters - Religious group quarters (%)
People in Group quarters - Dormitories (%)
People in Group quarters - Agriculture workers' dormitories on farms (%)
People in Group quarters - Job Corps and vocational training facilities (%)
People in Group quarters - Other workers' dormitories (%)
People in Group quarters - Crews of maritime vessels (%)
People in Group quarters - Other nonhousehold living situations (%)
People in Group quarters - Other noninstitutional group quarters (%)
Residents speaking English at home (%)
Residents speaking English at home - Born in the United States (%)
Residents speaking English at home - Native, born elsewhere (%)
Residents speaking English at home - Foreign born (%)
Residents speaking Spanish at home (%)
Residents speaking Spanish at home - Born in the United States (%)
Residents speaking Spanish at home - Native, born elsewhere (%)
Residents speaking Spanish at home - Foreign born (%)
Residents speaking other language at home (%)
Residents speaking other language at home - Born in the United States (%)
Residents speaking other language at home - Native, born elsewhere (%)
Residents speaking other language at home - Foreign born (%)
Class of Workers - Employee of private company (%)
Class of Workers - Self-employed in own incorporated business (%)
Class of Workers - Private not-for-profit wage and salary workers (%)
Class of Workers - Local government workers (%)
Class of Workers - State government workers (%)
Class of Workers - Federal government workers (%)
Class of Workers - Self-employed workers in own not incorporated business and Unpaid family workers (%)
House heating fuel used in houses and condos - Utility gas (%)
House heating fuel used in houses and condos - Bottled, tank, or LP gas (%)
House heating fuel used in houses and condos - Electricity (%)
House heating fuel used in houses and condos - Fuel oil, kerosene, etc. (%)
House heating fuel used in houses and condos - Coal or coke (%)
House heating fuel used in houses and condos - Wood (%)
House heating fuel used in houses and condos - Solar energy (%)
House heating fuel used in houses and condos - Other fuel (%)
House heating fuel used in houses and condos - No fuel used (%)
House heating fuel used in apartments - Utility gas (%)
House heating fuel used in apartments - Bottled, tank, or LP gas (%)
House heating fuel used in apartments - Electricity (%)
House heating fuel used in apartments - Fuel oil, kerosene, etc. (%)
House heating fuel used in apartments - Coal or coke (%)
House heating fuel used in apartments - Wood (%)
House heating fuel used in apartments - Solar energy (%)
House heating fuel used in apartments - Other fuel (%)
House heating fuel used in apartments - No fuel used (%)
Armed forces status - In Armed Forces (%)
Armed forces status - Civilian (%)
Armed forces status - Civilian - Veteran (%)
Armed forces status - Civilian - Nonveteran (%)
Fatal accidents locations in years 2005-2021
Fatal accidents locations in 2005
Fatal accidents locations in 2006
Fatal accidents locations in 2007
Fatal accidents locations in 2008
Fatal accidents locations in 2009
Fatal accidents locations in 2010
Fatal accidents locations in 2011
Fatal accidents locations in 2012
Fatal accidents locations in 2013
Fatal accidents locations in 2014
Fatal accidents locations in 2015
Fatal accidents locations in 2016
Fatal accidents locations in 2017
Fatal accidents locations in 2018
Fatal accidents locations in 2019
Fatal accidents locations in 2020
Fatal accidents locations in 2021
Alcohol use - People drinking some alcohol every month (%)
Alcohol use - People not drinking at all (%)
Alcohol use - Average days/month drinking alcohol
Alcohol use - Average drinks/week
Alcohol use - Average days/year people drink much
Audiometry - Average condition of hearing (%)
Audiometry - People that can hear a whisper from across a quiet room (%)
Audiometry - People that can hear normal voice from across a quiet room (%)
Audiometry - Ears ringing, roaring, buzzing (%)
Audiometry - Had a job exposure to loud noise (%)
Audiometry - Had off-work exposure to loud noise (%)
Blood Pressure & Cholesterol - Has high blood pressure (%)
Blood Pressure & Cholesterol - Checking blood pressure at home (%)
Blood Pressure & Cholesterol - Frequently checking blood cholesterol (%)
Blood Pressure & Cholesterol - Has high cholesterol level (%)
Consumer Behavior - Money monthly spent on food at supermarket/grocery store
Consumer Behavior - Money monthly spent on food at other stores
Consumer Behavior - Money monthly spent on eating out
Consumer Behavior - Money monthly spent on carryout/delivered foods
Consumer Behavior - Income spent on food at supermarket/grocery store (%)
Consumer Behavior - Income spent on food at other stores (%)
Consumer Behavior - Income spent on eating out (%)
Consumer Behavior - Income spent on carryout/delivered foods (%)
Current Health Status - General health condition (%)
Current Health Status - Blood donors (%)
Current Health Status - Has blood ever tested for HIV virus (%)
Current Health Status - Left-handed people (%)
Dermatology - People using sunscreen (%)
Diabetes - Diabetics (%)
Diabetes - Had a blood test for high blood sugar (%)
Diabetes - People taking insulin (%)
Diet Behavior & Nutrition - Diet health (%)
Diet Behavior & Nutrition - Milk product consumption (# of products/month)
Diet Behavior & Nutrition - Meals not home prepared (#/week)
Diet Behavior & Nutrition - Meals from fast food or pizza place (#/week)
Diet Behavior & Nutrition - Ready-to-eat foods (#/month)
Diet Behavior & Nutrition - Frozen meals/pizza (#/month)
Drug Use - People that ever used marijuana or hashish (%)
Drug Use - Ever used hard drugs (%)
Drug Use - Ever used any form of cocaine (%)
Drug Use - Ever used heroin (%)
Drug Use - Ever used methamphetamine (%)
Health Insurance - People covered by health insurance (%)
Kidney Conditions-Urology - Avg. # of times urinating at night
Medical Conditions - People with asthma (%)
Medical Conditions - People with anemia (%)
Medical Conditions - People with psoriasis (%)
Medical Conditions - People with overweight (%)
Medical Conditions - Elderly people having difficulties in thinking or remembering (%)
Medical Conditions - People who ever received blood transfusion (%)
Medical Conditions - People having trouble seeing even with glass/contacts (%)
Medical Conditions - People with arthritis (%)
Medical Conditions - People with gout (%)
Medical Conditions - People with congestive heart failure (%)
Medical Conditions - People with coronary heart disease (%)
Medical Conditions - People with angina pectoris (%)
Medical Conditions - People who ever had heart attack (%)
Medical Conditions - People who ever had stroke (%)
Medical Conditions - People with emphysema (%)
Medical Conditions - People with thyroid problem (%)
Medical Conditions - People with chronic bronchitis (%)
Medical Conditions - People with any liver condition (%)
Medical Conditions - People who ever had cancer or malignancy (%)
Mental Health - People who have little interest in doing things (%)
Mental Health - People feeling down, depressed, or hopeless (%)
Mental Health - People who have trouble sleeping or sleeping too much (%)
Mental Health - People feeling tired or having little energy (%)
Mental Health - People with poor appetite or overeating (%)
Mental Health - People feeling bad about themself (%)
Mental Health - People who have trouble concentrating on things (%)
Mental Health - People moving or speaking slowly or too fast (%)
Mental Health - People having thoughts they would be better off dead (%)
Oral Health - Average years since last visit a dentist
Oral Health - People embarrassed because of mouth (%)
Oral Health - People with gum disease (%)
Oral Health - General health of teeth and gums (%)
Oral Health - Average days a week using dental floss/device
Oral Health - Average days a week using mouthwash for dental problem
Oral Health - Average number of teeth
Pesticide Use - Households using pesticides to control insects (%)
Pesticide Use - Households using pesticides to kill weeds (%)
Physical Activity - People doing vigorous-intensity work activities (%)
Physical Activity - People doing moderate-intensity work activities (%)
Physical Activity - People walking or bicycling (%)
Physical Activity - People doing vigorous-intensity recreational activities (%)
Physical Activity - People doing moderate-intensity recreational activities (%)
Physical Activity - Average hours a day doing sedentary activities
Physical Activity - Average hours a day watching TV or videos
Physical Activity - Average hours a day using computer
Physical Functioning - People having limitations keeping them from working (%)
Physical Functioning - People limited in amount of work they can do (%)
Physical Functioning - People that need special equipment to walk (%)
Physical Functioning - People experiencing confusion/memory problems (%)
Physical Functioning - People requiring special healthcare equipment (%)
Prescription Medications - Average number of prescription medicines taking
Preventive Aspirin Use - Adults 40+ taking low-dose aspirin (%)
Reproductive Health - Vaginal deliveries (%)
Reproductive Health - Cesarean deliveries (%)
Reproductive Health - Deliveries resulted in a live birth (%)
Reproductive Health - Pregnancies resulted in a delivery (%)
Reproductive Health - Women breastfeeding newborns (%)
Reproductive Health - Women that had a hysterectomy (%)
Reproductive Health - Women that had both ovaries removed (%)
Reproductive Health - Women that have ever taken birth control pills (%)
Reproductive Health - Women taking birth control pills (%)
Reproductive Health - Women that have ever used Depo-Provera or injectables (%)
Reproductive Health - Women that have ever used female hormones (%)
Sexual Behavior - People 18+ that ever had sex (vaginal, anal, or oral) (%)
Sexual Behavior - Males 18+ that ever had vaginal sex with a woman (%)
Sexual Behavior - Males 18+ that ever performed oral sex on a woman (%)
Sexual Behavior - Males 18+ that ever had anal sex with a woman (%)
Sexual Behavior - Males 18+ that ever had any sex with a man (%)
Sexual Behavior - Females 18+ that ever had vaginal sex with a man (%)
Sexual Behavior - Females 18+ that ever performed oral sex on a man (%)
Sexual Behavior - Females 18+ that ever had anal sex with a man (%)
Sexual Behavior - Females 18+ that ever had any kind of sex with a woman (%)
Sexual Behavior - Average age people first had sex
Sexual Behavior - Average number of female sex partners in lifetime (males 18+)
Sexual Behavior - Average number of female vaginal sex partners in lifetime (males 18+)
Sexual Behavior - Average age people first performed oral sex on a woman (18+)
Sexual Behavior - Average number of woman performed oral sex on in lifetime (18+)
Sexual Behavior - Average number of male sex partners in lifetime (males 18+)
Sexual Behavior - Average number of male anal sex partners in lifetime (males 18+)
Sexual Behavior - Average age people first performed oral sex on a man (18+)
Sexual Behavior - Average number of male oral sex partners in lifetime (18+)
Sexual Behavior - People using protection when performing oral sex (%)
Sexual Behavior - Average number of times people have vaginal or anal sex a year
Sexual Behavior - People having sex without condom (%)
Sexual Behavior - Average number of male sex partners in lifetime (females 18+)
Sexual Behavior - Average number of male vaginal sex partners in lifetime (females 18+)
Sexual Behavior - Average number of female sex partners in lifetime (females 18+)
Sexual Behavior - Circumcised males 18+ (%)
Sleep Disorders - Average hours sleeping at night
Sleep Disorders - People that has trouble sleeping (%)
Smoking-Cigarette Use - People smoking cigarettes (%)
Taste & Smell - People 40+ having problems with smell (%)
Taste & Smell - People 40+ having problems with taste (%)
Taste & Smell - People 40+ that ever had wisdom teeth removed (%)
Taste & Smell - People 40+ that ever had tonsils teeth removed (%)
Taste & Smell - People 40+ that ever had a loss of consciousness because of a head injury (%)
Taste & Smell - People 40+ that ever had a broken nose or other serious injury to face or skull (%)
Taste & Smell - People 40+ that ever had two or more sinus infections (%)
Weight - Average height (inches)
Weight - Average weight (pounds)
Weight - Average BMI
Weight - People that are obese (%)
Weight - People that ever were obese (%)
Weight - People trying to lose weight (%)
100%
urban population.
Estimated median house/condo value in 2022: $244,186
33952:
$244,186Florida:
$354,100
Median resident age: This zip code:
53.2 yearsFlorida median age:
42.7 years
Average household size: This zip code:
2.3 peopleFlorida:
2.5 people
Averages for the 2020 tax year for zip code 33952, filed in 2021:
Average Adjusted Gross Income (AGI) in 2020: $48,214 (Individual Income Tax Returns) Here:
$48,214State:
$82,200
Salary/wage: $38,935 (reported on 75.5% of returns )Here:
$38,935State:
$58,347
(% of AGI for various income ranges: 1137.0% for AGIs below $25k , 3439.3% for AGIs $25k-50k , 6015.3% for AGIs $50k-75k , 8491.4% for AGIs $75k-100k , 14449.0% for AGIs $100k-200k , 66082.9% for AGIs over 200k ) Taxable interest for individuals: $1,691 (reported on 23.1% of returns )This zip code:
$1,691Florida:
$4,272
(% of AGI for various income ranges: 17.2% for AGIs below $25k , 19.5% for AGIs $25k-50k , 55.8% for AGIs $50k-75k , 84.8% for AGIs $75k-100k , 206.7% for AGIs $100k-200k , 2838.6% for AGIs over 200k ) Ordinary dividends: $5,587 (reported on 15.1% of returns )(% of AGI for various income ranges: 20.9% for AGIs below $25k , 37.0% for AGIs $25k-50k , 96.8% for AGIs $50k-75k , 226.1% for AGIs $75k-100k , 559.7% for AGIs $100k-200k , 6700.0% for AGIs over 200k ) Net capital gain/loss in AGI: +$20,381 (reported on 13.3% of returns )Here:
+$20,381State:
+$62,983
(% of AGI for various income ranges: 7.5% for AGIs below $25k , 23.7% for AGIs $25k-50k , 106.6% for AGIs $50k-75k , 285.2% for AGIs $75k-100k , 1191.6% for AGIs $100k-200k , 44660.0% for AGIs over 200k ) Profit/loss from business: +$9,873 (reported on 15.0% of returns )Here:
+$9,873State:
+$9,719
(% of AGI for various income ranges: 128.6% for AGIs below $25k , 123.5% for AGIs $25k-50k , 191.7% for AGIs $50k-75k , 289.9% for AGIs $75k-100k , 487.4% for AGIs $100k-200k , 6960.0% for AGIs over 200k ) Taxable individual retirement arrangement distribution: $17,817 (reported on 10.4% of returns )33952:
$17,817Florida:
$24,823
(% of AGI for various income ranges: 65.3% for AGIs below $25k , 94.7% for AGIs $25k-50k , 255.7% for AGIs $50k-75k , 587.1% for AGIs $75k-100k , 1630.2% for AGIs $100k-200k , 7622.9% for AGIs over 200k ) Total itemized deductions: $30,027 (reported on 4.2% of returns )Here:
$30,027State:
$45,393
(% of AGI for various income ranges: 40.0% for AGIs below $25k , 118.8% for AGIs $25k-50k , 192.3% for AGIs $50k-75k , 353.8% for AGIs $75k-100k , 684.5% for AGIs $100k-200k , 6252.9% for AGIs over 200k ) Charity contributions: $8,282 (reported on 3.2% of returns )(% of AGI for various income ranges: 4.4% for AGIs below $25k , 24.3% for AGIs $25k-50k , 35.8% for AGIs $50k-75k , 67.0% for AGIs $75k-100k , 168.4% for AGIs $100k-200k , 1581.4% for AGIs over 200k ) Taxes paid: $5,509 (reported on 4.0% of returns )(% of AGI for various income ranges: 4.8% for AGIs below $25k , 20.3% for AGIs $25k-50k , 32.9% for AGIs $50k-75k , 66.7% for AGIs $75k-100k , 141.7% for AGIs $100k-200k , 1061.4% for AGIs over 200k ) Earned income credit: $2,174 (reported on 21.3% of returns )(% of AGI for various income ranges: 101.1% for AGIs below $25k , 65.6% for AGIs $25k-50k , 1.5% for AGIs $50k-75k ) Percentage of individuals using paid preparers for their 2020 taxes: 92.5%(% for various income ranges: 91.7% for AGIs below $25k , 93.8% for AGIs $25k-50k , 93.5% for AGIs $50k-75k , 91.0% for AGIs $75k-100k , 91.8% for AGIs $100k-200k , 92.6% for AGIs over 200k )
Averages for the 2012 tax year for zip code 33952, filed in 2013:
Average Adjusted Gross Income (AGI) in 2012: $38,533 (Individual Income Tax Returns) Here:
$38,533State:
$60,316
Salary/wage: $31,316 (reported on 74.7% of returns )Here:
$31,316State:
$45,277
(% of AGI for various income ranges: 68.6% for AGIs below $25k , 72.3% for AGIs $25k-50k , 63.1% for AGIs $50k-75k , 58.4% for AGIs $75k-100k , 54.2% for AGIs $100k-200k , 39.5% for AGIs over 200k ) Taxable interest for individuals: $1,708 (reported on 28.9% of returns )This zip code:
$1,708Florida:
$3,587
(% of AGI for various income ranges: 1.5% for AGIs below $25k , 1.0% for AGIs $25k-50k , 1.1% for AGIs $50k-75k , 1.2% for AGIs $75k-100k , 1.5% for AGIs $100k-200k , 1.6% for AGIs over 200k ) Ordinary dividends: $4,902 (reported on 19.0% of returns )(% of AGI for various income ranges: 2.5% for AGIs below $25k , 1.6% for AGIs $25k-50k , 2.0% for AGIs $50k-75k , 2.5% for AGIs $75k-100k , 3.4% for AGIs $100k-200k , 3.3% for AGIs over 200k ) Net capital gain/loss in AGI: +$10,158 (reported on 14.2% of returns )Here:
+$10,158State:
+$33,493
(% of AGI for various income ranges: 0.4% for AGIs $50k-75k , 0.8% for AGIs $75k-100k , 3.3% for AGIs $100k-200k , 19.9% for AGIs over 200k ) Profit/loss from business: +$9,089 (reported on 12.3% of returns )Here:
+$9,089State:
+$10,012
(% of AGI for various income ranges: 6.7% for AGIs below $25k , 1.4% for AGIs $25k-50k , 2.0% for AGIs $50k-75k , 2.3% for AGIs $75k-100k , 2.7% for AGIs $100k-200k , 2.7% for AGIs over 200k ) Taxable individual retirement arrangement distribution: $14,884 (reported on 13.2% of returns )33952:
$14,884Florida:
$21,544
(% of AGI for various income ranges: 3.9% for AGIs below $25k , 3.2% for AGIs $25k-50k , 3.7% for AGIs $50k-75k , 4.7% for AGIs $75k-100k , 9.3% for AGIs $100k-200k , 7.4% for AGIs over 200k ) Self-employment retirement plans: $23,600 (reported on 0.2% of returns )33952:
$23,600Florida:
$20,611
Total itemized deductions: $18,817 (23% of AGI, reported on 18.3% of returns )Here:
$18,817State:
$25,533
Here:
23.1% of AGIState:
18.0% of AGI
(% of AGI for various income ranges: 8.6% for AGIs below $25k , 8.9% for AGIs $25k-50k , 8.9% for AGIs $50k-75k , 9.7% for AGIs $75k-100k , 10.5% for AGIs $100k-200k , 7.4% for AGIs over 200k ) Charity contributions: $3,178 (reported on 13.8% of returns )(% of AGI for various income ranges: 0.6% for AGIs below $25k , 0.8% for AGIs $25k-50k , 1.1% for AGIs $50k-75k , 1.4% for AGIs $75k-100k , 1.9% for AGIs $100k-200k , 1.4% for AGIs over 200k ) Taxes paid: $4,275 (reported on 17.8% of returns )(% of AGI for various income ranges: 1.8% for AGIs below $25k , 1.5% for AGIs $25k-50k , 1.7% for AGIs $50k-75k , 2.1% for AGIs $75k-100k , 2.8% for AGIs $100k-200k , 2.4% for AGIs over 200k ) Earned income credit: $2,202 (reported on 24.6% of returns )(% of AGI for various income ranges: 6.7% for AGIs below $25k , 1.1% for AGIs $25k-50k ) Percentage of individuals using paid preparers for their 2012 taxes: 47.0%(% for various income ranges: 43.5% for AGIs below $25k , 45.9% for AGIs $25k-50k , 50.7% for AGIs $50k-75k , 54.5% for AGIs $75k-100k , 64.2% for AGIs $100k-200k , 93.3% for AGIs over 200k )
Averages for the 2004 tax year for zip code 33952, filed in 2005:
Average Adjusted Gross Income (AGI) in 2004: $37,332 (Individual Income Tax Returns) Here:
$37,332State:
$50,523
Salary/wage: $30,853 (reported on 74.7% of returns )Here:
$30,853State:
$39,563
(% of AGI for various income ranges: 119.1% for AGIs below $10k , 66.1% for AGIs $10k-25k , 71.3% for AGIs $25k-50k , 66.0% for AGIs $50k-75k , 63.7% for AGIs $75k-100k , 44.0% for AGIs over 100k ) Taxable interest for individuals: $2,173 (reported on 46.3% of returns )This zip code:
$2,173Florida:
$3,211
(% of AGI for various income ranges: 10.0% for AGIs below $10k , 3.7% for AGIs $10k-25k , 2.3% for AGIs $25k-50k , 2.1% for AGIs $50k-75k , 2.9% for AGIs $75k-100k , 2.4% for AGIs over 100k ) Taxable dividends: $3,096 (reported on 25.7% of returns )(% of AGI for various income ranges: 7.9% for AGIs below $10k , 2.8% for AGIs $10k-25k , 1.5% for AGIs $25k-50k , 2.2% for AGIs $50k-75k , 2.0% for AGIs $75k-100k , 2.0% for AGIs over 100k ) Net capital gain/loss: +$13,860 (reported on 21.3% of returns )Here:
+$13,860State:
+$27,205
(% of AGI for various income ranges: -2.4% for AGIs below $10k , 0.8% for AGIs $10k-25k , 0.8% for AGIs $25k-50k , 3.1% for AGIs $50k-75k , 5.9% for AGIs $75k-100k , 22.3% for AGIs over 100k ) Profit/loss from business: +$9,812 (reported on 12.4% of returns )Here:
+$9,812State:
+$10,634
(% of AGI for various income ranges: 10.0% for AGIs below $10k , 4.0% for AGIs $10k-25k , 2.4% for AGIs $25k-50k , 2.2% for AGIs $50k-75k , 3.7% for AGIs $75k-100k , 3.8% for AGIs over 100k ) IRA payment deduction: $3,165 (reported on 2.6% of returns )33952:
$3,165Florida:
$3,082
(% of AGI for various income ranges: 0.5% for AGIs below $10k , 0.2% for AGIs $10k-25k , 0.3% for AGIs $25k-50k , 0.2% for AGIs $50k-75k , 0.2% for AGIs $75k-100k , 0.1% for AGIs over 100k ) Self-employed pension: $15,200 (reported on 0.3% of returns )Here:
$15,200Florida:
$15,857
(% of AGI for various income ranges: 0.1% for AGIs $10k-25k , 0.2% for AGIs $50k-75k , 0.3% for AGIs over 100k ) Total itemized deductions: $19,534 (29% of AGI, reported on 26.4% of returns )Here:
$19,534State:
$20,370
Here:
28.9% of AGIState:
20.7% of AGI
(% of AGI for various income ranges: 28.3% for AGIs below $10k , 15.1% for AGIs $10k-25k , 14.5% for AGIs $25k-50k , 14.1% for AGIs $50k-75k , 14.2% for AGIs $75k-100k , 11.4% for AGIs over 100k ) Charity contributions deductions: $2,804 (4% of AGI, reported on 20.3% of returns )Here:
3.7% of AGIState:
3.8% of AGI
(% of AGI for various income ranges: 1.1% for AGIs below $10k , 1.0% for AGIs $10k-25k , 1.3% for AGIs $25k-50k , 1.6% for AGIs $50k-75k , 1.9% for AGIs $75k-100k , 1.8% for AGIs over 100k ) Total tax: $5,620 (reported on 71.0% of returns )(% of AGI for various income ranges: 3.6% for AGIs below $10k , 3.6% for AGIs $10k-25k , 6.5% for AGIs $25k-50k , 8.7% for AGIs $50k-75k , 10.7% for AGIs $75k-100k , 19.8% for AGIs over 100k ) Earned income credit: $1,699 (reported on 16.7% of returns )Percentage of individuals using paid preparers for their 2004 taxes: 59.0%(% for various income ranges: 52.6% for AGIs below $10k , 59.2% for AGIs $10k-25k , 59.4% for AGIs $25k-50k , 59.6% for AGIs $50k-75k , 64.1% for AGIs $75k-100k , 80.2% for AGIs over 100k )
Estimated median household income in 2022: This zip code:
$53,380Florida:
$69,303
Nearest zip codes: 33954 ,
33980 ,
33948 ,
34288 ,
33983 ,
33950 .
Port Charlotte Zip Code Map
Percentage of family households: This zip code:
34.2%Florida:
41.2%
Percentage of households with unmarried partners: This zip code:
5.8%Florida:
46.7%
Likely homosexual households (counted as self-reported same-sex unmarried-partner households)
Lesbian couples: 0.2% of all households Gay men: 0.1% of all households
Household received Food Stamps/SNAP in the past 12 months: 2,283Household did not receive Food Stamps/SNAP in the past 12 months: 13,220
Women who had a birth in the past 12 months: 587 (250 now married , 319 unmarried) Women who did not have a birth in the past 12 months: 5,592 (2,003 now married , 3,588 unmarried)
Housing units in zip code 33952 with a mortgage: 6,470 (389
second mortgage , 322
both second mortgage and home equity loan )
Houses without a mortgage: 178
Median monthly owner costs for units with a mortgage: $1,267
Median monthly owner costs for units without a mortgage: $490
Residents with income below the poverty level in 2022:
This zip code:
15.9%Whole state:
12.7%
Residents with income below 50% of the poverty level in 2022:
This zip code:
7.2%Whole state:
6.6%
Median number of rooms in houses and condos: Median number of rooms in apartments:
Year house built (houses)
24 2020 or later258 2010 to 20191,063 2000 to 20091,025 1990 to 19994,851 1980 to 19895,528 1970 to 19793,382 1960 to 19691,094 1950 to 195931 1940 to 194942 1939 or earlier
Zip code 33952 household income distribution in 2022 956 Less than $10,000760 $10,000 to $14,999954 $15,000 to $19,999730 $20,000 to $24,999858 $25,000 to $29,999898 $30,000 to $34,999485 $35,000 to $39,999786 $40,000 to $44,999795 $45,000 to $49,9991,377 $50,000 to $59,9992,087 $60,000 to $74,9991,993 $75,000 to $99,9991,036 $100,000 to $124,999610 $125,000 to $149,999606 $150,000 to $199,999424 $200,000 or moreEstimate of home value of owner-occupied houses/condos in 2022 in zip code 33952 105 Less than $10,00054 $10,000 to $14,99935 $15,000 to $19,99978 $20,000 to $24,9999 $25,000 to $29,99973 $35,000 to $39,99925 $40,000 to $49,99976 $50,000 to $59,999206 $60,000 to $69,99989 $70,000 to $79,999180 $80,000 to $89,999183 $90,000 to $99,999469 $100,000 to $124,999431 $125,000 to $149,999934 $150,000 to $174,9991,148 $175,000 to $199,9991,816 $200,000 to $249,9991,130 $250,000 to $299,9991,156 $300,000 to $399,999332 $400,000 to $499,999473 $500,000 to $749,999372 $750,000 to $999,99992 $1,000,000 to $1,499,99977 $1,500,000 to $1,999,99962 $2,000,000 or moreRent paid by renters in 2022 in zip code 33952 118 $200 to $24931 $250 to $29940 $300 to $34940 $350 to $39983 $400 to $449108 $500 to $54985 $550 to $599140 $600 to $6499 $650 to $699224 $700 to $749116 $750 to $799272 $800 to $899342 $900 to $999643 $1,000 to $1,249367 $1,250 to $1,499298 $1,500 to $1,999151 $2,000 to $2,499210 $3,000 to $3,499224 No cash rent
Median gross rent in 2022: $1,226.
Median price asked for vacant for-sale houses and condos in 2022: $155,834.
Estimated median house (or condo) value in 2022 for: White Non-Hispanic householders: $250,924Black or African American householders: $245,148American Indian or Alaska Native householders: $222,687Asian householders: $229,425Some other race householders: $329,217Two or more races householders: $234,880Hispanic or Latino householders: $240,656Estimated median house or condo value in 2022: $244,186
33952:
$244,186Florida:
$354,100
Lower value quartile - upper value quartile: $185,477 - $315,629
Mean price in 2022: Detached houses: $285,467Here:
$285,467State:
$500,941
Townhouses or other attached units: $868,736Here:
$868,736State:
$370,869
In 3-to-4-unit structures: $230,725Here:
$230,725State:
$309,944
In 5-or-more-unit structures: $113,184Here:
$113,184State:
$447,145
Mobile homes: $564,769Here:
$564,769State:
$113,202
Housing units in structures:
One, detached: 14,784One, attached: 67Two: 1493 or 4: 2635 to 9: 33510 to 19: 38420 to 49: 53250 or more: 1,328Mobile homes: 163Boats, RVs, vans, etc.: 55Unemployment : 5.9%
Means of transportation to work in zip code 33952 70.6% 9,849 Drove a car alone9.0% 1,255 Carpooled0.1% 17 Bus or trolley bus2.1% 293 Taxi0.3% 35 Motorcycle0.2% 27 Bicycle1.4% 192 Walked1.7% 239 Other means14.2% 1,985 Worked at homeTravel time to work (commute) in zip code 33952 127 Less than 5 minutes1,301 5 to 9 minutes2,609 10 to 14 minutes2,289 15 to 19 minutes1,610 20 to 24 minutes310 25 to 29 minutes927 30 to 34 minutes202 35 to 39 minutes502 40 to 44 minutes966 45 to 59 minutes552 60 to 89 minutes469 90 or more minutes
Percentage of zip code residents living and working in this county: 74.9%
Household type by relationship:
Households: 35,710
Male householders: 7,035 (2,473 living alone ), Female householders: 8,505 (2,472 living alone )6,741 spouses (6,628 opposite-sex spouses ), 1,325 unmarried partners , (1,253 opposite-sex unmarried partners ), 8,046 children (7,458 natural , 275 adopted , 319 stepchildren ), 1,028 grandchildren , 368 brothers or sisters , 408 parents , 5 foster children , 768 other relatives , 1,176 non-relatives In group quarters: 428 (-1 institutionalized population )
Size of family households: 4,813 2-persons , 2,113 3-persons , 1,431 4-persons , 550 5-persons , 169 6-persons , 212 7-or-more-persons
Size of nonfamily households: 4,941 1-person , 1,264 2-persons , 34 3-persons
2,685 married couples with children. single-parent households (641 men , 1,049 women ).
85.3% of residents of 33952 zip code speak English at home. of residents speak Spanish at home (65% very well, 18% well, 15% not well, 2% not at all ).of residents speak other Indo-European language at home (82% very well, 5% well, 13% not well ).of residents speak Asian or Pacific Island language at home (87% very well, 10% well, 3% not well ).of residents speak other language at home (63% very well, 37% well ).
Foreign born population: 4,187 (11.7%)
(58.9%
of them are naturalized citizens )
This zip code:
11.7%Whole state:
21.7%
16% Haiti 13% Barbados 7% Costa Rica 6% Uruguay 6% Ecuador 6% Sweden 5% Honduras 24% American 9% Italian 9% English 8% German 6% Irish 2% Jamaican 2% Polish
Year of entry for the foreign-born population
1,112 2010 or later 1,109 2000 to 2009 641 1990 to 1999 1,967 Before 1990
There are
72 Internal Medicine Specialists 351 Other Medical Specialists in Zip Code 33952.
Major facilities with environmental interests located in this zip code:
NEIL ARMSTRONG ELEMENTARY SCHOOL (22100 BREEZESWEPT AVENUE in PORT CHARLOTTE, FL)
(Geographic Names Information System) (National Center for Education Statistics) - STATE ID-0111 Organizations: CHARLOTTE COUNTY SCHOOL DISTRICT (SCHOOL DISTRICT)
CIRCLE STORE 7413 (2512 TAMIAMI TRAIL in PORT CHARLOTTE, FL)
National Pollutant Discharge Elimination System NON-MAJOR (Tracking pollutant discharge elimination systems) - permit (Resource Conservation and Recovery Act (tracking hazardous waste)) Organizations: STEVE BELIN, MGR (CONTACT/OWNER)
, DARYL GOTTILLA (CONTACT/OWNER)
Alternative names: CIRCLE K #7413, CIRCLE K STORE #7082
KINGSWAY ELEMENTARY SCHOOL (23300 QUASAR BOULEVARD in PORT CHARLOTTE, FL)
(National Center for Education Statistics) - STATE ID-0301 Organizations: CHARLOTTE COUNTY SCHOOL DISTRICT (SCHOOL DISTRICT)
PORT CHARLOTTE MIDDLE SCHOOL (23000 MIDWAY BOULEVARD in PORT CHARLOTTE, FL)
(National Center for Education Statistics) - STATE ID-0131 Organizations: CHARLOTTE COUNTY SCHOOL DISTRICT (SCHOOL DISTRICT)
RUB A DUB DUB (2150 TAMIAMI TRAIL (CHARLOTTE in PORT CHARLOTTE, FL)
AIR MINOR (AIRS/AFS) (Resource Conservation and Recovery Act (tracking hazardous waste)) Business SIC classification: DRYCLEANING PLANTS, EXCEPT RUG CLEANINGOrganizations: HEIDI WILLIAMSON (CONTACT/OWNER)
Alternative names: RUB-A-DUB-DUB DRY CLEANERS
CIRCLE K #4740 (2646 TAMIAMI TR in PORT CHARLOTTE, FL)
National Pollutant Discharge Elimination System NON-MAJOR (Tracking pollutant discharge elimination systems) - permit (Resource Conservation and Recovery Act (tracking hazardous waste)) Business SIC classification: GASOLINE SERVICE STATIONSOrganizations: STEVE BELIN, MGR (CONTACT/OWNER)
MYAKKA POINTE AT RIVERWOODS, U (CLUB DRIVE AT RIVERWOOD in PORT CHARLOTTE, FL)
National Pollutant Discharge Elimination System NON-MAJOR (Tracking pollutant discharge elimination systems) - permit Organizations: TOM WEGWERT (CONTACT/OWNER)
PARKS AND RECREATION SITE ON M (19150 MIDWAY BLVD. in PORT CHARLOTTE, FL)
National Pollutant Discharge Elimination System NON-MAJOR (Tracking pollutant discharge elimination systems) - permit Organizations: TOM KEITH (CONTACT/OWNER)
ABC FINE WINE & SPIRITS STORE (4250 TAMIAMI TRL in PORT CHARLOTTE, FL)
National Pollutant Discharge Elimination System NON-MAJOR (Tracking pollutant discharge elimination systems) - permit Organizations: REX WEEKS (CONTACT/OWNER)
ASHISVERD FOOD MART BP AMOCO (3013 TAMIAMI TRAIL in PORT CHARLOTTE, FL)
National Pollutant Discharge Elimination System NON-MAJOR (Tracking pollutant discharge elimination systems) - permit Organizations: PRAVIN PATEL (CONTACT/OWNER)
Alternative names: SHELL STATION
GENES PRESCRIPTION SHOP (3890 C TAMIAMI TRL in PORT CHARLOTTE, FL)
(Resource Conservation and Recovery Act (tracking hazardous waste)) Organizations: GENE COULTER (CONTACT/OWNER)
GULF COAST MARINE CENTER INC (2552 TAMIAMI TRL in PORT CHARLOTTE, FL)
(Resource Conservation and Recovery Act (tracking hazardous waste)) Business NAICS classification: BOAT DEALERS.Organizations: GEORGE STOECKERT (CONTACT/OWNER)
Housing units lacking complete plumbing facilities: 1.0%
Housing units lacking complete kitchen facilities: 3.7%
95.6% Electricity 2.2% Utility gas 1.6% No fuel used
Population in 1990: 27,923. Population change in the 1990s: +2,620 (+9.4%).
Place of birth for U.S.-born residents:
This state: 8,694Northeast: 9,216Midwest: 8,058South: 3,634West: 1,082
55% of the 33952 zip code residents lived in the same house 5 years ago.
Out of people who lived in different houses, 42% lived in this county.
Out of people who lived in different counties, 50% lived in Florida.
88% of the 33952 zip code residents lived in the same house 1 year ago.
Out of people who lived in different houses, 36% moved from this county.
Out of people who lived in different houses, 18% moved from different county within same state.
Out of people who lived in different houses, 46% moved from different state.
Out of people who lived in different houses, 2% moved from abroad.
Private vs. public school enrollment:
Students in private schools in grades 1 to 8 (elementary and middle school): 348
Students in private schools in grades 9 to 12 (high school): 268
Students in private undergraduate colleges: 313
Occupation by median earnings in the past 12 months ($)
70,810 Health diagnosing and treating practitioners and other technical occupations 55,971 Legal occupations 54,628 Management occupations 49,824 Installation, maintenance, and repair occupations 48,790 Computer and mathematical occupations 48,790 Arts, design, entertainment, sports, and media occupations
Top industries in this zip code by the number of employees in 2005:
Health Care and Social Assistance: General Medical and Surgical Hospitals (500-999 employees: 2 establishments)Health Care and Social Assistance: Offices of Physicians (except Mental Health Specialists) (100-249: 1, 50-99: 3, 20-49: 5, 10-19: 14, 5-9: 31, 1-4: 64)Health Care and Social Assistance: Nursing Care Facilities (100-249: 2, 20-49: 1)Administrative and Support and Waste Management and Remediation Services: Temporary Help Services (100-249: 1, 50-99: 1, 20-49: 1, 1-4: 1)Health Care and Social Assistance: Home Health Care Services (50-99: 2, 20-49: 2, 10-19: 1, 1-4: 2)Other Services (except Public Administration): Religious Organizations (50-99: 1, 20-49: 2, 10-19: 2, 5-9: 4, 1-4: 7)Accommodation and Food Services: Limited-Service Restaurants (50-99: 1, 20-49: 2, 10-19: 3, 1-4: 6)Health Care and Social Assistance: Offices of Dentists (20-49: 1, 10-19: 4, 5-9: 11, 1-4: 8)Accommodation and Food Services: Full-Service Restaurants (50-99: 2, 10-19: 1, 5-9: 3, 1-4: 2)
People in group quarters in 2010:
217 people in nursing facilities/skilled-nursing facilities
13 people in workers' group living quarters and job corps centers
9 people in hospitals with patients who have no usual home elsewhere
5 people in group homes for juveniles (non-correctional)
5 people in group homes intended for adults
People in group quarters in 2000:
226 people in nursing homes
Fatal accident statistics in 2014:
Fatal accident count: 3Vehicles involved in fatal accidents: 3Fatal accidents caused by drunken drivers: 0Fatalities: 3Persons involved in fatal accidents: 6Pedestrians involved in fatal accidents: 3
Fatal accident statistics in 2013:
Fatal accident count: 1Vehicles involved in fatal accidents: 1Fatal accidents caused by drunken drivers: 0Fatalities: 1Persons involved in fatal accidents: 1Pedestrians involved in fatal accidents: 0
Home Mortgage Disclosure Act Aggregated Statistics For Year 2009(Based on 4 full and 10 partial tracts) A) FHA, FSA/RHS & VA B) Conventional C) Refinancings D) Home Improvement Loans F) Non-occupant Loans on G) Loans On Manufactured Number Average Value Number Average Value Number Average Value Number Average Value Number Average Value Number Average Value
LOANS ORIGINATED 174 $94,957 228 $87,452 274 $115,914 13 $27,583 157 $86,323 0 $0 APPLICATIONS APPROVED, NOT ACCEPTED 15 $79,424 21 $94,059 45 $133,192 5 $43,076 13 $98,992 1 $27,680 APPLICATIONS DENIED 31 $85,960 51 $84,976 277 $129,410 27 $38,944 55 $97,534 0 $0 APPLICATIONS WITHDRAWN 21 $89,962 35 $67,084 124 $126,250 7 $80,917 25 $78,911 0 $0 FILES CLOSED FOR INCOMPLETENESS 5 $81,670 5 $70,630 33 $112,207 0 $0 3 $75,887 0 $0
Aggregated Statistics For Year 2008(Based on 4 full and 10 partial tracts) A) FHA, FSA/RHS & VA B) Conventional C) Refinancings D) Home Improvement Loans F) Non-occupant Loans on G) Loans On Manufactured Number Average Value Number Average Value Number Average Value Number Average Value Number Average Value Number Average Value
LOANS ORIGINATED 121 $123,824 291 $109,604 342 $113,722 36 $70,609 170 $107,906 3 $65,327 APPLICATIONS APPROVED, NOT ACCEPTED 6 $113,623 38 $100,425 139 $129,848 15 $39,523 36 $133,979 0 $0 APPLICATIONS DENIED 28 $140,401 90 $133,776 459 $144,669 67 $75,248 100 $130,053 2 $84,000 APPLICATIONS WITHDRAWN 21 $108,520 47 $93,780 104 $139,886 14 $87,626 20 $103,214 0 $0 FILES CLOSED FOR INCOMPLETENESS 3 $61,087 15 $129,481 36 $165,083 6 $56,525 14 $110,241 0 $0
Aggregated Statistics For Year 2007(Based on 4 full and 10 partial tracts) A) FHA, FSA/RHS & VA B) Conventional C) Refinancings D) Home Improvement Loans F) Non-occupant Loans on G) Loans On Manufactured Number Average Value Number Average Value Number Average Value Number Average Value Number Average Value Number Average Value
LOANS ORIGINATED 66 $137,667 620 $136,601 1,116 $135,358 150 $66,929 382 $133,857 1 $47,020 APPLICATIONS APPROVED, NOT ACCEPTED 2 $72,185 124 $149,800 288 $140,876 46 $77,936 73 $150,432 6 $78,680 APPLICATIONS DENIED 16 $139,966 313 $150,198 1,049 $159,322 178 $88,726 214 $150,075 5 $80,462 APPLICATIONS WITHDRAWN 5 $116,302 103 $151,012 476 $155,936 43 $131,617 84 $161,445 1 $3,300 FILES CLOSED FOR INCOMPLETENESS 0 $0 40 $207,989 149 $180,879 7 $53,077 36 $185,695 0 $0
Aggregated Statistics For Year 2006(Based on 4 full and 10 partial tracts) A) FHA, FSA/RHS & VA B) Conventional C) Refinancings D) Home Improvement Loans F) Non-occupant Loans on G) Loans On Manufactured Number Average Value Number Average Value Number Average Value Number Average Value Number Average Value Number Average Value
LOANS ORIGINATED 64 $155,307 1,374 $137,425 1,955 $140,353 212 $82,520 788 $147,626 3 $68,183 APPLICATIONS APPROVED, NOT ACCEPTED 0 $0 193 $145,171 343 $136,553 50 $60,903 99 $152,842 5 $64,838 APPLICATIONS DENIED 4 $171,832 520 $156,126 1,050 $152,336 177 $80,224 289 $165,739 6 $76,203 APPLICATIONS WITHDRAWN 4 $126,788 196 $159,268 756 $147,353 42 $90,981 110 $184,578 2 $171,805 FILES CLOSED FOR INCOMPLETENESS 1 $149,870 60 $143,085 255 $157,656 13 $64,046 41 $157,143 0 $0
Aggregated Statistics For Year 2005(Based on 4 full and 10 partial tracts) A) FHA, FSA/RHS & VA B) Conventional C) Refinancings D) Home Improvement Loans F) Non-occupant Loans on G) Loans On Manufactured Number Average Value Number Average Value Number Average Value Number Average Value Number Average Value Number Average Value
LOANS ORIGINATED 64 $136,490 1,809 $135,610 1,717 $137,186 211 $79,524 863 $130,750 1 $34,370 APPLICATIONS APPROVED, NOT ACCEPTED 6 $166,152 205 $124,417 311 $127,242 65 $69,391 103 $132,999 1 $37,150 APPLICATIONS DENIED 18 $135,039 524 $126,174 805 $130,773 215 $66,119 232 $145,624 8 $72,660 APPLICATIONS WITHDRAWN 13 $143,156 242 $143,370 704 $131,215 74 $120,612 119 $149,095 0 $0 FILES CLOSED FOR INCOMPLETENESS 3 $119,000 90 $124,106 419 $140,625 16 $81,364 46 $131,101 0 $0
Aggregated Statistics For Year 2004(Based on 4 full and 10 partial tracts) A) FHA, FSA/RHS & VA B) Conventional C) Refinancings D) Home Improvement Loans E) Loans on Dwellings For 5+ Families F) Non-occupant Loans on G) Loans On Manufactured Number Average Value Number Average Value Number Average Value Number Average Value Number Average Value Number Average Value Number Average Value
LOANS ORIGINATED 151 $112,568 1,410 $114,053 1,296 $100,593 167 $60,893 4 $78,740 671 $108,986 1 $67,650 APPLICATIONS APPROVED, NOT ACCEPTED 10 $104,187 206 $109,373 291 $94,857 46 $40,303 0 $0 96 $94,565 12 $48,328 APPLICATIONS DENIED 22 $101,510 317 $98,869 772 $102,140 197 $48,894 0 $0 135 $99,874 17 $52,709 APPLICATIONS WITHDRAWN 15 $94,173 179 $116,656 477 $102,086 32 $53,034 0 $0 91 $106,891 2 $78,275 FILES CLOSED FOR INCOMPLETENESS 14 $97,213 35 $119,717 266 $113,841 19 $43,589 0 $0 19 $119,466 1 $38,040
Aggregated Statistics For Year 2003(Based on 4 full and 10 partial tracts) A) FHA, FSA/RHS & VA B) Conventional C) Refinancings D) Home Improvement Loans F) Non-occupant Loans on Number Average Value Number Average Value Number Average Value Number Average Value Number Average Value
LOANS ORIGINATED 179 $95,661 1,220 $97,867 2,542 $89,065 122 $40,285 683 $87,225 APPLICATIONS APPROVED, NOT ACCEPTED 2 $103,050 122 $96,712 312 $87,533 44 $36,772 78 $80,852 APPLICATIONS DENIED 21 $106,384 193 $93,927 1,231 $86,061 159 $34,964 123 $71,199 APPLICATIONS WITHDRAWN 18 $88,856 136 $99,351 422 $93,886 15 $26,182 71 $86,691 FILES CLOSED FOR INCOMPLETENESS 2 $78,555 40 $87,092 100 $100,571 5 $47,994 9 $73,644
Aggregated Statistics For Year 2002(Based on 4 full and 4 partial tracts) A) FHA, FSA/RHS & VA B) Conventional C) Refinancings D) Home Improvement Loans E) Loans on Dwellings For 5+ Families F) Non-occupant Loans on Number Average Value Number Average Value Number Average Value Number Average Value Number Average Value Number Average Value
LOANS ORIGINATED 141 $77,509 787 $80,883 873 $80,700 127 $32,294 2 $39,540 458 $74,852 APPLICATIONS APPROVED, NOT ACCEPTED 6 $63,205 77 $83,569 159 $74,915 18 $23,141 0 $0 34 $63,468 APPLICATIONS DENIED 30 $76,969 114 $75,026 444 $73,149 170 $28,053 0 $0 56 $59,873 APPLICATIONS WITHDRAWN 14 $76,749 95 $65,139 254 $75,052 9 $24,754 0 $0 45 $67,878 FILES CLOSED FOR INCOMPLETENESS 2 $48,500 18 $89,752 130 $84,670 3 $16,743 0 $0 8 $56,646
Aggregated Statistics For Year 2001(Based on 4 full and 4 partial tracts) A) FHA, FSA/RHS & VA B) Conventional C) Refinancings D) Home Improvement Loans F) Non-occupant Loans on Number Average Value Number Average Value Number Average Value Number Average Value Number Average Value
LOANS ORIGINATED 222 $68,026 714 $75,750 853 $71,776 108 $26,271 371 $65,713 APPLICATIONS APPROVED, NOT ACCEPTED 6 $59,448 75 $80,898 128 $69,481 39 $31,536 40 $70,759 APPLICATIONS DENIED 18 $72,701 108 $54,841 577 $58,459 106 $18,958 61 $44,358 APPLICATIONS WITHDRAWN 9 $67,516 67 $71,865 286 $64,797 16 $24,548 34 $57,591 FILES CLOSED FOR INCOMPLETENESS 3 $78,897 16 $84,019 63 $78,116 2 $29,195 5 $56,754
Aggregated Statistics For Year 2000(Based on 4 full and 4 partial tracts) A) FHA, FSA/RHS & VA B) Conventional C) Refinancings D) Home Improvement Loans F) Non-occupant Loans on Number Average Value Number Average Value Number Average Value Number Average Value Number Average Value
LOANS ORIGINATED 229 $65,246 635 $66,457 345 $59,430 127 $24,463 260 $56,550 APPLICATIONS APPROVED, NOT ACCEPTED 8 $50,925 73 $63,285 113 $53,762 52 $21,964 33 $61,266 APPLICATIONS DENIED 20 $65,372 147 $75,041 405 $48,554 128 $20,486 58 $52,058 APPLICATIONS WITHDRAWN 15 $66,914 74 $73,044 216 $51,386 19 $29,465 17 $52,444 FILES CLOSED FOR INCOMPLETENESS 7 $54,111 24 $70,018 55 $64,797 2 $8,880 11 $77,465
Aggregated Statistics For Year 1999(Based on 3 full and 4 partial tracts) A) FHA, FSA/RHS & VA B) Conventional C) Refinancings D) Home Improvement Loans F) Non-occupant Loans on Number Average Value Number Average Value Number Average Value Number Average Value Number Average Value
LOANS ORIGINATED 206 $65,575 495 $61,301 488 $55,065 67 $17,955 194 $52,767 APPLICATIONS APPROVED, NOT ACCEPTED 9 $65,619 64 $56,879 137 $58,363 31 $22,058 21 $47,372 APPLICATIONS DENIED 15 $61,576 114 $57,901 399 $56,127 85 $24,353 41 $43,363 APPLICATIONS WITHDRAWN 20 $68,734 55 $66,509 237 $58,560 20 $39,265 21 $53,211 FILES CLOSED FOR INCOMPLETENESS 8 $56,826 16 $62,697 44 $86,888 4 $27,028 8 $45,002
Private Mortgage Insurance Companies Aggregated Statistics For Year 2009(Based on 3 full and 10 partial tracts) A) Conventional B) Refinancings C) Non-occupant Loans on Number Average Value Number Average Value Number Average Value
LOANS ORIGINATED 16 $101,722 1 $75,660 3 $82,733 APPLICATIONS APPROVED, NOT ACCEPTED 15 $180,289 1 $225,920 12 $213,535 APPLICATIONS DENIED 3 $61,257 1 $98,170 2 $47,970 APPLICATIONS WITHDRAWN 0 $0 0 $0 0 $0 FILES CLOSED FOR INCOMPLETENESS 0 $0 0 $0 0 $0
Aggregated Statistics For Year 2008(Based on 4 full and 10 partial tracts) A) Conventional B) Refinancings C) Non-occupant Loans on Number Average Value Number Average Value Number Average Value
LOANS ORIGINATED 75 $143,484 21 $155,987 33 $149,564 APPLICATIONS APPROVED, NOT ACCEPTED 48 $202,024 31 $212,231 27 $240,534 APPLICATIONS DENIED 5 $117,698 3 $89,617 3 $159,683 APPLICATIONS WITHDRAWN 3 $135,340 4 $153,720 4 $129,910 FILES CLOSED FOR INCOMPLETENESS 6 $214,723 2 $146,175 5 $167,434
Aggregated Statistics For Year 2007(Based on 4 full and 10 partial tracts) A) Conventional B) Refinancings C) Non-occupant Loans on Number Average Value Number Average Value Number Average Value
LOANS ORIGINATED 168 $159,323 88 $191,087 76 $182,550 APPLICATIONS APPROVED, NOT ACCEPTED 69 $219,564 30 $189,021 39 $230,523 APPLICATIONS DENIED 3 $342,010 10 $173,425 3 $139,423 APPLICATIONS WITHDRAWN 15 $245,711 13 $220,042 10 $249,434 FILES CLOSED FOR INCOMPLETENESS 0 $0 2 $120,595 0 $0
Aggregated Statistics For Year 2006(Based on 4 full and 10 partial tracts) A) Conventional B) Refinancings C) Non-occupant Loans on Number Average Value Number Average Value Number Average Value
LOANS ORIGINATED 172 $160,816 58 $204,692 72 $167,817 APPLICATIONS APPROVED, NOT ACCEPTED 62 $202,170 29 $204,083 31 $200,518 APPLICATIONS DENIED 1 $285,470 1 $319,160 2 $244,620 APPLICATIONS WITHDRAWN 16 $182,910 5 $214,024 9 $233,402 FILES CLOSED FOR INCOMPLETENESS 3 $365,123 1 $190,570 3 $271,000
Aggregated Statistics For Year 2005(Based on 4 full and 10 partial tracts) A) Conventional B) Refinancings C) Non-occupant Loans on Number Average Value Number Average Value Number Average Value
LOANS ORIGINATED 248 $166,642 38 $170,596 96 $156,954 APPLICATIONS APPROVED, NOT ACCEPTED 48 $145,052 13 $162,239 22 $131,821 APPLICATIONS DENIED 4 $150,495 0 $0 2 $150,740 APPLICATIONS WITHDRAWN 12 $143,001 4 $194,612 9 $145,707 FILES CLOSED FOR INCOMPLETENESS 5 $108,082 1 $104,770 4 $100,020
Aggregated Statistics For Year 2004(Based on 4 full and 10 partial tracts) A) Conventional B) Refinancings C) Non-occupant Loans on Number Average Value Number Average Value Number Average Value
LOANS ORIGINATED 284 $119,840 61 $108,772 104 $115,445 APPLICATIONS APPROVED, NOT ACCEPTED 63 $141,777 26 $107,173 23 $132,305 APPLICATIONS DENIED 8 $171,851 2 $145,425 3 $228,043 APPLICATIONS WITHDRAWN 13 $132,308 7 $91,480 6 $114,367 FILES CLOSED FOR INCOMPLETENESS 0 $0 2 $108,735 0 $0
Aggregated Statistics For Year 2003(Based on 4 full and 10 partial tracts) A) Conventional B) Refinancings C) Non-occupant Loans on Number Average Value Number Average Value Number Average Value
LOANS ORIGINATED 345 $101,498 152 $97,340 133 $91,935 APPLICATIONS APPROVED, NOT ACCEPTED 49 $99,731 40 $125,794 19 $93,589 APPLICATIONS DENIED 7 $123,810 2 $109,450 1 $230,070 APPLICATIONS WITHDRAWN 9 $122,592 11 $111,777 3 $122,310 FILES CLOSED FOR INCOMPLETENESS 0 $0 1 $110,730 0 $0
Aggregated Statistics For Year 2002(Based on 4 full and 4 partial tracts) A) Conventional B) Refinancings C) Non-occupant Loans on Number Average Value Number Average Value Number Average Value
LOANS ORIGINATED 215 $84,275 80 $87,042 88 $84,923 APPLICATIONS APPROVED, NOT ACCEPTED 24 $82,387 21 $91,559 8 $80,229 APPLICATIONS DENIED 5 $65,298 5 $84,462 4 $61,520 APPLICATIONS WITHDRAWN 9 $75,880 7 $86,326 6 $69,630 FILES CLOSED FOR INCOMPLETENESS 0 $0 0 $0 0 $0
Aggregated Statistics For Year 2001(Based on 4 full and 4 partial tracts) A) Conventional B) Refinancings C) Non-occupant Loans on Number Average Value Number Average Value Number Average Value
LOANS ORIGINATED 174 $79,397 54 $71,296 67 $68,901 APPLICATIONS APPROVED, NOT ACCEPTED 14 $97,767 4 $74,705 3 $128,477 APPLICATIONS DENIED 2 $155,930 6 $71,190 2 $38,550 APPLICATIONS WITHDRAWN 3 $55,243 2 $97,660 3 $55,243 FILES CLOSED FOR INCOMPLETENESS 4 $76,610 0 $0 0 $0
Aggregated Statistics For Year 2000(Based on 4 full and 4 partial tracts) A) Conventional B) Refinancings C) Non-occupant Loans on Number Average Value Number Average Value Number Average Value
LOANS ORIGINATED 154 $76,540 18 $64,212 42 $67,257 APPLICATIONS APPROVED, NOT ACCEPTED 10 $101,694 1 $83,050 2 $106,760 APPLICATIONS DENIED 5 $64,966 0 $0 5 $64,966 APPLICATIONS WITHDRAWN 5 $55,646 0 $0 2 $48,435 FILES CLOSED FOR INCOMPLETENESS 0 $0 0 $0 0 $0
Aggregated Statistics For Year 1999(Based on 3 full and 4 partial tracts) A) Conventional B) Refinancings C) Non-occupant Loans on Number Average Value Number Average Value Number Average Value
LOANS ORIGINATED 95 $60,552 27 $76,425 29 $48,823 APPLICATIONS APPROVED, NOT ACCEPTED 6 $53,760 3 $87,013 2 $37,295 APPLICATIONS DENIED 6 $48,390 2 $89,405 1 $50,190 APPLICATIONS WITHDRAWN 1 $25,310 1 $133,060 0 $0 FILES CLOSED FOR INCOMPLETENESS 1 $48,360 0 $0 1 $25,820
2002 - 2018 National Fire Incident Reporting System (NFIRS) incidents See full 2006 National Fire Incident Reporting System statistics for zip code 33952, Florida
Most common first names in zip code 33952 among deceased individuals Name Count Lived (average)
John 444 76.1 years William 384 76.2 years Mary 339 80.5 years Robert 285 73.3 years James 268 74.8 years George 265 77.3 years Joseph 265 77.1 years Charles 239 77.1 years Margaret 204 80.3 years Helen 195 80.4 years
Most common last names in zip code 33952 among deceased individuals Last name Count Lived (average)
Smith 134 78.4 years Johnson 88 80.5 years Miller 88 78.0 years Brown 78 76.4 years Davis 62 78.5 years Jones 54 78.4 years Anderson 52 79.0 years Williams 51 77.6 years Wilson 48 78.7 years Martin 38 80.8 years
Businesses in zip code 33952
Name Count Name Count
7-Eleven 1 Lane Furniture 1 AT&T 2 Little Caesars Pizza 1 Ace Hardware 1 Long John Silver's 1 Advance Auto Parts 1 McDonald's 2 AutoZone 1 Microtel 1 CVS 1 Nike 2 Circle K 4 Pizza Hut 1 DHL 1 RadioShack 1 Dairy Queen 1 Sprint Nextel 1 Dunkin Donuts 1 Subway 1 FedEx 6 T-Mobile 1 Ford 1 Tire Kingdom 1 Goodwill 1 U-Haul 1 H&R Block 1 UPS 7 Jones New York 1 Walgreens 1 Knights Inn 1

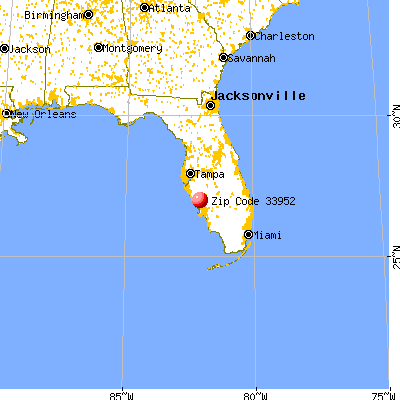


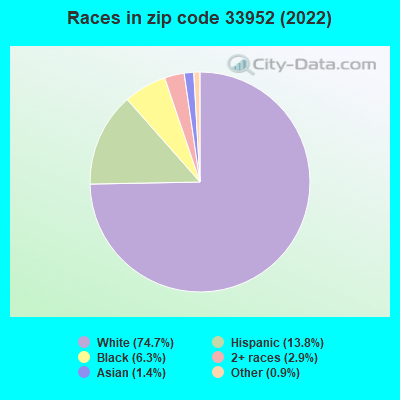


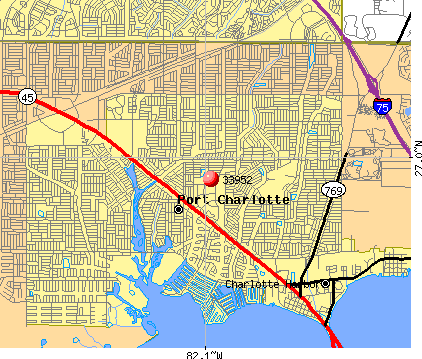 Nearest zip codes: 33954, 33980, 33948, 34288, 33983, 33950.
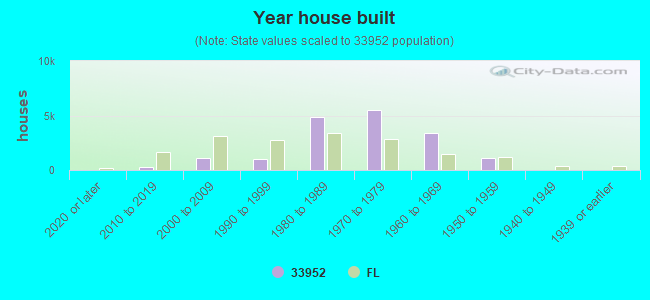

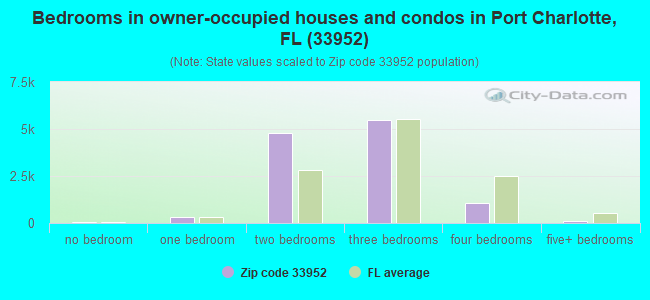
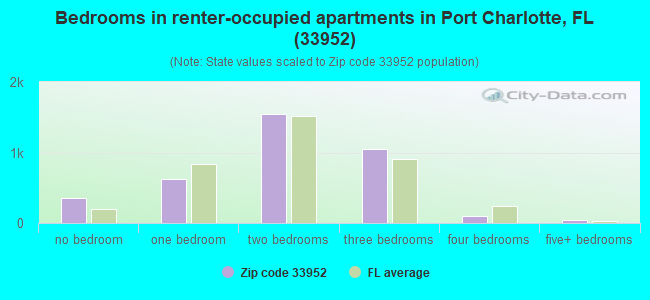
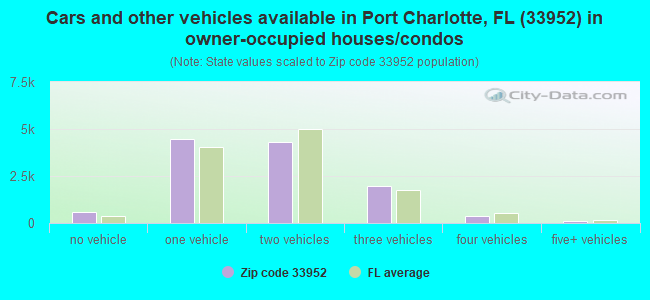
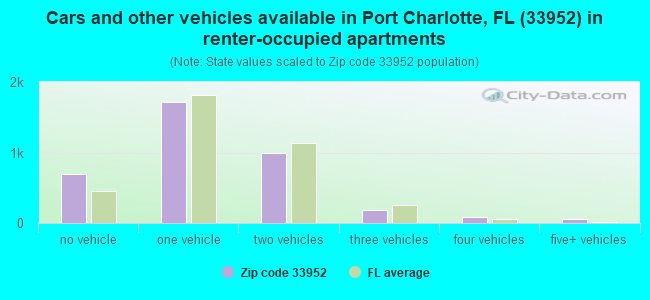


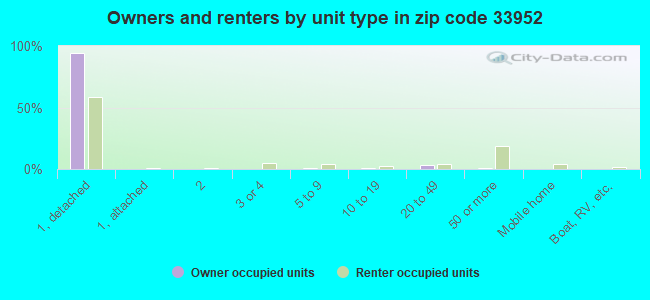
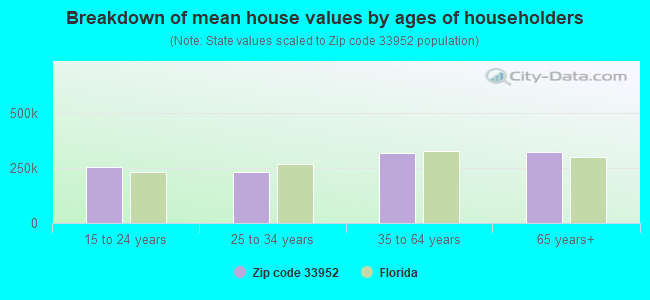


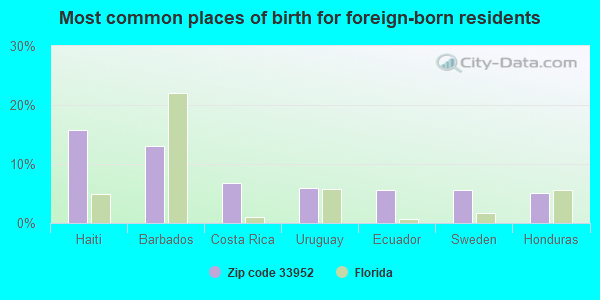
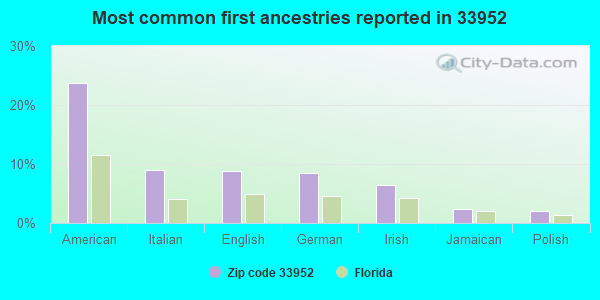
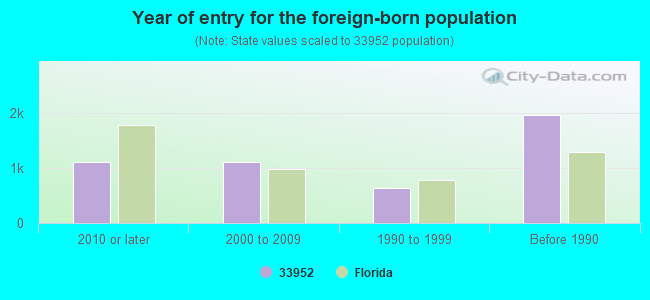


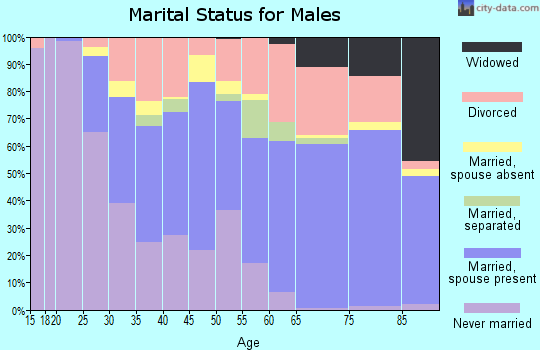
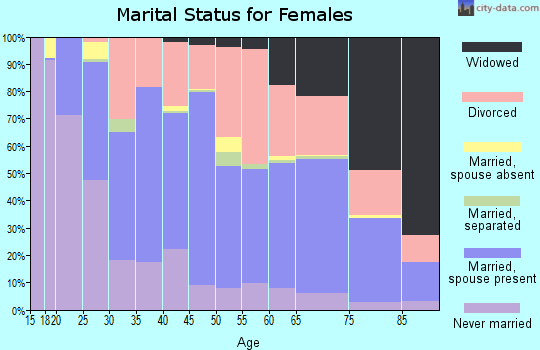
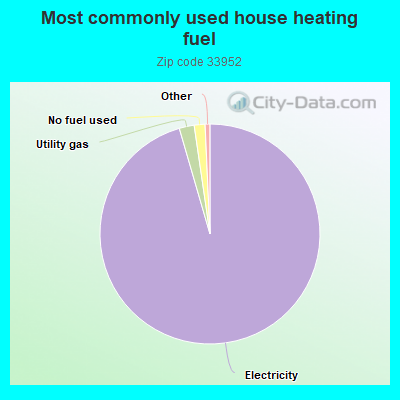

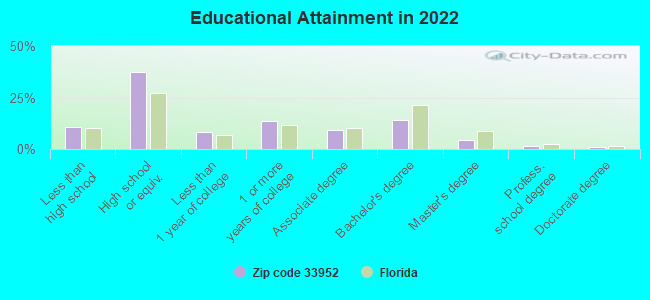
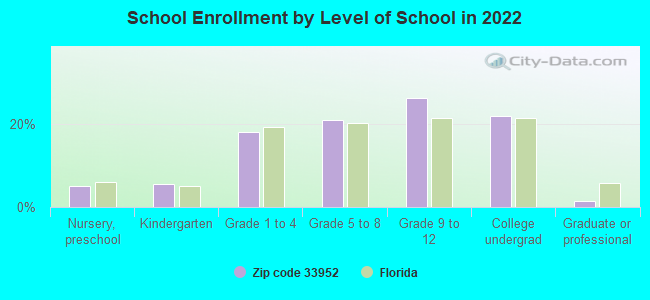
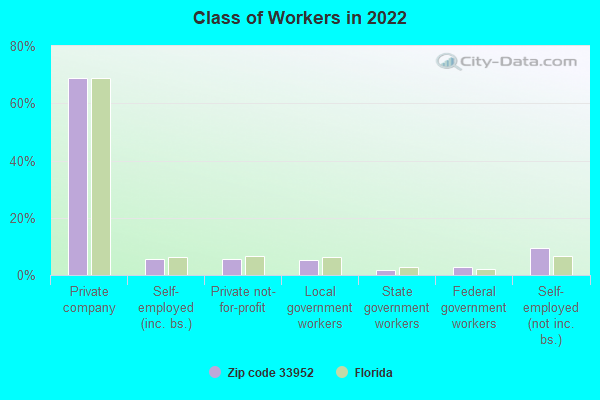
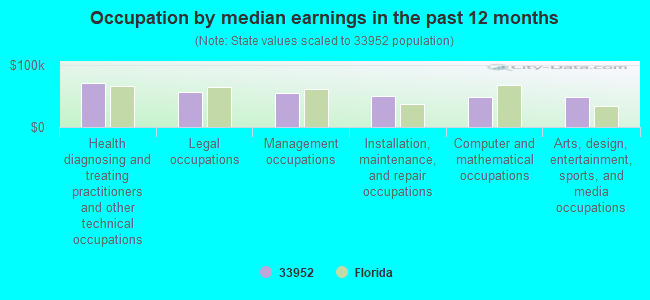
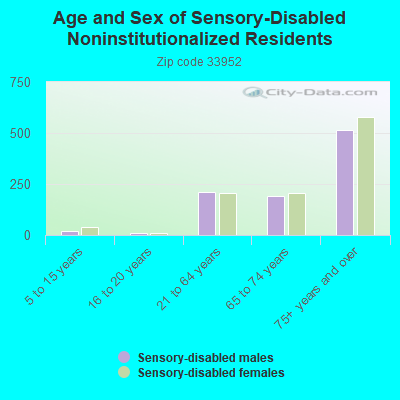
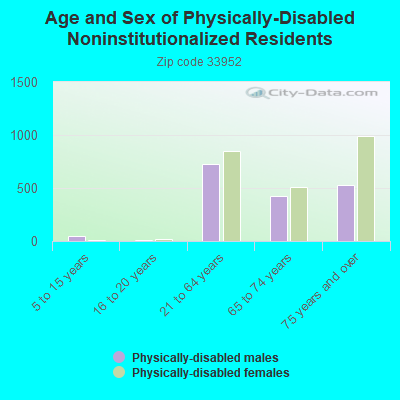
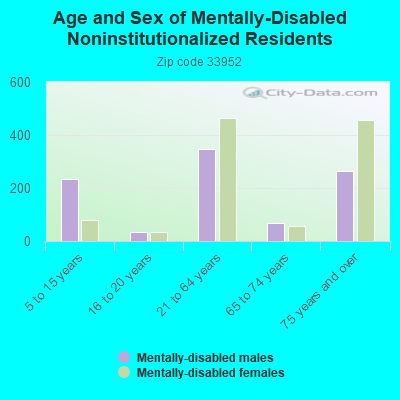
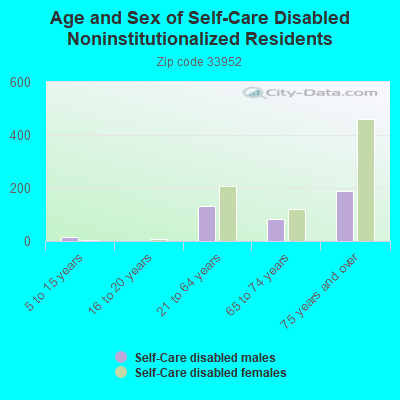
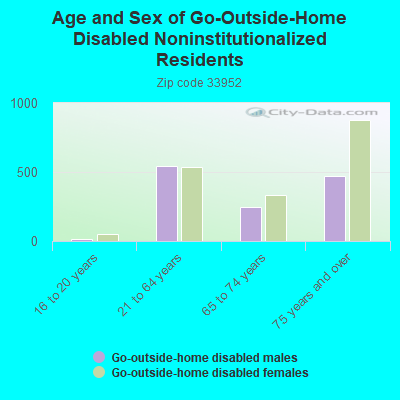
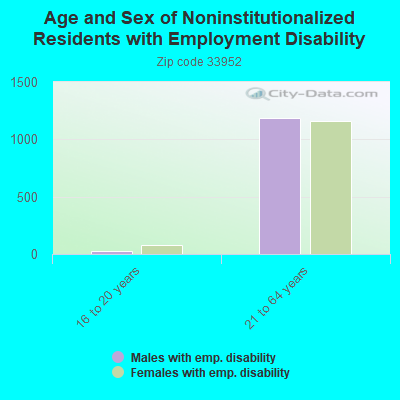
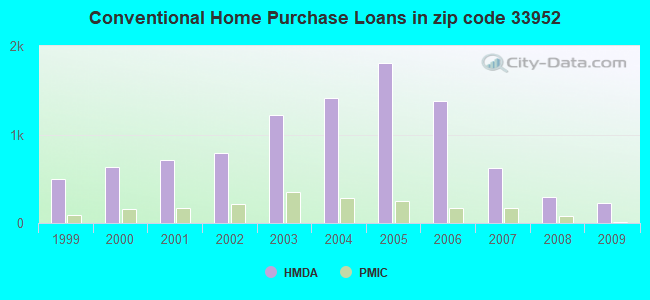
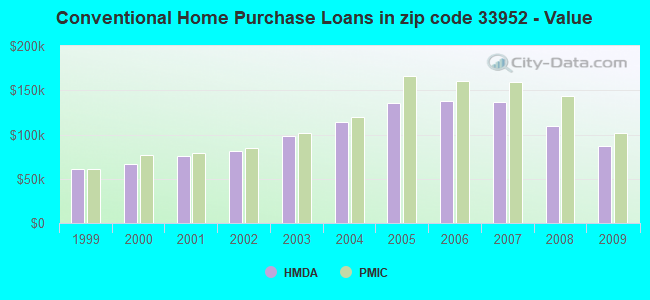
 According to the data from the years 2002 - 2018 the average number of fire incidents per year is 86. The highest number of fires - 152 took place in 2004, and the least - 0 in 2003. The data has a growing trend.
 When looking into fire subcategories, the most incidents belonged to: Outside Fires (52.1%), and Structure Fires (28.5%).