Estimated zip code population in 2022: 25,398 Zip code population in 2010: 20,699 Zip code population in 2000: 19,361
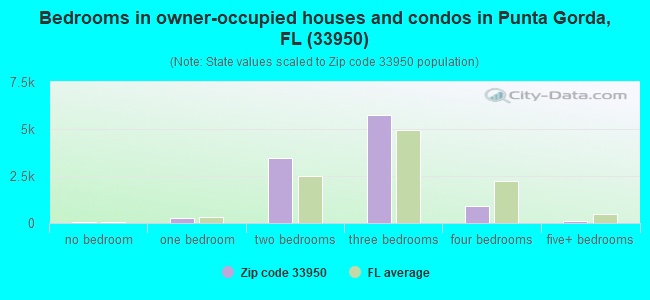
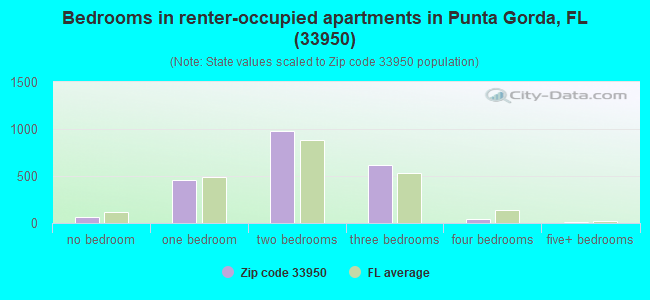
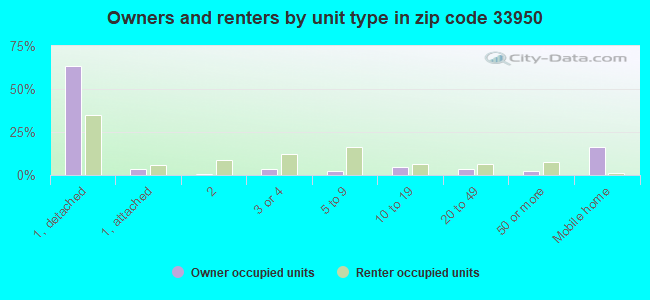
Houses and condos: 17,082 Renter-occupied apartments: 2,193
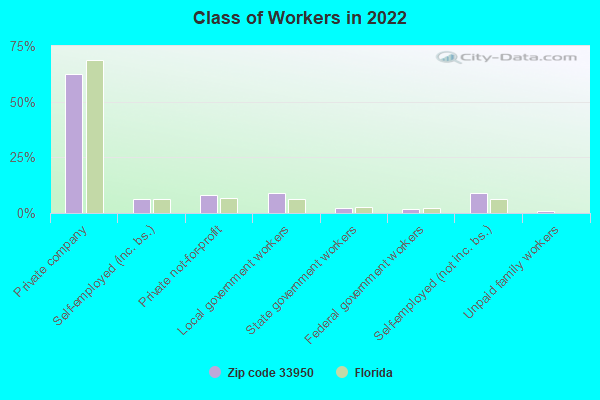
% of renters here:
17%
State:
33%
March 2022 cost of living index in zip code 33950: 92.0 (less than average, U.S. average is 100)
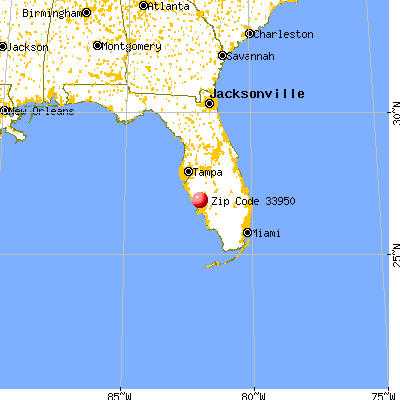
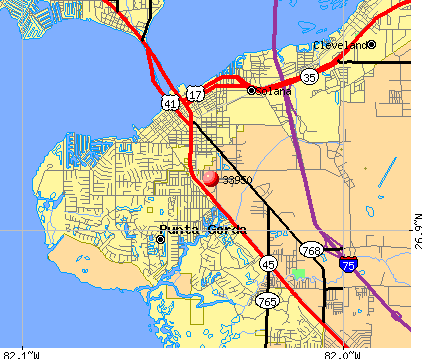
Land area: 22.4 sq. mi. Water area: 8.0 sq. mi.
Population density: 1,132 people per square mile
(low).
OSM Map
General Map
Google Map
MSN Map
OSM Map
General Map
Google Map
MSN Map
OSM Map
General Map
Google Map
MSN Map
OSM Map
General Map
Google Map
MSN Map
Please wait while loading the map...
Real estate property taxes paid for housing units in 2022:
This zip code:
0.9% ($4,034)
Florida:
0.7% ($2,529)
Median real estate property taxes paid for housing units with mortgages in 2022: $4,392 (0.9%) Median real estate property taxes paid for housing units with no mortgage in 2022: $3,782 (1.0%)
Estimated median house/condo value in 2022: $451,896
33950:
$451,896
Florida:
$354,100
According to our research of Florida and other state lists, there were 21 registered sex offenders living in 33950 zip code as of April 27, 2024. The ratio of all residents to sex offenders in zip code 33950 is 1,000 to 1. The ratio of registered sex offenders to all residents in this zip code is lower than the state average.
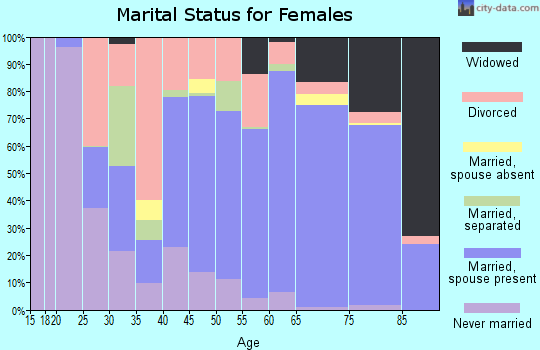
Median resident age:
This zip code:
64.1 years
Florida median age:
42.7 years
Average household size:
This zip code:
2.0 people
Florida:
2.5 people
Averages for the 2020 tax year for zip code 33950, filed in 2021:
Average Adjusted Gross Income (AGI) in 2020: $106,305 (Individual Income Tax Returns)
Here:
$106,305
State:
$82,200
Salary/wage: $68,657 (reported on 53.4% of returns)
Here:
$68,657
State:
$58,347
(% of AGI for various income ranges: 950.2% for AGIs below $25k, 2709.0% for AGIs $25k-50k, 3867.0% for AGIs $50k-75k, 4520.9% for AGIs $75k-100k, 9437.8% for AGIs $100k-200k, 68459.1% for AGIs over 200k)
Taxable interest for individuals: $3,919 (reported on 54.5% of returns)
This zip code:
$3,919
Florida:
$4,272
(% of AGI for various income ranges: 84.6% for AGIs below $25k, 89.9% for AGIs $25k-50k, 211.1% for AGIs $50k-75k, 336.9% for AGIs $75k-100k, 585.9% for AGIs $100k-200k, 3885.6% for AGIs over 200k)
Ordinary dividends: $13,528 (reported on 45.3% of returns)
Here:
$13,528
State:
$15,863
(% of AGI for various income ranges: 130.2% for AGIs below $25k, 235.3% for AGIs $25k-50k, 600.8% for AGIs $50k-75k, 922.5% for AGIs $75k-100k, 1787.4% for AGIs $100k-200k, 11664.1% for AGIs over 200k)
Net capital gain/loss in AGI: +$30,083 (reported on 42.8% of returns)
Here:
+$30,083
State:
+$62,983
(% of AGI for various income ranges: 47.2% for AGIs below $25k, 98.5% for AGIs $25k-50k, 364.8% for AGIs $50k-75k, 763.1% for AGIs $75k-100k, 2158.7% for AGIs $100k-200k, 38727.8% for AGIs over 200k)
Profit/loss from business: +$21,746 (reported on 13.4% of returns)
Here:
+$21,746
State:
+$9,719
(% of AGI for various income ranges: 125.8% for AGIs below $25k, 183.8% for AGIs $25k-50k, 214.7% for AGIs $50k-75k, 304.4% for AGIs $75k-100k, 687.7% for AGIs $100k-200k, 5889.4% for AGIs over 200k)
Taxable individual retirement arrangement distribution: $30,287 (reported on 28.8% of returns)
33950:
$30,287
Florida:
$24,823
(% of AGI for various income ranges: 182.4% for AGIs below $25k, 407.5% for AGIs $25k-50k, 1015.1% for AGIs $50k-75k, 1882.8% for AGIs $75k-100k, 3737.6% for AGIs $100k-200k, 10277.8% for AGIs over 200k)
Self-employed (Keogh) retirement plans: $26,522 (reported on 0.7% of returns)
33950:
$26,522
Florida:
$29,694
(% of AGI for various income ranges: 57.9% for AGIs $100k-200k, 530.6% for AGIs over 200k)
Total itemized deductions: $38,466 (reported on 12.7% of returns)
Here:
$38,466
State:
$45,393
(% of AGI for various income ranges: 135.2% for AGIs below $25k, 291.6% for AGIs $25k-50k, 624.9% for AGIs $50k-75k, 810.2% for AGIs $75k-100k, 1517.6% for AGIs $100k-200k, 7674.4% for AGIs over 200k)
Charity contributions: $10,853 (reported on 10.5% of returns)
Here:
$10,853
State:
$20,178
(% of AGI for various income ranges: 8.3% for AGIs below $25k, 22.6% for AGIs $25k-50k, 58.2% for AGIs $50k-75k, 124.1% for AGIs $75k-100k, 334.8% for AGIs $100k-200k, 2620.9% for AGIs over 200k)
Taxes paid: $7,785 (reported on 12.5% of returns)
33950:
$7,785
State:
$6,967
(% of AGI for various income ranges: 24.4% for AGIs below $25k, 46.4% for AGIs $25k-50k, 127.1% for AGIs $50k-75k, 184.2% for AGIs $75k-100k, 352.5% for AGIs $100k-200k, 1371.9% for AGIs over 200k)
Earned income credit: $1,975 (reported on 8.1% of returns)
Here:
$1,975
State:
$2,306
(% of AGI for various income ranges: 68.6% for AGIs below $25k, 39.5% for AGIs $25k-50k)
Percentage of individuals using paid preparers for their 2020 taxes: 91.3%
Here:
91%
State:
92%
(% for various income ranges: 90.8% for AGIs below $25k, 90.9% for AGIs $25k-50k, 90.3% for AGIs $50k-75k, 91.3% for AGIs $75k-100k, 92.5% for AGIs $100k-200k, 92.4% for AGIs over 200k)
Averages for the 2012 tax year for zip code 33950, filed in 2013:
Average Adjusted Gross Income (AGI) in 2012: $82,364 (Individual Income Tax Returns)
Here:
$82,364
State:
$60,316
Salary/wage: $49,960 (reported on 53.6% of returns)
Here:
$49,960
State:
$45,277
(% of AGI for various income ranges: 53.1% for AGIs below $25k, 44.3% for AGIs $25k-50k, 31.9% for AGIs $50k-75k, 23.9% for AGIs $75k-100k, 30.7% for AGIs $100k-200k, 31.0% for AGIs over 200k)
Taxable interest for individuals: $3,553 (reported on 56.4% of returns)
This zip code:
$3,553
Florida:
$3,587
(% of AGI for various income ranges: 3.3% for AGIs below $25k, 2.7% for AGIs $25k-50k, 2.9% for AGIs $50k-75k, 2.1% for AGIs $75k-100k, 2.8% for AGIs $100k-200k, 2.0% for AGIs over 200k)
Ordinary dividends: $11,151 (reported on 44.7% of returns)
Here:
$11,151
State:
$12,831
(% of AGI for various income ranges: 6.2% for AGIs below $25k, 5.4% for AGIs $25k-50k, 5.4% for AGIs $50k-75k, 6.3% for AGIs $75k-100k, 6.6% for AGIs $100k-200k, 5.9% for AGIs over 200k)
Net capital gain/loss in AGI: +$25,371 (reported on 40.1% of returns)
Here:
+$25,371
State:
+$33,493
(% of AGI for various income ranges: 1.7% for AGIs $50k-75k, 2.5% for AGIs $75k-100k, 4.2% for AGIs $100k-200k, 28.8% for AGIs over 200k)
Profit/loss from business: +$14,020 (reported on 14.2% of returns)
Here:
+$14,020
State:
+$10,012
(% of AGI for various income ranges: 6.4% for AGIs below $25k, 2.5% for AGIs $25k-50k, 2.5% for AGIs $50k-75k, 1.5% for AGIs $75k-100k, 2.4% for AGIs $100k-200k, 2.1% for AGIs over 200k)
Taxable individual retirement arrangement distribution: $27,358 (reported on 33.2% of returns)
33950:
$27,358
Florida:
$21,544
(% of AGI for various income ranges: 9.7% for AGIs below $25k, 10.1% for AGIs $25k-50k, 11.1% for AGIs $50k-75k, 13.8% for AGIs $75k-100k, 13.6% for AGIs $100k-200k, 8.8% for AGIs over 200k)
Self-employment retirement plans: $18,771 (reported on 0.7% of returns)
33950:
$18,771
Florida:
$20,611
(% of AGI for various income ranges: 0.6% for AGIs below $25k, 0.2% for AGIs $100k-200k, 0.2% for AGIs over 200k)
Total itemized deductions: $27,159 (19% of AGI, reported on 39.6% of returns)
Here:
$27,159
State:
$25,533
Here:
19.0% of AGI
State:
18.0% of AGI
(% of AGI for various income ranges: 21.1% for AGIs below $25k, 17.0% for AGIs $25k-50k, 15.4% for AGIs $50k-75k, 14.3% for AGIs $75k-100k, 14.4% for AGIs $100k-200k, 9.1% for AGIs over 200k)
Charity contributions: $3,920 (reported on 34.5% of returns)
Here:
$3,920
State:
$5,698
(% of AGI for various income ranges: 1.2% for AGIs below $25k, 1.4% for AGIs $25k-50k, 1.6% for AGIs $50k-75k, 1.8% for AGIs $75k-100k, 1.9% for AGIs $100k-200k, 1.5% for AGIs over 200k)
Taxes paid: $9,187 (reported on 39.0% of returns)
33950:
$9,187
State:
$6,203
(% of AGI for various income ranges: 4.7% for AGIs below $25k, 4.2% for AGIs $25k-50k, 4.4% for AGIs $50k-75k, 4.5% for AGIs $75k-100k, 5.0% for AGIs $100k-200k, 3.8% for AGIs over 200k)
Earned income credit: $2,005 (reported on 10.9% of returns)
Here:
$2,005
State:
$2,372
(% of AGI for various income ranges: 4.5% for AGIs below $25k, 0.4% for AGIs $25k-50k)
Percentage of individuals using paid preparers for their 2012 taxes: 57.0%
Here:
57%
State:
54%
(% for various income ranges: 47.8% for AGIs below $25k, 54.4% for AGIs $25k-50k, 58.8% for AGIs $50k-75k, 61.8% for AGIs $75k-100k, 65.2% for AGIs $100k-200k, 82.5% for AGIs over 200k)
Averages for the 2004 tax year for zip code 33950, filed in 2005:
Average Adjusted Gross Income (AGI) in 2004: $71,869 (Individual Income Tax Returns)
Here:
$71,869
State:
$50,523
Salary/wage: $45,670 (reported on 55.5% of returns)
Here:
$45,670
State:
$39,563
(% of AGI for various income ranges: 48.3% for AGIs $10k-25k, 39.7% for AGIs $25k-50k, 28.4% for AGIs $50k-75k, 28.3% for AGIs $75k-100k, 34.9% for AGIs over 100k)
Taxable interest for individuals: $4,571 (reported on 71.7% of returns)
This zip code:
$4,571
Florida:
$3,211
(% of AGI for various income ranges: 7.0% for AGIs $10k-25k, 5.9% for AGIs $25k-50k, 5.0% for AGIs $50k-75k, 4.8% for AGIs $75k-100k, 3.8% for AGIs over 100k)
Taxable dividends: $8,000 (reported on 53.4% of returns)
Here:
$8,000
State:
$6,129
(% of AGI for various income ranges: 7.1% for AGIs $10k-25k, 5.9% for AGIs $25k-50k, 5.4% for AGIs $50k-75k, 5.8% for AGIs $75k-100k, 5.8% for AGIs over 100k)
Net capital gain/loss: +$19,407 (reported on 48.1% of returns)
Here:
+$19,407
State:
+$27,205
(% of AGI for various income ranges: 0.6% for AGIs $10k-25k, 2.1% for AGIs $25k-50k, 4.3% for AGIs $50k-75k, 5.0% for AGIs $75k-100k, 19.5% for AGIs over 100k)
Profit/loss from business: +$21,421 (reported on 14.1% of returns)
Here:
+$21,421
State:
+$10,634
(% of AGI for various income ranges: 4.8% for AGIs $10k-25k, 3.1% for AGIs $25k-50k, 4.1% for AGIs $50k-75k, 2.8% for AGIs $75k-100k, 4.7% for AGIs over 100k)
IRA payment deduction: $3,857 (reported on 3.1% of returns)
33950:
$3,857
Florida:
$3,082
(% of AGI for various income ranges: 0.3% for AGIs $10k-25k, 0.4% for AGIs $25k-50k, 0.3% for AGIs $50k-75k, 0.2% for AGIs $75k-100k, 0.1% for AGIs over 100k)
Self-employed pension: $16,991 (reported on 1.3% of returns)
Here:
$16,991
Florida:
$15,857
(% of AGI for various income ranges: 0.2% for AGIs $10k-25k, 0.3% for AGIs $50k-75k, 0.1% for AGIs $75k-100k, 0.4% for AGIs over 100k)
Total itemized deductions: $28,146 (25% of AGI, reported on 46.2% of returns)
Here:
$28,146
State:
$20,370
Here:
25.3% of AGI
State:
20.7% of AGI
(% of AGI for various income ranges: 30.1% for AGIs $10k-25k, 25.7% for AGIs $25k-50k, 23.9% for AGIs $50k-75k, 21.2% for AGIs $75k-100k, 13.0% for AGIs over 100k)
Charity contributions deductions: $3,852 (3% of AGI, reported on 40.1% of returns)
Here:
$3,852
State:
$4,064
Here:
3.2% of AGI
State:
3.8% of AGI
(% of AGI for various income ranges: 1.6% for AGIs $10k-25k, 1.9% for AGIs $25k-50k, 2.1% for AGIs $50k-75k, 1.8% for AGIs $75k-100k, 2.3% for AGIs over 100k)
Total tax: $13,893 (reported on 77.1% of returns)
33950:
$13,893
State:
$9,431
(% of AGI for various income ranges: 3.3% for AGIs $10k-25k, 6.2% for AGIs $25k-50k, 8.8% for AGIs $50k-75k, 10.3% for AGIs $75k-100k, 19.6% for AGIs over 100k)
Earned income credit: $1,557 (reported on 8.6% of returns)
Here:
$1,557
State:
$1,808
Percentage of individuals using paid preparers for their 2004 taxes: 63.8%
Here:
64%
State:
60%
(% for various income ranges: 56.5% for AGIs below $10k, 61.1% for AGIs $10k-25k, 63.2% for AGIs $25k-50k, 63.3% for AGIs $50k-75k, 62.1% for AGIs $75k-100k, 75.9% for AGIs over 100k)
Likely homosexual households (counted as self-reported same-sex unmarried-partner households)
Lesbian couples: 0.0% of all households
Gay men: 0.0% of all households
Household received Food Stamps/SNAP in the past 12 months: 745 Household did not receive Food Stamps/SNAP in the past 12 months: 12,047
Women who had a birth in the past 12 months: 27 (24 now married, 3 unmarried) Women who did not have a birth in the past 12 months: 2,452 (1,087 now married, 1,365 unmarried)
Housing units in zip code 33950 with a mortgage: 3,871 (439 second mortgage, 4 home equity loan, 402 both second mortgage and home equity loan) Median monthly owner costs for units with a mortgage: $2,362 Median monthly owner costs for units without a mortgage: $850
Residents with income below the poverty level in 2022:
This zip code:
10.1%
Whole state:
12.7%
Residents with income below 50% of the poverty level in 2022:
This zip code:
3.7%
Whole state:
6.6%
Median number of rooms in houses and condos:
Here:
5.5
State:
5.9
Median number of rooms in apartments:
Here:
4.2
State:
4.2
Notable locations in this zip code not listed on our city pages
Notable locations in zip code 33950: Stoneybrook Golf Club (A), Stonebridge Golf and Country Club (B), Saint Johns Golf and Country Club (C), Twin Isles Country Club (D), Saint Andrews South Golf Club (E), Aqui Esta Center (F), Cross Trail Center (G), Florida Adventure Museum (H), Charlotte County Memorial Auditorium and Civic Center (I), Charlotte Performing Art Center (J), Charlotte County Public Library System Punta Gorda Branch Library (K), Florida Military Heritage Museum (L), Charlotte County Courthouse (M), Punta Gorda Public Library (N), City of Punta Gorda Fire Department (O), Charlotte County Fire and Rescue Station 7 (P), Charlotte County Fire and Emergency Medical Services Station 17 (Q), Charlotte Regional Medical Center Riverside Behavioral Center (R), Punta Gorda Fire Department Station 2 (S), City of Punta Gorda Fire Department Station 3 (T). Display/hide their locations on the map
Shopping Centers: Fishermens Village Shopping Center (1), Charlotte Shopping Center (2), Promenades Shopping Center (3). Display/hide their locations on the map
Churches in zip code 33950 include: Sacred Heart Catholic Church (A), Peace River Baptist Church (B), First Baptist Church of Punta Gorda (C), Episcopal Church of the Good Shepherd (D), Congregational United Church of Christ (E), Church of the Nazarene (F), Church of God of Prophecy (G), Church of Christ of Peace River (H), Bethel African Methodist Episcopal Church (I). Display/hide their locations on the map
In group quarters: 229 (-1 institutionalized population)
Size of family households: 6,415 2-persons, 1,107 3-persons, 688 4-persons, 136 5-persons, 60 6-persons, 24 7-or-more-persons
Size of nonfamily households: 3,580 1-person, 709 2-persons, 7 3-persons
1,571 married couples with children.
842 single-parent households (366 men, 476 women).
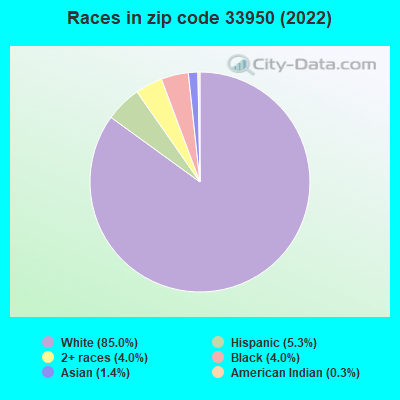
94.1% of residents of 33950 zip code speak English at home.
3.2% of residents speak Spanish at home (73% very well, 19% well, 7% not well, 1% not at all).
2.2% of residents speak other Indo-European language at home (86% very well, 12% well, 1% not well).
0.9% of residents speak Asian or Pacific Island language at home (60% very well, 35% well, 4% not well).
0.3% of residents speak other language at home (50% very well, 50% well).
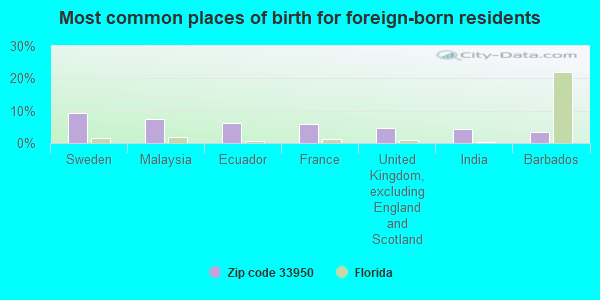
Foreign born population: 1,885 (7.4%) (68.1% of them are naturalized citizens)
This zip code:
7.4%
Whole state:
21.7%
9%Sweden
7%Malaysia
6%Ecuador
6%France
4%United Kingdom, excluding England and Scotland
4%India
3%Barbados
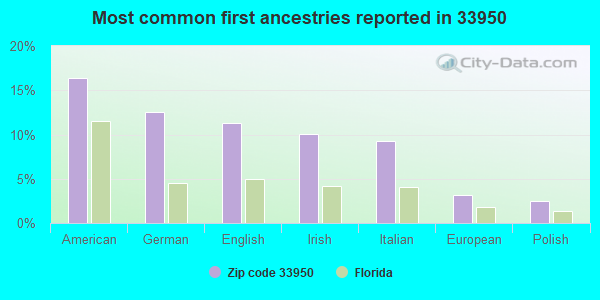
16%American
13%German
11%English
10%Irish
9%Italian
3%European
2%Polish
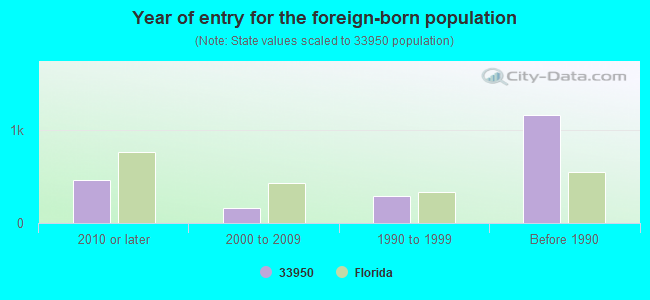
Year of entry for the foreign-born population
4682010 or later
1612000 to 2009
2891990 to 1999
1,164Before 1990
Major facilities with environmental interests located in this zip code:
PUNTA GORDA CBP (3333 ACLINE RD in PUNTA GORDA, FL)
STATE MASTER (FDM) - WAFR-FLG110031, INDUSTRIAL WASTEWATER PROGRAM, WAFR-FLR05A245, NPDES STORMWATER PROGRAM, NPDES STORMWATER PERMIT National Pollutant Discharge Elimination System NON-MAJOR (Tracking pollutant discharge elimination systems) - permit Business SIC classification: READY-MIXED CONCRETE Organizations: CREATIVE ENVIRONMENTAL SOLUTIONS, SCHWAB READY MIX, INC. (CONTACT/APPLICANT)
, RICHARD HIRE (CONTACT/OWNER)
, SCHWAB READY MIX, INC. (CONTACT/PERMIT)
Alternative names: SCHWAB READY MIX INC
PUNTA GORDA READY MIX (2901 COOPER STREET in PUNTA GORDA, FL)
STATE MASTER (FDM) - WAFR-FLG110527, INDUSTRIAL WASTEWATER PROGRAM National Pollutant Discharge Elimination System NON-MAJOR (Tracking pollutant discharge elimination systems) - permit Business SIC classification: READY-MIXED CONCRETE Organizations: AL ANDREANSKY CONSULTING, FLORIDA ROCK INDUSTRIES, INC. (CONTACT/APPLICANT)
, FLORIDA ROCK INDUST., INC.(155) (CONTACT/APPLICANT)
Alternative names: FLORIDA ROCK AKA: PUNTA GORDA, FLORIDA ROCK AKA: PUNTA GORDA READY MIX
SHELL STATION (3035 TAMIAMI TRL in PUNTA GORDA, FL)
STATE MASTER (FDM) - CHAZ-FLD984223362, HAZARDOUS WASTE REGULATION PROGRAM National Pollutant Discharge Elimination System NON-MAJOR (Tracking pollutant discharge elimination systems) - permit Business SIC classification: NATURAL GAS TRANSMISSION AND DISTRIBUTION Organizations: SUPERAMERICA OF FLORIDA #8039, DAVID SCHENK (CONTACT/OWNER)
Alternative names: SHELL STATION 3035 TAMIAMI TRL, SUPERAMERICA OF FLORIDA #8039
SHELL STATION (6117 DUNCAN RD in PUNTA GORDA, FL)
STATE MASTER (FDM) - CHAZ-FLD984223370, HAZARDOUS WASTE REGULATION PROGRAM National Pollutant Discharge Elimination System NON-MAJOR (Tracking pollutant discharge elimination systems) - permit Business SIC classification: NATURAL GAS TRANSMISSION AND DISTRIBUTION Organizations: SUPERAMERICA OF FLORIDA #8044, WALTER TEMPLE (CONTACT/OWNER)
Alternative names: SHELL STATION 6117 DUNCAN ROAD, SUPERAMERICA OF FLORIDA #8044
ROBERT-CHANCEY SUMNER (2531 TAYLOR RD in PUNTA GORDA, FL)
STATE MASTER (FDM) - CHAZ-FLR000125153, HAZARDOUS WASTE REGULATION PROGRAM (Resource Conservation and Recovery Act (tracking hazardous waste)) Business SIC classification: AUTOMOTIVE SERVICES, EXCEPT REPAIR AND CARWASHES Organizations: DAISY PETIT MOONEY (CONTACT/OWNER)
Alternative names: 2531 TAYLOR RD
SALLIE JONES ELEMENTARY SCHOOL (1221 COOPER STREET in PUNTA GORDA, FL)
(Geographic Names Information System) (National Center for Education Statistics) - STATE ID-0021 Organizations: CHARLOTTE COUNTY SCHOOL DISTRICT (SCHOOL DISTRICT)
PUNTA GORDA MIDDLE SCHOOL (825 CARMALITA STREET in PUNTA GORDA, FL)
(National Center for Education Statistics) - STATE ID-0121 Organizations: CHARLOTTE COUNTY SCHOOL DISTRICT (SCHOOL DISTRICT)
KELLY HALL (2208 CASTILLA AVENUE in PUNTA GORDA, FL)
(National Center for Education Statistics) - STATE ID-0271 Organizations: CHARLOTTE COUNTY SCHOOL DISTRICT (SCHOOL DISTRICT)
PUNTA GORDA PLANT (3433 ACLINE RD in PUNTA GORDA, FL)
(Integrated Compliance Information System) - ICIS-04-2001-0086, FORMAL ENFORCEMENT ACTION Business SIC classification: READY-MIXED CONCRETE
PUNTA GORDA WWTP (1051 W VIRGINIA AVE in PUNTA GORDA, FL)
(Integrated Compliance Information System) - ICIS-04-1977-0021, FORMAL ENFORCEMENT ACTION Business SIC classification: SEWERAGE SYSTEMS
AJAX PAVING INDUSTRIES (40851 COOK BROWN RD in PUNTA GORDA, FL)
AIR SYNTHETIC MINOR (AIRS/AFS) CRITERIA AND HAZARDOUS AIR POLLUTANT INVENTORY (Inventory of air pollution sources) (Resource Conservation and Recovery Act (tracking hazardous waste)) Business SIC classification: ASPHALT PAVING MIXTURES AND BLOCKS Organizations: STEVEN MARKS, OPER MGR (CONTACT/OWNER)
Alternative names: AJAX PAVING INDUSTRIES OF FLORIDA
HAMPTON POINT APARTMENTS (2511 LUTHER RD in PORT CHARLOTTE, FL)
National Pollutant Discharge Elimination System NON-MAJOR (Tracking pollutant discharge elimination systems) - permit Organizations: ED LANEY (CONTACT/OWNER)
BLUE HERON PINES-OFF SITE FORC (29200 S. LOOP ROAD in PUNTA GORDA, FL)
National Pollutant Discharge Elimination System NON-MAJOR (Tracking pollutant discharge elimination systems) - permit Organizations: DONALD WALLACE (CONTACT/OWNER)
Alternative names: LANDOVER/NORTHCLIFFE INTERSECT
Housing units lacking complete plumbing facilities: 0.4% Housing units lacking complete kitchen facilities: 0.7%
93.8%Electricity
2.4%No fuel used
2.3%Utility gas
0.6%Solar energy
0.5%Bottled, tank, or LP gas
Population in 1990: 15,495. Population change in the 1990s: +3,866 (+24.9%).
Place of birth for U.S.-born residents:
This state: 4,220
Northeast: 8,295
Midwest: 7,001
South: 2,818
West: 909
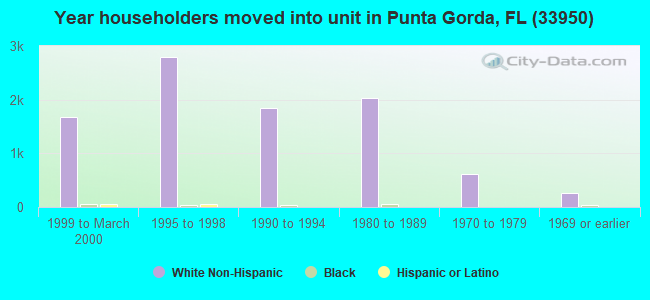
51% of the 33950 zip code residents lived in the same house 5 years ago. Out of people who lived in different houses, 29% lived in this county. Out of people who lived in different counties, 50% lived in Florida.
86% of the 33950 zip code residents lived in the same house 1 year ago. Out of people who lived in different houses, 30% moved from this county. Out of people who lived in different houses, 29% moved from different county within same state. Out of people who lived in different houses, 36% moved from different state. Out of people who lived in different houses, 9% moved from abroad.
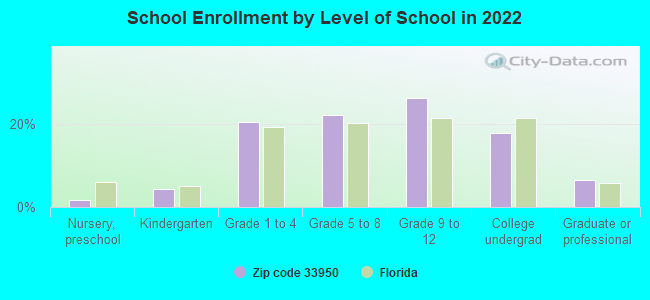
Private vs. public school enrollment:
Students in private schools in grades 1 to 8 (elementary and middle school): 182
Here:
15.3%
Florida:
15.8%
Students in private schools in grades 9 to 12 (high school): 67
Here:
9.2%
Florida:
12.9%
Students in private undergraduate colleges: 27
Here:
5.6%
Florida:
23.6%
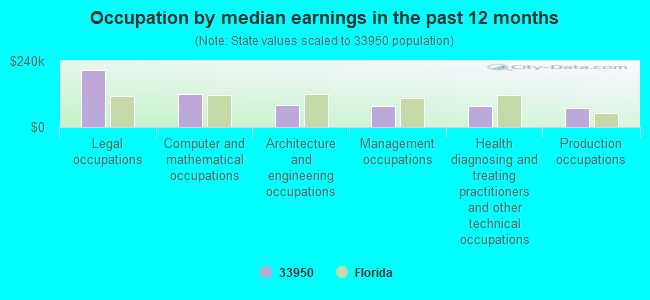
Occupation by median earnings in the past 12 months ($)
206,283Legal occupations
118,944Computer and mathematical occupations
78,367Architecture and engineering occupations
75,691Management occupations
74,861Health diagnosing and treating practitioners and other technical occupations
67,999Production occupations
Companies with federal contracts located in this zip code (PUNTA GORDA, FL):
BROOKFIELD HOMES INC (1298 MARKET CIR UNIT 1A1; small business) 5 employees, $2800000 revenue. : $250,000 in 5 contractsfrom 1999 to 2000
Contracts for Lease or Rental of Facilities -- Office Buildings by Public Buildings Service Signed by year:2000: $200,000; 2001: $0; 2002: $0; 2003: $0; 2004: $0; 2005: $0; 2006: $0.
Biggest contracts:
$50,000 with Public Buildings Service for Lease or Rental of Facilities -- Office Buildings. Signed on 2000-12-15. Completion date: 2000-12-15.
$50,000, same as above.Signed on 2000-03-15. Completion date: 2000-03-15.
$50,000, same as above.Signed on 2000-09-15. Completion date: 2000-09-15.
$50,000, same as above.Signed on 2000-06-15. Completion date: 2000-06-15.
LASER IMAGING SYSTEMS (204A EAST MCKENZIE; small business)
$38,000 with Air Force for Other Defense -- Management and Support (R&D). Signed on 2000-05-04. Completion date: 2000-12-31.
GERALD KEELE (PMB 153; small business) : $19,191 in 8 contractsfrom 2004 to 2006
Contracts for Other Management Support Services, Recreation Site Maintenance Services (non-construction) by Army, U.S. Army Corps of Engineers - civil program financing only Signed by year:2000: $0; 2001: $0; 2002: $0; 2003: $0; 2004: $12,996; 2005: $0; 2006: $6,195.
Biggest contracts:
$6,639 with Army for Other Management Support Services. Taking place in GA. Signed on 2005-02-10. Completion date: 2005-09-09.
$6,639 with U.S. Army Corps of Engineers - civil program financing only for Other Management Support Services. Taking place in GA. Signed on 2005-02-10. Completion date: 2005-09-09.
$6,498, same as above.Signed on 2004-02-11. Completion date: 2004-12-31.
$6,498 with Army for Other Management Support Services. Taking place in GA. Signed on 2004-02-11. Completion date: 2004-12-31.
MURPHY, PAUL F (3617 BONAIRE COURT; small business)
$14,620 with U.S. Army Corps of Engineers - civil program financing only for Other Education and Training Services. Taking place in ID. Signed on 2003-05-12. Completion date: 2003-05-22.
METAL-TECH CONTROLS CORP (3441 ST CROIX CT; small business)
$8,275 with Air Force for Hydraulic and Pneumatic Presses, Power Driven. Signed on 2006-06-21. Completion date: 2006-07-21.
Top industries in this zip code by the number of employees in 2005:
Health Care and Social Assistance: General Medical and Surgical Hospitals (500-999 employees: 1 establishment)
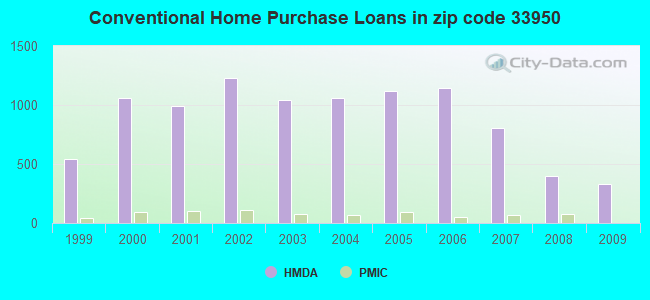
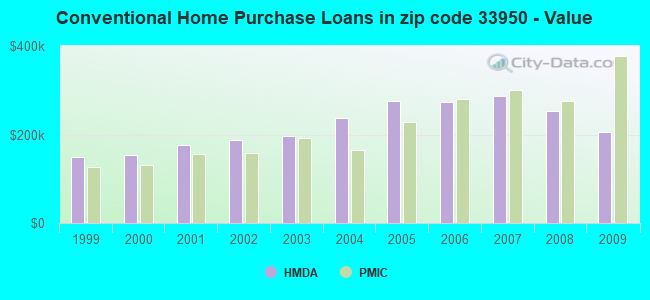
Detailed PMIC statistics for the following Tracts:0103.00
, 0104.00
2002 - 2018 National Fire Incident Reporting System (NFIRS) incidents
According to the data from the years 2002 - 2018 the average number of fire incidents per year is 97. The highest number of fires - 155 took place in 2004, and the least - 51 in 2010. The data has a dropping trend.
When looking into fire subcategories, the most incidents belonged to: Outside Fires (59.9%), and Structure Fires (20.2%).
Fire incident types reported to NFIRS in Zip Code 33950


 Nearest zip codes: 33980, 33952, 33955, 33983, 33948, 33954.


 According to the data from the years 2002 - 2018 the average number of fire incidents per year is 97. The highest number of fires - 155 took place in 2004, and the least - 51 in 2010. The data has a dropping trend.
 When looking into fire subcategories, the most incidents belonged to: Outside Fires (59.9%), and Structure Fires (20.2%).