Estimated zip code population in 2022: 10,690
Zip code population in 2010: 10,060
Zip code population in 2000: 6,227
Houses and condos: 6,983
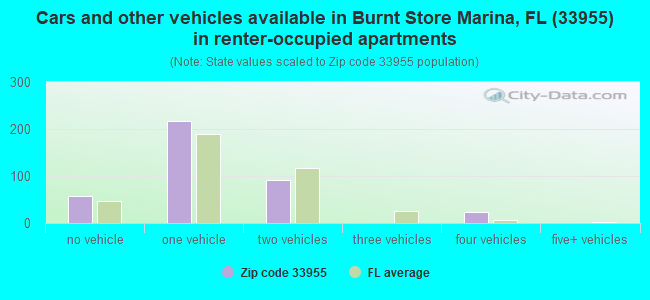
Renter-occupied apartments: 388
% of renters here:
7%State:
33%
March 2022 cost of living index in zip code 33955: 91.8
(less than average, U.S. average is 100)
Land area: 54.0
sq. mi.
Water area: 2.0
sq. mi.
Population density: 198 people per square mile (very low).
OSM Map
General Map
Google Map
MSN Map
OSM Map
General Map
Google Map
MSN Map
OSM Map
General Map
Google Map
MSN Map
OSM Map
General Map
Google Map
MSN Map
Please wait while loading the map...
Real estate property taxes paid for housing units in 2022:
This zip code:
0.7% ($2,574)Florida:
0.7% ($2,529)
Median real estate property taxes paid for housing units with mortgages in 2022: $2,729 (0.7%)
Median real estate property taxes paid for housing units with no mortgage in 2022: $2,456 (0.7%)
Profiles of local businesses
Business Search - 14 Million verified businesses
Males: 5,574 Females: 5,116
For population 25 years and over in 33955:
High school or higher: 88.3%Bachelor's degree or higher: 31.1%Graduate or professional degree: 11.8%Unemployed: 2.5%Mean travel time to work (commute): 24.0 minutes
For population 15 years and over in 33955:
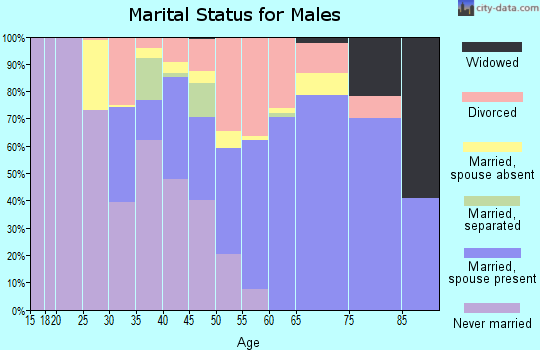
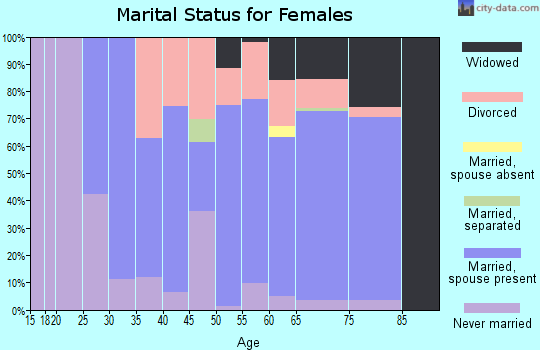
Never married: 15.1%Now married: 67.1%Separated: 0.6%Widowed: 6.8%Divorced: 10.4%
Zip code 33955 compared to state average:
Black race population percentage significantly below state average. Hispanic race population percentage below state average. Median age significantly above state average. Foreign-born population percentage significantly below state average. Renting percentage significantly below state average. Length of stay since moving in significantly above state average. House age below state average. Number of college students below state average. 9,087 85.0% White 1,176 11.0% Hispanic or Latino 197 1.8% Two or more races 170 1.6% Black 40 0.4% Asian 18 0.2% American Indian
Data:
Median household income ($)
Median household income (% change since 2000)
Household income diversity
Ratio of average income to average house value (%)
Ratio of average income to average rent
Median household income ($) - White
Median household income ($) - Black or African American
Median household income ($) - Asian
Median household income ($) - Hispanic or Latino
Median household income ($) - American Indian and Alaska Native
Median household income ($) - Multirace
Median household income ($) - Other Race
Median household income for houses/condos with a mortgage ($)
Median household income for apartments without a mortgage ($)
Races - White alone (%)
Races - White alone (% change since 2000)
Races - Black alone (%)
Races - Black alone (% change since 2000)
Races - American Indian alone (%)
Races - American Indian alone (% change since 2000)
Races - Asian alone (%)
Races - Asian alone (% change since 2000)
Races - Hispanic (%)
Races - Hispanic (% change since 2000)
Races - Native Hawaiian and Other Pacific Islander alone (%)
Races - Native Hawaiian and Other Pacific Islander alone (% change since 2000)
Races - Two or more races (%)
Races - Two or more races (% change since 2000)
Races - Other race alone (%)
Races - Other race alone (% change since 2000)
Racial diversity
Unemployment (%)
Unemployment (% change since 2000)
Unemployment (%) - White
Unemployment (%) - Black or African American
Unemployment (%) - Asian
Unemployment (%) - Hispanic or Latino
Unemployment (%) - American Indian and Alaska Native
Unemployment (%) - Multirace
Unemployment (%) - Other Race
Population density (people per square mile)
Population - Males (%)
Population - Females (%)
Population - Males (%) - White
Population - Males (%) - Black or African American
Population - Males (%) - Asian
Population - Males (%) - Hispanic or Latino
Population - Males (%) - American Indian and Alaska Native
Population - Males (%) - Multirace
Population - Males (%) - Other Race
Population - Females (%) - White
Population - Females (%) - Black or African American
Population - Females (%) - Asian
Population - Females (%) - Hispanic or Latino
Population - Females (%) - American Indian and Alaska Native
Population - Females (%) - Multirace
Population - Females (%) - Other Race
Coronavirus confirmed cases (Apr 27, 2024)
Deaths caused by coronavirus (Apr 27, 2024)
Coronavirus confirmed cases (per 100k population) (Apr 27, 2024)
Deaths caused by coronavirus (per 100k population) (Apr 27, 2024)
Daily increase in number of cases (Apr 27, 2024)
Weekly increase in number of cases (Apr 27, 2024)
Cases doubled (in days) (Apr 27, 2024)
Hospitalized patients (Apr 18, 2022)
Negative test results (Apr 18, 2022)
Total test results (Apr 18, 2022)
COVID Vaccine doses distributed (per 100k population) (Sep 19, 2023)
COVID Vaccine doses administered (per 100k population) (Sep 19, 2023)
COVID Vaccine doses distributed (Sep 19, 2023)
COVID Vaccine doses administered (Sep 19, 2023)
Likely homosexual households (%)
Likely homosexual households (% change since 2000)
Likely homosexual households - Lesbian couples (%)
Likely homosexual households - Lesbian couples (% change since 2000)
Likely homosexual households - Gay men (%)
Likely homosexual households - Gay men (% change since 2000)
Cost of living index
Median gross rent ($)
Median contract rent ($)
Median monthly housing costs ($)
Median house or condo value ($)
Median house or condo value ($ change since 2000)
Mean house or condo value by units in structure - 1, detached ($)
Mean house or condo value by units in structure - 1, attached ($)
Mean house or condo value by units in structure - 2 ($)
Mean house or condo value by units in structure by units in structure - 3 or 4 ($)
Mean house or condo value by units in structure - 5 or more ($)
Mean house or condo value by units in structure - Boat, RV, van, etc. ($)
Mean house or condo value by units in structure - Mobile home ($)
Median house or condo value ($) - White
Median house or condo value ($) - Black or African American
Median house or condo value ($) - Asian
Median house or condo value ($) - Hispanic or Latino
Median house or condo value ($) - American Indian and Alaska Native
Median house or condo value ($) - Multirace
Median house or condo value ($) - Other Race
Median resident age
Resident age diversity
Median resident age - Males
Median resident age - Females
Median resident age - White
Median resident age - Black or African American
Median resident age - Asian
Median resident age - Hispanic or Latino
Median resident age - American Indian and Alaska Native
Median resident age - Multirace
Median resident age - Other Race
Median resident age - Males - White
Median resident age - Males - Black or African American
Median resident age - Males - Asian
Median resident age - Males - Hispanic or Latino
Median resident age - Males - American Indian and Alaska Native
Median resident age - Males - Multirace
Median resident age - Males - Other Race
Median resident age - Females - White
Median resident age - Females - Black or African American
Median resident age - Females - Asian
Median resident age - Females - Hispanic or Latino
Median resident age - Females - American Indian and Alaska Native
Median resident age - Females - Multirace
Median resident age - Females - Other Race
Commute - mean travel time to work (minutes)
Travel time to work - Less than 5 minutes (%)
Travel time to work - Less than 5 minutes (% change since 2000)
Travel time to work - 5 to 9 minutes (%)
Travel time to work - 5 to 9 minutes (% change since 2000)
Travel time to work - 10 to 19 minutes (%)
Travel time to work - 10 to 19 minutes (% change since 2000)
Travel time to work - 20 to 29 minutes (%)
Travel time to work - 20 to 29 minutes (% change since 2000)
Travel time to work - 30 to 39 minutes (%)
Travel time to work - 30 to 39 minutes (% change since 2000)
Travel time to work - 40 to 59 minutes (%)
Travel time to work - 40 to 59 minutes (% change since 2000)
Travel time to work - 60 to 89 minutes (%)
Travel time to work - 60 to 89 minutes (% change since 2000)
Travel time to work - 90 or more minutes (%)
Travel time to work - 90 or more minutes (% change since 2000)
Marital status - Never married (%)
Marital status - Now married (%)
Marital status - Separated (%)
Marital status - Widowed (%)
Marital status - Divorced (%)
Median family income ($)
Median family income (% change since 2000)
Median non-family income ($)
Median non-family income (% change since 2000)
Median per capita income ($)
Median per capita income (% change since 2000)
Median family income ($) - White
Median family income ($) - Black or African American
Median family income ($) - Asian
Median family income ($) - Hispanic or Latino
Median family income ($) - American Indian and Alaska Native
Median family income ($) - Multirace
Median family income ($) - Other Race
Median year house/condo built
Median year apartment built
Year house built - Built 2005 or later (%)
Year house built - Built 2000 to 2004 (%)
Year house built - Built 1990 to 1999 (%)
Year house built - Built 1980 to 1989 (%)
Year house built - Built 1970 to 1979 (%)
Year house built - Built 1960 to 1969 (%)
Year house built - Built 1950 to 1959 (%)
Year house built - Built 1940 to 1949 (%)
Year house built - Built 1939 or earlier (%)
Average household size
Household density (households per square mile)
Average household size - White
Average household size - Black or African American
Average household size - Asian
Average household size - Hispanic or Latino
Average household size - American Indian and Alaska Native
Average household size - Multirace
Average household size - Other Race
Occupied housing units (%)
Vacant housing units (%)
Owner occupied housing units (%)
Renter occupied housing units (%)
Vacancy status - For rent (%)
Vacancy status - For sale only (%)
Vacancy status - Rented or sold, not occupied (%)
Vacancy status - For seasonal, recreational, or occasional use (%)
Vacancy status - For migrant workers (%)
Vacancy status - Other vacant (%)
Residents with income below the poverty level (%)
Residents with income below 50% of the poverty level (%)
Children below poverty level (%)
Poor families by family type - Married-couple family (%)
Poor families by family type - Male, no wife present (%)
Poor families by family type - Female, no husband present (%)
Poverty status for native-born residents (%)
Poverty status for foreign-born residents (%)
Poverty among high school graduates not in families (%)
Poverty among people who did not graduate high school not in families (%)
Residents with income below the poverty level (%) - White
Residents with income below the poverty level (%) - Black or African American
Residents with income below the poverty level (%) - Asian
Residents with income below the poverty level (%) - Hispanic or Latino
Residents with income below the poverty level (%) - American Indian and Alaska Native
Residents with income below the poverty level (%) - Multirace
Residents with income below the poverty level (%) - Other Race
Air pollution - Air Quality Index (AQI)
Air pollution - CO
Air pollution - NO2
Air pollution - SO2
Air pollution - Ozone
Air pollution - PM10
Air pollution - PM25
Air pollution - Pb
Crime - Murders per 100,000 population
Crime - Rapes per 100,000 population
Crime - Robberies per 100,000 population
Crime - Assaults per 100,000 population
Crime - Burglaries per 100,000 population
Crime - Thefts per 100,000 population
Crime - Auto thefts per 100,000 population
Crime - Arson per 100,000 population
Crime - City-data.com crime index
Crime - Violent crime index
Crime - Property crime index
Crime - Murders per 100,000 population (5 year average)
Crime - Rapes per 100,000 population (5 year average)
Crime - Robberies per 100,000 population (5 year average)
Crime - Assaults per 100,000 population (5 year average)
Crime - Burglaries per 100,000 population (5 year average)
Crime - Thefts per 100,000 population (5 year average)
Crime - Auto thefts per 100,000 population (5 year average)
Crime - Arson per 100,000 population (5 year average)
Crime - City-data.com crime index (5 year average)
Crime - Violent crime index (5 year average)
Crime - Property crime index (5 year average)
1996 Presidential Elections Results (%) - Democratic Party (Clinton)
1996 Presidential Elections Results (%) - Republican Party (Dole)
1996 Presidential Elections Results (%) - Other
2000 Presidential Elections Results (%) - Democratic Party (Gore)
2000 Presidential Elections Results (%) - Republican Party (Bush)
2000 Presidential Elections Results (%) - Other
2004 Presidential Elections Results (%) - Democratic Party (Kerry)
2004 Presidential Elections Results (%) - Republican Party (Bush)
2004 Presidential Elections Results (%) - Other
2008 Presidential Elections Results (%) - Democratic Party (Obama)
2008 Presidential Elections Results (%) - Republican Party (McCain)
2008 Presidential Elections Results (%) - Other
2012 Presidential Elections Results (%) - Democratic Party (Obama)
2012 Presidential Elections Results (%) - Republican Party (Romney)
2012 Presidential Elections Results (%) - Other
2016 Presidential Elections Results (%) - Democratic Party (Clinton)
2016 Presidential Elections Results (%) - Republican Party (Trump)
2016 Presidential Elections Results (%) - Other
2020 Presidential Elections Results (%) - Democratic Party (Biden)
2020 Presidential Elections Results (%) - Republican Party (Trump)
2020 Presidential Elections Results (%) - Other
Ancestries Reported - Arab (%)
Ancestries Reported - Czech (%)
Ancestries Reported - Danish (%)
Ancestries Reported - Dutch (%)
Ancestries Reported - English (%)
Ancestries Reported - French (%)
Ancestries Reported - French Canadian (%)
Ancestries Reported - German (%)
Ancestries Reported - Greek (%)
Ancestries Reported - Hungarian (%)
Ancestries Reported - Irish (%)
Ancestries Reported - Italian (%)
Ancestries Reported - Lithuanian (%)
Ancestries Reported - Norwegian (%)
Ancestries Reported - Polish (%)
Ancestries Reported - Portuguese (%)
Ancestries Reported - Russian (%)
Ancestries Reported - Scotch-Irish (%)
Ancestries Reported - Scottish (%)
Ancestries Reported - Slovak (%)
Ancestries Reported - Subsaharan African (%)
Ancestries Reported - Swedish (%)
Ancestries Reported - Swiss (%)
Ancestries Reported - Ukrainian (%)
Ancestries Reported - United States (%)
Ancestries Reported - Welsh (%)
Ancestries Reported - West Indian (%)
Ancestries Reported - Other (%)
Educational Attainment - No schooling completed (%)
Educational Attainment - Less than high school (%)
Educational Attainment - High school or equivalent (%)
Educational Attainment - Less than 1 year of college (%)
Educational Attainment - 1 or more years of college (%)
Educational Attainment - Associate degree (%)
Educational Attainment - Bachelor's degree (%)
Educational Attainment - Master's degree (%)
Educational Attainment - Professional school degree (%)
Educational Attainment - Doctorate degree (%)
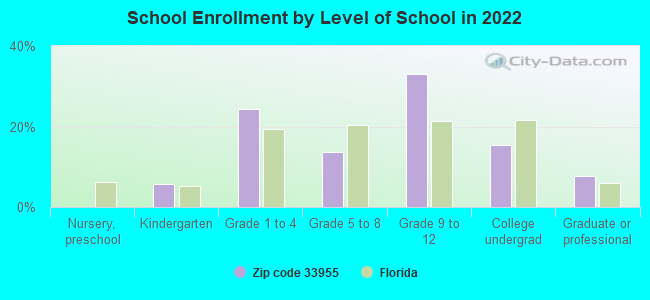
School Enrollment - Nursery, preschool (%)
School Enrollment - Kindergarten (%)
School Enrollment - Grade 1 to 4 (%)
School Enrollment - Grade 5 to 8 (%)
School Enrollment - Grade 9 to 12 (%)
School Enrollment - College undergrad (%)
School Enrollment - Graduate or professional (%)
School Enrollment - Not enrolled in school (%)
School enrollment - Public schools (%)
School enrollment - Private schools (%)
School enrollment - Not enrolled (%)
Median number of rooms in houses and condos
Median number of rooms in apartments
Housing units lacking complete plumbing facilities (%)
Housing units lacking complete kitchen facilities (%)
Density of houses
Urban houses (%)
Rural houses (%)
Households with people 60 years and over (%)
Households with people 65 years and over (%)
Households with people 75 years and over (%)
Households with one or more nonrelatives (%)
Households with no nonrelatives (%)
Population in households (%)
Family households (%)
Nonfamily households (%)
Population in families (%)
Family households with own children (%)
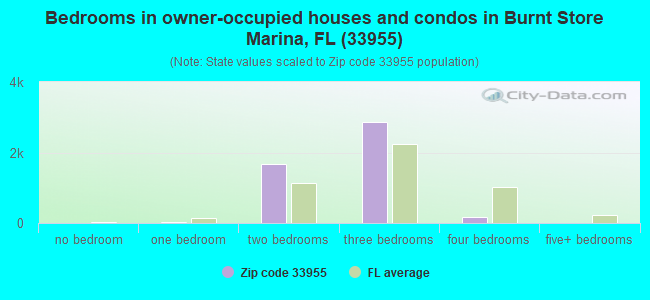
Median number of bedrooms in owner occupied houses
Mean number of bedrooms in owner occupied houses
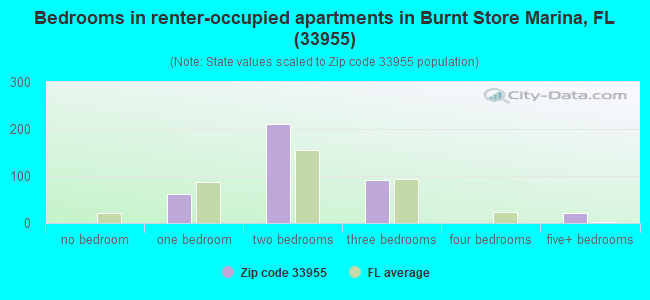
Median number of bedrooms in renter occupied houses
Mean number of bedrooms in renter occupied houses
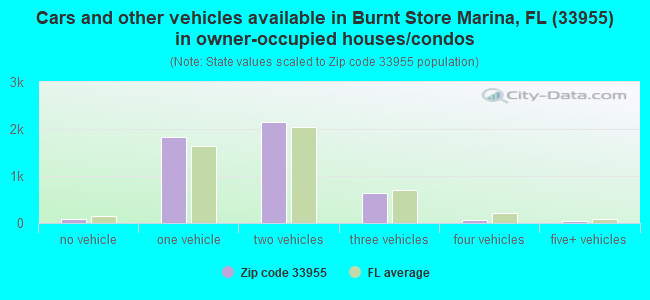
Median number of vehichles in owner occupied houses
Mean number of vehichles in owner occupied houses
Median number of vehichles in renter occupied houses
Mean number of vehichles in renter occupied houses
Mortgage status - with mortgage (%)
Mortgage status - with second mortgage (%)
Mortgage status - with home equity loan (%)
Mortgage status - with both second mortgage and home equity loan (%)
Mortgage status - without a mortgage (%)
Average family size
Average family size - White
Average family size - Black or African American
Average family size - Asian
Average family size - Hispanic or Latino
Average family size - American Indian and Alaska Native
Average family size - Multirace
Average family size - Other Race
Geographical mobility - Same house 1 year ago (%)
Geographical mobility - Moved within same county (%)
Geographical mobility - Moved from different county within same state (%)
Geographical mobility - Moved from different state (%)
Geographical mobility - Moved from abroad (%)
Place of birth - Born in state of residence (%)
Place of birth - Born in other state (%)
Place of birth - Native, outside of US (%)
Place of birth - Foreign born (%)
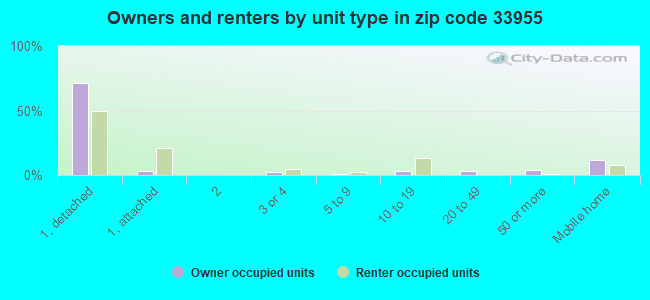
Housing units in structures - 1, detached (%)
Housing units in structures - 1, attached (%)
Housing units in structures - 2 (%)
Housing units in structures - 3 or 4 (%)
Housing units in structures - 5 to 9 (%)
Housing units in structures - 10 to 19 (%)
Housing units in structures - 20 to 49 (%)
Housing units in structures - 50 or more (%)
Housing units in structures - Mobile home (%)
Housing units in structures - Boat, RV, van, etc. (%)
House/condo owner moved in on average (years ago)
Renter moved in on average (years ago)
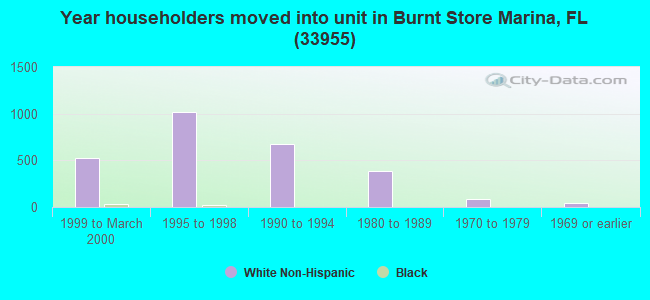
Year householder moved into unit - Moved in 1999 to March 2000 (%)
Year householder moved into unit - Moved in 1995 to 1998 (%)
Year householder moved into unit - Moved in 1990 to 1994 (%)
Year householder moved into unit - Moved in 1980 to 1989 (%)
Year householder moved into unit - Moved in 1970 to 1979 (%)
Year householder moved into unit - Moved in 1969 or earlier (%)
Means of transportation to work - Drove car alone (%)
Means of transportation to work - Carpooled (%)
Means of transportation to work - Public transportation (%)
Means of transportation to work - Bus or trolley bus (%)
Means of transportation to work - Streetcar or trolley car (%)
Means of transportation to work - Subway or elevated (%)
Means of transportation to work - Railroad (%)
Means of transportation to work - Ferryboat (%)
Means of transportation to work - Taxicab (%)
Means of transportation to work - Motorcycle (%)
Means of transportation to work - Bicycle (%)
Means of transportation to work - Walked (%)
Means of transportation to work - Other means (%)
Working at home (%)
Industry diversity
Most Common Industries - Agriculture, forestry, fishing and hunting, and mining (%)
Most Common Industries - Agriculture, forestry, fishing and hunting (%)
Most Common Industries - Mining, quarrying, and oil and gas extraction (%)
Most Common Industries - Construction (%)
Most Common Industries - Manufacturing (%)
Most Common Industries - Wholesale trade (%)
Most Common Industries - Retail trade (%)
Most Common Industries - Transportation and warehousing, and utilities (%)
Most Common Industries - Transportation and warehousing (%)
Most Common Industries - Utilities (%)
Most Common Industries - Information (%)
Most Common Industries - Finance and insurance, and real estate and rental and leasing (%)
Most Common Industries - Finance and insurance (%)
Most Common Industries - Real estate and rental and leasing (%)
Most Common Industries - Professional, scientific, and management, and administrative and waste management services (%)
Most Common Industries - Professional, scientific, and technical services (%)
Most Common Industries - Management of companies and enterprises (%)
Most Common Industries - Administrative and support and waste management services (%)
Most Common Industries - Educational services, and health care and social assistance (%)
Most Common Industries - Educational services (%)
Most Common Industries - Health care and social assistance (%)
Most Common Industries - Arts, entertainment, and recreation, and accommodation and food services (%)
Most Common Industries - Arts, entertainment, and recreation (%)
Most Common Industries - Accommodation and food services (%)
Most Common Industries - Other services, except public administration (%)
Most Common Industries - Public administration (%)
Occupation diversity
Most Common Occupations - Management, business, science, and arts occupations (%)
Most Common Occupations - Management, business, and financial occupations (%)
Most Common Occupations - Management occupations (%)
Most Common Occupations - Business and financial operations occupations (%)
Most Common Occupations - Computer, engineering, and science occupations (%)
Most Common Occupations - Computer and mathematical occupations (%)
Most Common Occupations - Architecture and engineering occupations (%)
Most Common Occupations - Life, physical, and social science occupations (%)
Most Common Occupations - Education, legal, community service, arts, and media occupations (%)
Most Common Occupations - Community and social service occupations (%)
Most Common Occupations - Legal occupations (%)
Most Common Occupations - Education, training, and library occupations (%)
Most Common Occupations - Arts, design, entertainment, sports, and media occupations (%)
Most Common Occupations - Healthcare practitioners and technical occupations (%)
Most Common Occupations - Health diagnosing and treating practitioners and other technical occupations (%)
Most Common Occupations - Health technologists and technicians (%)
Most Common Occupations - Service occupations (%)
Most Common Occupations - Healthcare support occupations (%)
Most Common Occupations - Protective service occupations (%)
Most Common Occupations - Fire fighting and prevention, and other protective service workers including supervisors (%)
Most Common Occupations - Law enforcement workers including supervisors (%)
Most Common Occupations - Food preparation and serving related occupations (%)
Most Common Occupations - Building and grounds cleaning and maintenance occupations (%)
Most Common Occupations - Personal care and service occupations (%)
Most Common Occupations - Sales and office occupations (%)
Most Common Occupations - Sales and related occupations (%)
Most Common Occupations - Office and administrative support occupations (%)
Most Common Occupations - Natural resources, construction, and maintenance occupations (%)
Most Common Occupations - Farming, fishing, and forestry occupations (%)
Most Common Occupations - Construction and extraction occupations (%)
Most Common Occupations - Installation, maintenance, and repair occupations (%)
Most Common Occupations - Production, transportation, and material moving occupations (%)
Most Common Occupations - Production occupations (%)
Most Common Occupations - Transportation occupations (%)
Most Common Occupations - Material moving occupations (%)
People in Group quarters - Institutionalized population (%)
People in Group quarters - Correctional institutions (%)
People in Group quarters - Federal prisons and detention centers (%)
People in Group quarters - Halfway houses (%)
People in Group quarters - Local jails and other confinement facilities (including police lockups) (%)
People in Group quarters - Military disciplinary barracks (%)
People in Group quarters - State prisons (%)
People in Group quarters - Other types of correctional institutions (%)
People in Group quarters - Nursing homes (%)
People in Group quarters - Hospitals/wards, hospices, and schools for the handicapped (%)
People in Group quarters - Hospitals/wards and hospices for chronically ill (%)
People in Group quarters - Hospices or homes for chronically ill (%)
People in Group quarters - Military hospitals or wards for chronically ill (%)
People in Group quarters - Other hospitals or wards for chronically ill (%)
People in Group quarters - Hospitals or wards for drug/alcohol abuse (%)
People in Group quarters - Mental (Psychiatric) hospitals or wards (%)
People in Group quarters - Schools, hospitals, or wards for the mentally retarded (%)
People in Group quarters - Schools, hospitals, or wards for the physically handicapped (%)
People in Group quarters - Institutions for the deaf (%)
People in Group quarters - Institutions for the blind (%)
People in Group quarters - Orthopedic wards and institutions for the physically handicapped (%)
People in Group quarters - Wards in general hospitals for patients who have no usual home elsewhere (%)
People in Group quarters - Wards in military hospitals for patients who have no usual home elsewhere (%)
People in Group quarters - Juvenile institutions (%)
People in Group quarters - Long-term care (%)
People in Group quarters - Homes for abused, dependent, and neglected children (%)
People in Group quarters - Residential treatment centers for emotionally disturbed children (%)
People in Group quarters - Training schools for juvenile delinquents (%)
People in Group quarters - Short-term care, detention or diagnostic centers for delinquent children (%)
People in Group quarters - Type of juvenile institution unknown (%)
People in Group quarters - Noninstitutionalized population (%)
People in Group quarters - College dormitories (includes college quarters off campus) (%)
People in Group quarters - Military quarters (%)
People in Group quarters - On base (%)
People in Group quarters - Barracks, unaccompanied personnel housing (UPH), (Enlisted/Officer), ;and similar group living quarters for military personnel (%)
People in Group quarters - Transient quarters for temporary residents (%)
People in Group quarters - Military ships (%)
People in Group quarters - Group homes (%)
People in Group quarters - Homes or halfway houses for drug/alcohol abuse (%)
People in Group quarters - Homes for the mentally ill (%)
People in Group quarters - Homes for the mentally retarded (%)
People in Group quarters - Homes for the physically handicapped (%)
People in Group quarters - Other group homes (%)
People in Group quarters - Religious group quarters (%)
People in Group quarters - Dormitories (%)
People in Group quarters - Agriculture workers' dormitories on farms (%)
People in Group quarters - Job Corps and vocational training facilities (%)
People in Group quarters - Other workers' dormitories (%)
People in Group quarters - Crews of maritime vessels (%)
People in Group quarters - Other nonhousehold living situations (%)
People in Group quarters - Other noninstitutional group quarters (%)
Residents speaking English at home (%)
Residents speaking English at home - Born in the United States (%)
Residents speaking English at home - Native, born elsewhere (%)
Residents speaking English at home - Foreign born (%)
Residents speaking Spanish at home (%)
Residents speaking Spanish at home - Born in the United States (%)
Residents speaking Spanish at home - Native, born elsewhere (%)
Residents speaking Spanish at home - Foreign born (%)
Residents speaking other language at home (%)
Residents speaking other language at home - Born in the United States (%)
Residents speaking other language at home - Native, born elsewhere (%)
Residents speaking other language at home - Foreign born (%)
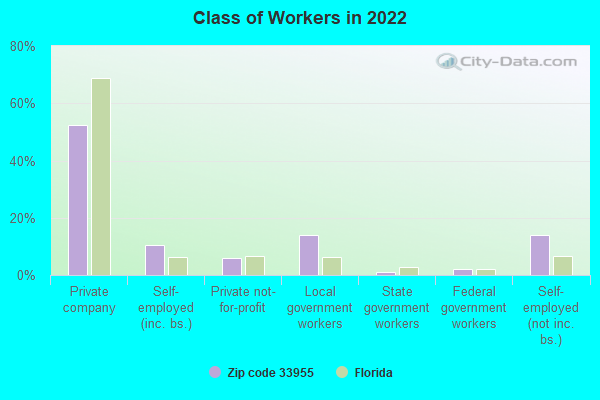
Class of Workers - Employee of private company (%)
Class of Workers - Self-employed in own incorporated business (%)
Class of Workers - Private not-for-profit wage and salary workers (%)
Class of Workers - Local government workers (%)
Class of Workers - State government workers (%)
Class of Workers - Federal government workers (%)
Class of Workers - Self-employed workers in own not incorporated business and Unpaid family workers (%)
House heating fuel used in houses and condos - Utility gas (%)
House heating fuel used in houses and condos - Bottled, tank, or LP gas (%)
House heating fuel used in houses and condos - Electricity (%)
House heating fuel used in houses and condos - Fuel oil, kerosene, etc. (%)
House heating fuel used in houses and condos - Coal or coke (%)
House heating fuel used in houses and condos - Wood (%)
House heating fuel used in houses and condos - Solar energy (%)
House heating fuel used in houses and condos - Other fuel (%)
House heating fuel used in houses and condos - No fuel used (%)
House heating fuel used in apartments - Utility gas (%)
House heating fuel used in apartments - Bottled, tank, or LP gas (%)
House heating fuel used in apartments - Electricity (%)
House heating fuel used in apartments - Fuel oil, kerosene, etc. (%)
House heating fuel used in apartments - Coal or coke (%)
House heating fuel used in apartments - Wood (%)
House heating fuel used in apartments - Solar energy (%)
House heating fuel used in apartments - Other fuel (%)
House heating fuel used in apartments - No fuel used (%)
Armed forces status - In Armed Forces (%)
Armed forces status - Civilian (%)
Armed forces status - Civilian - Veteran (%)
Armed forces status - Civilian - Nonveteran (%)
Fatal accidents locations in years 2005-2021
Fatal accidents locations in 2005
Fatal accidents locations in 2006
Fatal accidents locations in 2007
Fatal accidents locations in 2008
Fatal accidents locations in 2009
Fatal accidents locations in 2010
Fatal accidents locations in 2011
Fatal accidents locations in 2012
Fatal accidents locations in 2013
Fatal accidents locations in 2014
Fatal accidents locations in 2015
Fatal accidents locations in 2016
Fatal accidents locations in 2017
Fatal accidents locations in 2018
Fatal accidents locations in 2019
Fatal accidents locations in 2020
Fatal accidents locations in 2021
Alcohol use - People drinking some alcohol every month (%)
Alcohol use - People not drinking at all (%)
Alcohol use - Average days/month drinking alcohol
Alcohol use - Average drinks/week
Alcohol use - Average days/year people drink much
Audiometry - Average condition of hearing (%)
Audiometry - People that can hear a whisper from across a quiet room (%)
Audiometry - People that can hear normal voice from across a quiet room (%)
Audiometry - Ears ringing, roaring, buzzing (%)
Audiometry - Had a job exposure to loud noise (%)
Audiometry - Had off-work exposure to loud noise (%)
Blood Pressure & Cholesterol - Has high blood pressure (%)
Blood Pressure & Cholesterol - Checking blood pressure at home (%)
Blood Pressure & Cholesterol - Frequently checking blood cholesterol (%)
Blood Pressure & Cholesterol - Has high cholesterol level (%)
Consumer Behavior - Money monthly spent on food at supermarket/grocery store
Consumer Behavior - Money monthly spent on food at other stores
Consumer Behavior - Money monthly spent on eating out
Consumer Behavior - Money monthly spent on carryout/delivered foods
Consumer Behavior - Income spent on food at supermarket/grocery store (%)
Consumer Behavior - Income spent on food at other stores (%)
Consumer Behavior - Income spent on eating out (%)
Consumer Behavior - Income spent on carryout/delivered foods (%)
Current Health Status - General health condition (%)
Current Health Status - Blood donors (%)
Current Health Status - Has blood ever tested for HIV virus (%)
Current Health Status - Left-handed people (%)
Dermatology - People using sunscreen (%)
Diabetes - Diabetics (%)
Diabetes - Had a blood test for high blood sugar (%)
Diabetes - People taking insulin (%)
Diet Behavior & Nutrition - Diet health (%)
Diet Behavior & Nutrition - Milk product consumption (# of products/month)
Diet Behavior & Nutrition - Meals not home prepared (#/week)
Diet Behavior & Nutrition - Meals from fast food or pizza place (#/week)
Diet Behavior & Nutrition - Ready-to-eat foods (#/month)
Diet Behavior & Nutrition - Frozen meals/pizza (#/month)
Drug Use - People that ever used marijuana or hashish (%)
Drug Use - Ever used hard drugs (%)
Drug Use - Ever used any form of cocaine (%)
Drug Use - Ever used heroin (%)
Drug Use - Ever used methamphetamine (%)
Health Insurance - People covered by health insurance (%)
Kidney Conditions-Urology - Avg. # of times urinating at night
Medical Conditions - People with asthma (%)
Medical Conditions - People with anemia (%)
Medical Conditions - People with psoriasis (%)
Medical Conditions - People with overweight (%)
Medical Conditions - Elderly people having difficulties in thinking or remembering (%)
Medical Conditions - People who ever received blood transfusion (%)
Medical Conditions - People having trouble seeing even with glass/contacts (%)
Medical Conditions - People with arthritis (%)
Medical Conditions - People with gout (%)
Medical Conditions - People with congestive heart failure (%)
Medical Conditions - People with coronary heart disease (%)
Medical Conditions - People with angina pectoris (%)
Medical Conditions - People who ever had heart attack (%)
Medical Conditions - People who ever had stroke (%)
Medical Conditions - People with emphysema (%)
Medical Conditions - People with thyroid problem (%)
Medical Conditions - People with chronic bronchitis (%)
Medical Conditions - People with any liver condition (%)
Medical Conditions - People who ever had cancer or malignancy (%)
Mental Health - People who have little interest in doing things (%)
Mental Health - People feeling down, depressed, or hopeless (%)
Mental Health - People who have trouble sleeping or sleeping too much (%)
Mental Health - People feeling tired or having little energy (%)
Mental Health - People with poor appetite or overeating (%)
Mental Health - People feeling bad about themself (%)
Mental Health - People who have trouble concentrating on things (%)
Mental Health - People moving or speaking slowly or too fast (%)
Mental Health - People having thoughts they would be better off dead (%)
Oral Health - Average years since last visit a dentist
Oral Health - People embarrassed because of mouth (%)
Oral Health - People with gum disease (%)
Oral Health - General health of teeth and gums (%)
Oral Health - Average days a week using dental floss/device
Oral Health - Average days a week using mouthwash for dental problem
Oral Health - Average number of teeth
Pesticide Use - Households using pesticides to control insects (%)
Pesticide Use - Households using pesticides to kill weeds (%)
Physical Activity - People doing vigorous-intensity work activities (%)
Physical Activity - People doing moderate-intensity work activities (%)
Physical Activity - People walking or bicycling (%)
Physical Activity - People doing vigorous-intensity recreational activities (%)
Physical Activity - People doing moderate-intensity recreational activities (%)
Physical Activity - Average hours a day doing sedentary activities
Physical Activity - Average hours a day watching TV or videos
Physical Activity - Average hours a day using computer
Physical Functioning - People having limitations keeping them from working (%)
Physical Functioning - People limited in amount of work they can do (%)
Physical Functioning - People that need special equipment to walk (%)
Physical Functioning - People experiencing confusion/memory problems (%)
Physical Functioning - People requiring special healthcare equipment (%)
Prescription Medications - Average number of prescription medicines taking
Preventive Aspirin Use - Adults 40+ taking low-dose aspirin (%)
Reproductive Health - Vaginal deliveries (%)
Reproductive Health - Cesarean deliveries (%)
Reproductive Health - Deliveries resulted in a live birth (%)
Reproductive Health - Pregnancies resulted in a delivery (%)
Reproductive Health - Women breastfeeding newborns (%)
Reproductive Health - Women that had a hysterectomy (%)
Reproductive Health - Women that had both ovaries removed (%)
Reproductive Health - Women that have ever taken birth control pills (%)
Reproductive Health - Women taking birth control pills (%)
Reproductive Health - Women that have ever used Depo-Provera or injectables (%)
Reproductive Health - Women that have ever used female hormones (%)
Sexual Behavior - People 18+ that ever had sex (vaginal, anal, or oral) (%)
Sexual Behavior - Males 18+ that ever had vaginal sex with a woman (%)
Sexual Behavior - Males 18+ that ever performed oral sex on a woman (%)
Sexual Behavior - Males 18+ that ever had anal sex with a woman (%)
Sexual Behavior - Males 18+ that ever had any sex with a man (%)
Sexual Behavior - Females 18+ that ever had vaginal sex with a man (%)
Sexual Behavior - Females 18+ that ever performed oral sex on a man (%)
Sexual Behavior - Females 18+ that ever had anal sex with a man (%)
Sexual Behavior - Females 18+ that ever had any kind of sex with a woman (%)
Sexual Behavior - Average age people first had sex
Sexual Behavior - Average number of female sex partners in lifetime (males 18+)
Sexual Behavior - Average number of female vaginal sex partners in lifetime (males 18+)
Sexual Behavior - Average age people first performed oral sex on a woman (18+)
Sexual Behavior - Average number of woman performed oral sex on in lifetime (18+)
Sexual Behavior - Average number of male sex partners in lifetime (males 18+)
Sexual Behavior - Average number of male anal sex partners in lifetime (males 18+)
Sexual Behavior - Average age people first performed oral sex on a man (18+)
Sexual Behavior - Average number of male oral sex partners in lifetime (18+)
Sexual Behavior - People using protection when performing oral sex (%)
Sexual Behavior - Average number of times people have vaginal or anal sex a year
Sexual Behavior - People having sex without condom (%)
Sexual Behavior - Average number of male sex partners in lifetime (females 18+)
Sexual Behavior - Average number of male vaginal sex partners in lifetime (females 18+)
Sexual Behavior - Average number of female sex partners in lifetime (females 18+)
Sexual Behavior - Circumcised males 18+ (%)
Sleep Disorders - Average hours sleeping at night
Sleep Disorders - People that has trouble sleeping (%)
Smoking-Cigarette Use - People smoking cigarettes (%)
Taste & Smell - People 40+ having problems with smell (%)
Taste & Smell - People 40+ having problems with taste (%)
Taste & Smell - People 40+ that ever had wisdom teeth removed (%)
Taste & Smell - People 40+ that ever had tonsils teeth removed (%)
Taste & Smell - People 40+ that ever had a loss of consciousness because of a head injury (%)
Taste & Smell - People 40+ that ever had a broken nose or other serious injury to face or skull (%)
Taste & Smell - People 40+ that ever had two or more sinus infections (%)
Weight - Average height (inches)
Weight - Average weight (pounds)
Weight - Average BMI
Weight - People that are obese (%)
Weight - People that ever were obese (%)
Weight - People trying to lose weight (%)
Urban population: 4,159
Rural population: 6,530
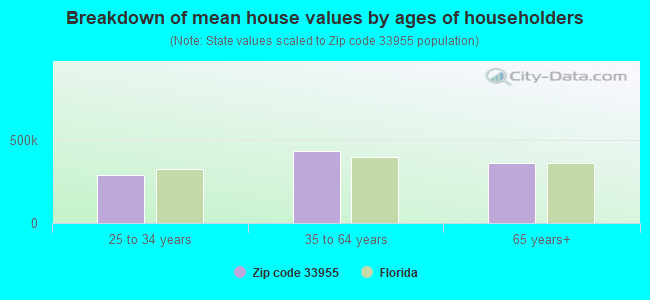
Estimated median house/condo value in 2022: $366,703
33955:
$366,703Florida:
$354,100
According to our research of Florida and other state lists, there were 18 registered sex offenders living in 33955 zip code as of April 26, 2024 . The ratio of all residents to sex offenders in zip code 33955 is 615 to 1.The ratio of registered sex offenders to all residents in this zip code is near the state average.
Median resident age: This zip code:
65.5 yearsFlorida median age:
42.7 years
Average household size: This zip code:
2.0 peopleFlorida:
2.5 people
Averages for the 2020 tax year for zip code 33955, filed in 2021:
Average Adjusted Gross Income (AGI) in 2020: $86,895 (Individual Income Tax Returns) Here:
$86,895State:
$82,200
Salary/wage: $55,953 (reported on 58.9% of returns )Here:
$55,953State:
$58,347
(% of AGI for various income ranges: 958.9% for AGIs below $25k , 2892.8% for AGIs $25k-50k , 4407.4% for AGIs $50k-75k , 6419.3% for AGIs $75k-100k , 10674.7% for AGIs $100k-200k , 55305.6% for AGIs over 200k ) Taxable interest for individuals: $2,635 (reported on 45.8% of returns )This zip code:
$2,635Florida:
$4,272
(% of AGI for various income ranges: 59.6% for AGIs below $25k , 48.7% for AGIs $25k-50k , 81.4% for AGIs $50k-75k , 170.7% for AGIs $75k-100k , 367.9% for AGIs $100k-200k , 3084.4% for AGIs over 200k ) Ordinary dividends: $14,449 (reported on 34.1% of returns )Here:
$14,449State:
$15,863
(% of AGI for various income ranges: 106.7% for AGIs below $25k , 109.7% for AGIs $25k-50k , 225.8% for AGIs $50k-75k , 454.3% for AGIs $75k-100k , 1184.5% for AGIs $100k-200k , 17941.1% for AGIs over 200k ) Net capital gain/loss in AGI: +$33,615 (reported on 32.0% of returns )Here:
+$33,615State:
+$62,983
(% of AGI for various income ranges: 59.3% for AGIs $25k-50k , 209.2% for AGIs $50k-75k , 255.3% for AGIs $75k-100k , 1644.9% for AGIs $100k-200k , 52338.9% for AGIs over 200k ) Profit/loss from business: +$12,367 (reported on 14.7% of returns )Here:
+$12,367State:
+$9,719
(% of AGI for various income ranges: 169.0% for AGIs below $25k , 138.6% for AGIs $25k-50k , 187.2% for AGIs $50k-75k , 194.7% for AGIs $75k-100k , 663.4% for AGIs $100k-200k , 2474.4% for AGIs over 200k ) Taxable individual retirement arrangement distribution: $31,448 (reported on 24.5% of returns )33955:
$31,448Florida:
$24,823
(% of AGI for various income ranges: 170.7% for AGIs below $25k , 289.1% for AGIs $25k-50k , 705.4% for AGIs $50k-75k , 1508.3% for AGIs $75k-100k , 3114.7% for AGIs $100k-200k , 15666.7% for AGIs over 200k ) Self-employed (Keogh) retirement plans: $26,833 (reported on 0.6% of returns )33955:
$26,833Florida:
$29,694
(% of AGI for various income ranges: 171.3% for AGIs $100k-200k ) Total itemized deductions: $33,530 (reported on 8.3% of returns )Here:
$33,530State:
$45,393
(% of AGI for various income ranges: 125.3% for AGIs below $25k , 148.1% for AGIs $25k-50k , 234.6% for AGIs $50k-75k , 381.7% for AGIs $75k-100k , 1041.3% for AGIs $100k-200k , 5654.4% for AGIs over 200k ) Charity contributions: $8,708 (reported on 7.0% of returns )(% of AGI for various income ranges: 9.1% for AGIs below $25k , 14.2% for AGIs $25k-50k , 27.0% for AGIs $50k-75k , 57.0% for AGIs $75k-100k , 225.1% for AGIs $100k-200k , 1833.3% for AGIs over 200k ) Taxes paid: $7,157 (reported on 8.3% of returns )(% of AGI for various income ranges: 21.9% for AGIs below $25k , 27.1% for AGIs $25k-50k , 51.4% for AGIs $50k-75k , 97.0% for AGIs $75k-100k , 234.5% for AGIs $100k-200k , 1177.8% for AGIs over 200k ) Earned income credit: $1,925 (reported on 9.8% of returns )(% of AGI for various income ranges: 68.0% for AGIs below $25k , 42.1% for AGIs $25k-50k ) Percentage of individuals using paid preparers for their 2020 taxes: 91.0%(% for various income ranges: 84.4% for AGIs below $25k , 94.7% for AGIs $25k-50k , 93.3% for AGIs $50k-75k , 90.6% for AGIs $75k-100k , 93.9% for AGIs $100k-200k , 94.6% for AGIs over 200k )
Averages for the 2012 tax year for zip code 33955, filed in 2013:
Average Adjusted Gross Income (AGI) in 2012: $72,475 (Individual Income Tax Returns) Here:
$72,475State:
$60,316
Salary/wage: $45,571 (reported on 62.3% of returns )Here:
$45,571State:
$45,277
(% of AGI for various income ranges: 57.5% for AGIs below $25k , 55.5% for AGIs $25k-50k , 45.6% for AGIs $50k-75k , 39.1% for AGIs $75k-100k , 35.0% for AGIs $100k-200k , 31.0% for AGIs over 200k ) Taxable interest for individuals: $2,975 (reported on 47.1% of returns )This zip code:
$2,975Florida:
$3,587
(% of AGI for various income ranges: 2.9% for AGIs below $25k , 1.5% for AGIs $25k-50k , 1.1% for AGIs $50k-75k , 1.5% for AGIs $75k-100k , 2.1% for AGIs $100k-200k , 2.3% for AGIs over 200k ) Ordinary dividends: $9,229 (reported on 36.2% of returns )(% of AGI for various income ranges: 5.0% for AGIs below $25k , 3.2% for AGIs $25k-50k , 3.4% for AGIs $50k-75k , 3.8% for AGIs $75k-100k , 5.0% for AGIs $100k-200k , 5.5% for AGIs over 200k ) Net capital gain/loss in AGI: +$20,437 (reported on 32.0% of returns )Here:
+$20,437State:
+$33,493
(% of AGI for various income ranges: 1.3% for AGIs $50k-75k , 0.9% for AGIs $75k-100k , 3.8% for AGIs $100k-200k , 23.3% for AGIs over 200k ) Profit/loss from business: +$10,943 (reported on 14.9% of returns )Here:
+$10,943State:
+$10,012
(% of AGI for various income ranges: 7.5% for AGIs below $25k , 2.6% for AGIs $25k-50k , 1.9% for AGIs $50k-75k , 2.8% for AGIs $75k-100k , 2.0% for AGIs $100k-200k , 1.3% for AGIs over 200k ) Taxable individual retirement arrangement distribution: $25,765 (reported on 28.8% of returns )33955:
$25,765Florida:
$21,544
(% of AGI for various income ranges: 9.1% for AGIs below $25k , 9.0% for AGIs $25k-50k , 9.1% for AGIs $50k-75k , 11.3% for AGIs $75k-100k , 13.5% for AGIs $100k-200k , 8.6% for AGIs over 200k ) Self-employment retirement plans: $17,950 (reported on 0.5% of returns )33955:
$17,950Florida:
$20,611
Total itemized deductions: $24,973 (18% of AGI, reported on 32.0% of returns )Here:
$24,973State:
$25,533
Here:
18.3% of AGIState:
18.0% of AGI
(% of AGI for various income ranges: 16.0% for AGIs below $25k , 11.7% for AGIs $25k-50k , 11.4% for AGIs $50k-75k , 11.1% for AGIs $75k-100k , 12.4% for AGIs $100k-200k , 8.8% for AGIs over 200k ) Charity contributions: $3,868 (reported on 27.3% of returns )(% of AGI for various income ranges: 1.0% for AGIs below $25k , 1.0% for AGIs $25k-50k , 1.1% for AGIs $50k-75k , 1.3% for AGIs $75k-100k , 1.8% for AGIs $100k-200k , 1.7% for AGIs over 200k ) Taxes paid: $7,694 (reported on 31.5% of returns )(% of AGI for various income ranges: 3.0% for AGIs below $25k , 2.5% for AGIs $25k-50k , 2.5% for AGIs $50k-75k , 2.7% for AGIs $75k-100k , 3.6% for AGIs $100k-200k , 4.1% for AGIs over 200k ) Earned income credit: $1,954 (reported on 14.1% of returns )(% of AGI for various income ranges: 5.0% for AGIs below $25k , 0.8% for AGIs $25k-50k ) Percentage of individuals using paid preparers for their 2012 taxes: 53.8%(% for various income ranges: 44.6% for AGIs below $25k , 50.6% for AGIs $25k-50k , 55.6% for AGIs $50k-75k , 60.5% for AGIs $75k-100k , 66.7% for AGIs $100k-200k , 83.3% for AGIs over 200k )
Averages for the 2004 tax year for zip code 33955, filed in 2005:
Average Adjusted Gross Income (AGI) in 2004: $71,228 (Individual Income Tax Returns) Here:
$71,228State:
$50,523
Salary/wage: $42,798 (reported on 66.4% of returns )Here:
$42,798State:
$39,563
(% of AGI for various income ranges: 217.3% for AGIs below $10k , 54.6% for AGIs $10k-25k , 54.8% for AGIs $25k-50k , 50.1% for AGIs $50k-75k , 39.2% for AGIs $75k-100k , 31.8% for AGIs over 100k ) Taxable interest for individuals: $3,115 (reported on 62.6% of returns )This zip code:
$3,115Florida:
$3,211
(% of AGI for various income ranges: 25.7% for AGIs below $10k , 5.3% for AGIs $10k-25k , 3.9% for AGIs $25k-50k , 2.9% for AGIs $50k-75k , 2.7% for AGIs $75k-100k , 2.1% for AGIs over 100k ) Taxable dividends: $5,788 (reported on 41.5% of returns )(% of AGI for various income ranges: 26.5% for AGIs below $10k , 4.8% for AGIs $10k-25k , 3.2% for AGIs $25k-50k , 2.9% for AGIs $50k-75k , 3.3% for AGIs $75k-100k , 3.3% for AGIs over 100k ) Net capital gain/loss: +$39,581 (reported on 38.5% of returns )Here:
+$39,581State:
+$27,205
(% of AGI for various income ranges: -5.5% for AGIs below $10k , 0.7% for AGIs $10k-25k , 1.6% for AGIs $25k-50k , 3.1% for AGIs $50k-75k , 5.9% for AGIs $75k-100k , 35.2% for AGIs over 100k ) Profit/loss from business: +$14,666 (reported on 15.9% of returns )Here:
+$14,666State:
+$10,634
(% of AGI for various income ranges: 23.3% for AGIs below $10k , 5.0% for AGIs $10k-25k , 3.3% for AGIs $25k-50k , 2.4% for AGIs $50k-75k , 2.6% for AGIs $75k-100k , 3.3% for AGIs over 100k ) IRA payment deduction: $3,476 (reported on 3.9% of returns )33955:
$3,476Florida:
$3,082
(% of AGI for various income ranges: 0.2% for AGIs $10k-25k , 0.3% for AGIs $25k-50k , 0.4% for AGIs $50k-75k , 0.2% for AGIs $75k-100k , 0.1% for AGIs over 100k ) Self-employed pension: $17,606 (reported on 0.9% of returns )Here:
$17,606Florida:
$15,857
Total itemized deductions: $24,525 (20% of AGI, reported on 41.3% of returns )Here:
$24,525State:
$20,370
Here:
20.4% of AGIState:
20.7% of AGI
(% of AGI for various income ranges: 82.9% for AGIs below $10k , 20.8% for AGIs $10k-25k , 18.9% for AGIs $25k-50k , 18.2% for AGIs $50k-75k , 17.6% for AGIs $75k-100k , 10.5% for AGIs over 100k ) Charity contributions deductions: $2,947 (2% of AGI, reported on 35.6% of returns )Here:
2.4% of AGIState:
3.8% of AGI
(% of AGI for various income ranges: 3.1% for AGIs below $10k , 1.3% for AGIs $10k-25k , 1.4% for AGIs $25k-50k , 1.8% for AGIs $50k-75k , 1.9% for AGIs $75k-100k , 1.3% for AGIs over 100k ) Total tax: $12,480 (reported on 79.4% of returns )33955:
$12,480State:
$9,431
(% of AGI for various income ranges: 9.1% for AGIs below $10k , 3.6% for AGIs $10k-25k , 6.6% for AGIs $25k-50k , 8.4% for AGIs $50k-75k , 10.5% for AGIs $75k-100k , 18.5% for AGIs over 100k ) Earned income credit: $1,372 (reported on 9.0% of returns )Percentage of individuals using paid preparers for their 2004 taxes: 60.2%(% for various income ranges: 50.1% for AGIs below $10k , 59.5% for AGIs $10k-25k , 58.5% for AGIs $25k-50k , 57.8% for AGIs $50k-75k , 66.3% for AGIs $75k-100k , 73.9% for AGIs over 100k )
Estimated median household income in 2022: This zip code:
$75,023Florida:
$69,303
Nearest zip codes: 33950 ,
33993 ,
33909 ,
33903 ,
33917 ,
33980 .
Punta Gorda Zip Code Map
Percentage of family households: This zip code:
24.1%Florida:
41.2%
Percentage of households with unmarried partners: This zip code:
4.7%Florida:
46.7%
No gay or lesbian households reported
Household received Food Stamps/SNAP in the past 12 months: 250Household did not receive Food Stamps/SNAP in the past 12 months: 4,946
Women who did not have a birth in the past 12 months: 1,335 (823 now married , 513 unmarried)
Housing units in zip code 33955 with a mortgage: 1,724 (71
second mortgage , 71
both second mortgage and home equity loan )
Houses without a mortgage: 63
Median monthly owner costs for units with a mortgage: $1,621
Median monthly owner costs for units without a mortgage: $648
Residents with income below the poverty level in 2022:
This zip code:
8.8%Whole state:
12.7%
Residents with income below 50% of the poverty level in 2022:
This zip code:
5.8%Whole state:
6.6%
Median number of rooms in houses and condos: Median number of rooms in apartments:
Year house built (houses)
100 2020 or later736 2010 to 20192,158 2000 to 20091,920 1990 to 19991,182 1980 to 1989456 1970 to 197995 1960 to 1969161 1950 to 195916 1940 to 19490 1939 or earlier
Zip code 33955 household income distribution in 2022 191 Less than $10,00091 $10,000 to $14,999150 $15,000 to $19,999290 $20,000 to $24,999139 $25,000 to $29,999178 $30,000 to $34,999276 $35,000 to $39,99992 $40,000 to $44,999211 $45,000 to $49,999367 $50,000 to $59,999598 $60,000 to $74,999632 $75,000 to $99,999544 $100,000 to $124,999492 $125,000 to $149,999316 $150,000 to $199,999586 $200,000 or moreEstimate of home value of owner-occupied houses/condos in 2022 in zip code 33955 115 Less than $10,00010 $10,000 to $14,99964 $15,000 to $19,99918 $25,000 to $29,99929 $30,000 to $34,99915 $35,000 to $39,99990 $40,000 to $49,99958 $60,000 to $69,99974 $70,000 to $79,99932 $90,000 to $99,999136 $100,000 to $124,99955 $125,000 to $149,999185 $150,000 to $174,999177 $175,000 to $199,999317 $200,000 to $249,999448 $250,000 to $299,9991,200 $300,000 to $399,999921 $400,000 to $499,999640 $500,000 to $749,999220 $750,000 to $999,9998 $1,000,000 to $1,499,999Rent paid by renters in 2022 in zip code 33955 23 $550 to $59914 $750 to $7997 $800 to $8996 $900 to $99957 $1,000 to $1,24922 $1,250 to $1,499118 $1,500 to $1,99986 $3,000 to $3,49957 No cash rent
Median gross rent in 2022: $1,617.
Median price asked for vacant for-sale houses and condos in 2022: $558,481.
Estimated median house (or condo) value in 2022 for: White Non-Hispanic householders: $415,325Black or African American householders: $77,167American Indian or Alaska Native householders: $337,216Two or more races householders: $249,383Hispanic or Latino householders: $235,267Estimated median house or condo value in 2022: $366,703
33955:
$366,703Florida:
$354,100
Lower value quartile - upper value quartile: $224,083 - $497,759
Mean price in 2022: Detached houses: $398,914Here:
$398,914State:
$500,941
Townhouses or other attached units: $330,755Here:
$330,755State:
$370,869
In 3-to-4-unit structures: $427,240Here:
$427,240State:
$309,944
In 5-or-more-unit structures: $466,282Here:
$466,282State:
$447,145
Mobile homes: $83,472Here:
$83,472State:
$113,202
Housing units in structures:
One, detached: 4,249One, attached: 378Two: 523 or 4: 2745 to 9: 15010 to 19: 38420 to 49: 33950 or more: 234Mobile homes: 883Unemployment : 2.5%
Means of transportation to work in zip code 33955 68.6% 2,369 Drove a car alone5.0% 173 Carpooled0.4% 15 Motorcycle1.7% 58 Walked1.7% 58 Other means25.0% 863 Worked at homeTravel time to work (commute) in zip code 33955 76 Less than 5 minutes330 5 to 9 minutes286 10 to 14 minutes333 15 to 19 minutes416 20 to 24 minutes211 25 to 29 minutes552 30 to 34 minutes65 35 to 39 minutes73 40 to 44 minutes162 45 to 59 minutes157 60 to 89 minutes13 90 or more minutes
Percentage of zip code residents living and working in this county: 76.3%
Household type by relationship:
Households: 10,690
Male householders: 2,790 (705 living alone ), Female householders: 2,376 (630 living alone )3,244 spouses (3,232 opposite-sex spouses ), 283 unmarried partners , (260 opposite-sex unmarried partners ), 1,192 children (959 natural , 38 adopted , 187 stepchildren ), 232 grandchildren , 0 brothers or sisters , 115 parents , 8 foster children , 30 other relatives , 154 non-relatives In group quarters: 412 (-1 institutionalized population )
Size of family households: 2,813 2-persons , 316 3-persons , 363 4-persons , 32 7-or-more-persons
Size of nonfamily households: 1,333 1-person , 295 2-persons , 18 3-persons
541 married couples with children. single-parent households (39 men , 18 women ).
90.8% of residents of 33955 zip code speak English at home. of residents speak Spanish at home (32% very well, 9% well, 3% not well, 57% not at all ).of residents speak other Indo-European language at home (69% very well, 9% well, 22% not well ).of residents speak Asian or Pacific Island language at home (62% very well, 38% well ).of residents speak other language at home (100% very well ).
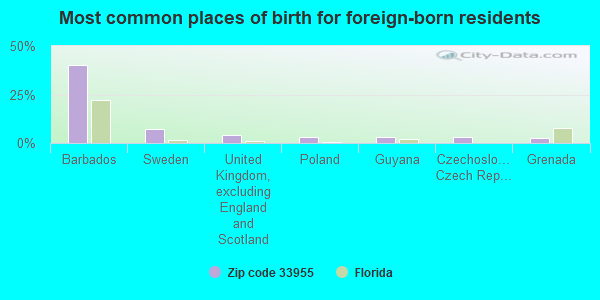
Foreign born population: 898 (8.4%)
(74.3%
of them are naturalized citizens )
This zip code:
8.4%Whole state:
21.7%
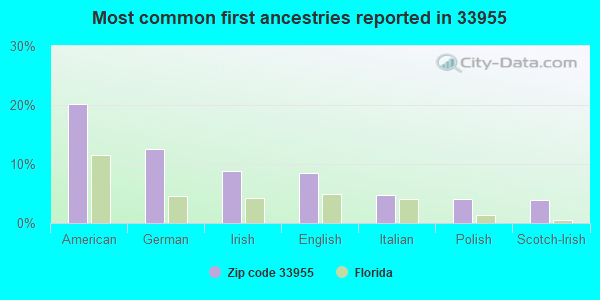
40% Barbados 7% Sweden 4% United Kingdom, excluding England and Scotland 3% Poland 3% Guyana 3% Czechoslovakia (includes Czech Republic and Slovakia) 3% Grenada 20% American 13% German 9% Irish 9% English 5% Italian 4% Polish 4% Scotch-Irish
Year of entry for the foreign-born population
543 2010 or later 175 2000 to 2009 102 1990 to 1999 406 Before 1990
Facilities with environmental interests located in this zip code:
SOUTHWEST AGGREGATES INC (16470 TAMIAMI TRAIL S in PUNTA GORDA, FL)
(Resource Conservation and Recovery Act (tracking hazardous waste))
ACE MINI-STORAGE (12325 LAMONTIER DR in PUNTA GORDA, FL)
National Pollutant Discharge Elimination System NON-MAJOR (Tracking pollutant discharge elimination systems) - permit Alternative names: MYRON & LORIE ACE
IRONHORSE CUSTOM PAINTING (12560 TAMIAMI TR in PUNTA GORDA, FL)
Small Quantity Generators, between 100 kg and 1000 kg of hazardous waste/month (Resource Conservation and Recovery Act (tracking hazardous waste)) - notification Organizations: GEORGE EID JR, OWNER (CONTACT/OWNER)
Housing units lacking complete plumbing facilities: 0.2%
Housing units lacking complete kitchen facilities: 0.2%
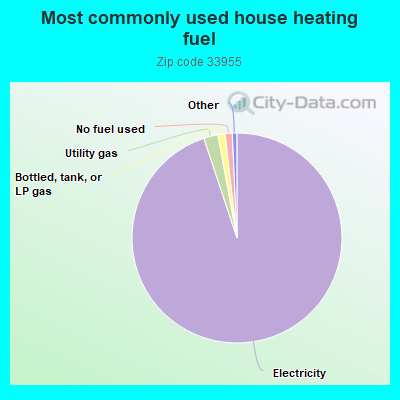
94.9% Electricity 2.2% Utility gas 1.1% Bottled, tank, or LP gas 1.1% No fuel used
Population in 1990: 5,206. Population change in the 1990s: +1,021 (+19.6%).
Place of birth for U.S.-born residents:
This state: 1,770Northeast: 3,129Midwest: 3,188South: 1,065West: 337
47% of the 33955 zip code residents lived in the same house 5 years ago.
Out of people who lived in different houses, 30% lived in this county.
Out of people who lived in different counties, 50% lived in Florida.
89% of the 33955 zip code residents lived in the same house 1 year ago.
Out of people who lived in different houses, 25% moved from this county.
Out of people who lived in different houses, 30% moved from different county within same state.
Out of people who lived in different houses, 45% moved from different state.
Out of people who lived in different houses, 6% moved from abroad.
Private vs. public school enrollment:
Students in private schools in grades 1 to 8 (elementary and middle school): 107
Students in private schools in grades 9 to 12 (high school): 19
Students in private undergraduate colleges: 76
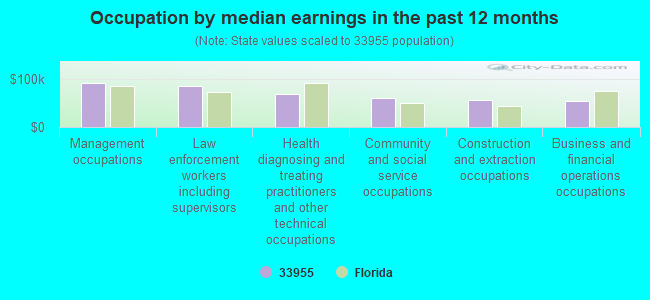
Occupation by median earnings in the past 12 months ($)
92,630 Management occupations 86,754 Law enforcement workers including supervisors 70,449 Health diagnosing and treating practitioners and other technical occupations 61,287 Community and social service occupations 57,497 Construction and extraction occupations 55,511 Business and financial operations occupations
Companies with federal contracts located in this zip code:
CAMPER DEPOT RV (12657 TAMIAMI TRAIL in PUNTA GORDA, FL; small business)
$139,930 with Public Buildings Service for Trailers. Signed on 2005-11-04. Completion date: 2005-11-19.
Top industries in this zip code by the number of employees in 2005:
Construction: Roofing Contractors (100-249 employees: 1 establishment, 1-4 employees: 2 establishments)Arts, Entertainment, and Recreation: Marinas (50-99: 1, 20-49: 2)Mining: All Other Nonmetallic Mineral Mining (50-99: 1)Real Estate and Rental and Leasing: Offices of Real Estate Agents and Brokers (5-9: 3, 1-4: 12)Wholesale Trade: Dairy Product (except Dried or Canned) Merchant Wholesalers (20-49: 1)Construction: Plumbing, Heating, and Air-Conditioning Contractors (10-19: 1, 1-4: 6)Construction: New Single-Family Housing Construction (except Operative Builders) (10-19: 1, 1-4: 1)Other Services (except Public Administration): Religious Organizations (10-19: 1, 1-4: 1)
People in group quarters in 2010:
1,067 people in state prisons
4 people in group homes intended for adults
Fatal accident statistics in 2014:
Fatal accident count: 2Vehicles involved in fatal accidents: 3Fatal accidents caused by drunken drivers: 0Fatalities: 2Persons involved in fatal accidents: 3Pedestrians involved in fatal accidents: 1
Fatal accident statistics in 2013:
Fatal accident count: 3Vehicles involved in fatal accidents: 3Fatal accidents caused by drunken drivers: 2Fatalities: 4Persons involved in fatal accidents: 5Pedestrians involved in fatal accidents: 1
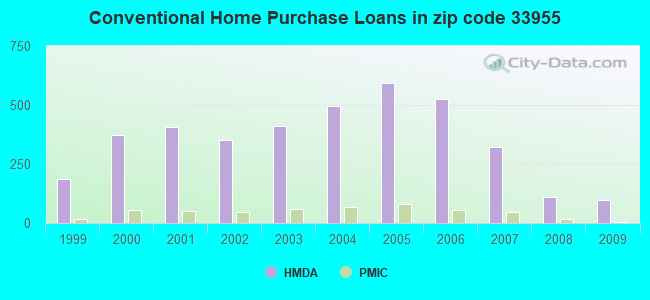
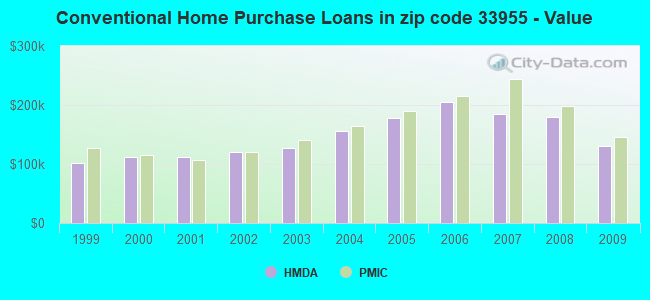
Home Mortgage Disclosure Act Aggregated Statistics For Year 2009(Based on 2 partial tracts) A) FHA, FSA/RHS & VA B) Conventional C) Refinancings D) Home Improvement Loans F) Non-occupant Loans on G) Loans On Manufactured Number Average Value Number Average Value Number Average Value Number Average Value Number Average Value Number Average Value
LOANS ORIGINATED 31 $99,981 97 $130,525 159 $171,487 1 $130,920 62 $142,118 9 $59,657 APPLICATIONS APPROVED, NOT ACCEPTED 3 $111,797 16 $102,051 15 $156,416 0 $0 7 $143,737 6 $41,433 APPLICATIONS DENIED 15 $101,989 21 $86,019 137 $202,461 12 $32,730 21 $150,322 16 $75,664 APPLICATIONS WITHDRAWN 7 $90,151 10 $123,564 38 $174,468 4 $33,832 10 $137,538 1 $36,770 FILES CLOSED FOR INCOMPLETENESS 0 $0 3 $133,370 10 $143,275 0 $0 0 $0 1 $105,910
Aggregated Statistics For Year 2008(Based on 2 partial tracts) A) FHA, FSA/RHS & VA B) Conventional C) Refinancings D) Home Improvement Loans F) Non-occupant Loans on G) Loans On Manufactured Number Average Value Number Average Value Number Average Value Number Average Value Number Average Value Number Average Value
LOANS ORIGINATED 25 $157,162 112 $180,184 144 $161,677 13 $59,066 47 $204,219 29 $63,354 APPLICATIONS APPROVED, NOT ACCEPTED 1 $83,850 32 $111,152 57 $142,171 13 $67,440 12 $171,617 34 $81,727 APPLICATIONS DENIED 9 $113,430 44 $176,286 154 $174,801 16 $41,924 38 $173,539 28 $62,990 APPLICATIONS WITHDRAWN 3 $223,593 18 $177,909 47 $170,198 6 $101,743 10 $164,016 1 $73,550 FILES CLOSED FOR INCOMPLETENESS 1 $380,990 10 $154,602 16 $136,527 0 $0 4 $186,450 1 $70,610
Aggregated Statistics For Year 2007(Based on 2 partial tracts) A) FHA, FSA/RHS & VA B) Conventional C) Refinancings D) Home Improvement Loans F) Non-occupant Loans on G) Loans On Manufactured Number Average Value Number Average Value Number Average Value Number Average Value Number Average Value Number Average Value
LOANS ORIGINATED 19 $131,693 321 $184,961 335 $174,175 53 $77,436 124 $204,766 78 $75,040 APPLICATIONS APPROVED, NOT ACCEPTED 4 $114,002 76 $188,211 118 $169,352 18 $90,467 47 $212,419 38 $69,640 APPLICATIONS DENIED 7 $149,411 96 $192,517 271 $213,583 46 $108,630 66 $215,613 38 $83,150 APPLICATIONS WITHDRAWN 6 $188,533 63 $195,410 116 $188,580 9 $157,888 41 $190,190 4 $57,370 FILES CLOSED FOR INCOMPLETENESS 1 $176,520 24 $238,731 46 $232,258 4 $115,472 10 $192,995 0 $0
Aggregated Statistics For Year 2006(Based on 2 partial tracts) A) FHA, FSA/RHS & VA B) Conventional C) Refinancings D) Home Improvement Loans F) Non-occupant Loans on G) Loans On Manufactured Number Average Value Number Average Value Number Average Value Number Average Value Number Average Value Number Average Value
LOANS ORIGINATED 21 $143,948 525 $205,699 455 $180,716 60 $71,319 199 $225,906 69 $74,232 APPLICATIONS APPROVED, NOT ACCEPTED 1 $223,590 94 $183,640 109 $175,440 12 $96,351 47 $226,284 35 $85,444 APPLICATIONS DENIED 9 $170,636 202 $177,081 241 $188,154 29 $117,376 87 $231,404 66 $52,867 APPLICATIONS WITHDRAWN 9 $164,589 115 $236,063 200 $178,057 15 $136,803 68 $246,825 15 $112,188 FILES CLOSED FOR INCOMPLETENESS 0 $0 16 $185,806 74 $187,135 0 $0 13 $249,504 1 $92,670
Aggregated Statistics For Year 2005(Based on 2 partial tracts) A) FHA, FSA/RHS & VA B) Conventional C) Refinancings D) Home Improvement Loans F) Non-occupant Loans on G) Loans On Manufactured Number Average Value Number Average Value Number Average Value Number Average Value Number Average Value Number Average Value
LOANS ORIGINATED 13 $142,008 594 $177,776 375 $156,267 38 $132,777 193 $181,146 100 $67,622 APPLICATIONS APPROVED, NOT ACCEPTED 3 $153,963 113 $143,885 85 $191,057 13 $32,022 47 $184,470 47 $68,261 APPLICATIONS DENIED 3 $50,503 179 $134,239 194 $149,231 50 $65,518 41 $131,529 101 $74,249 APPLICATIONS WITHDRAWN 3 $86,790 140 $225,052 146 $166,898 16 $139,469 63 $212,991 12 $72,814 FILES CLOSED FOR INCOMPLETENESS 0 $0 37 $201,090 59 $175,697 12 $111,183 18 $199,157 4 $86,420
Aggregated Statistics For Year 2004(Based on 2 partial tracts) A) FHA, FSA/RHS & VA B) Conventional C) Refinancings D) Home Improvement Loans F) Non-occupant Loans on G) Loans On Manufactured Number Average Value Number Average Value Number Average Value Number Average Value Number Average Value Number Average Value
LOANS ORIGINATED 19 $113,344 494 $155,834 327 $128,535 53 $62,476 169 $180,089 110 $57,021 APPLICATIONS APPROVED, NOT ACCEPTED 6 $121,112 107 $135,607 65 $115,734 9 $46,909 28 $178,306 53 $61,782 APPLICATIONS DENIED 7 $77,963 110 $120,876 209 $98,557 35 $73,256 40 $157,507 54 $61,537 APPLICATIONS WITHDRAWN 1 $177,990 43 $177,341 122 $128,254 9 $52,466 10 $200,497 3 $89,730 FILES CLOSED FOR INCOMPLETENESS 0 $0 12 $158,622 56 $132,810 1 $142,690 4 $236,830 3 $67,177
Aggregated Statistics For Year 2003(Based on 2 partial tracts) A) FHA, FSA/RHS & VA B) Conventional C) Refinancings D) Home Improvement Loans F) Non-occupant Loans on Number Average Value Number Average Value Number Average Value Number Average Value Number Average Value
LOANS ORIGINATED 25 $94,909 413 $127,703 644 $109,982 19 $46,685 122 $129,954 APPLICATIONS APPROVED, NOT ACCEPTED 3 $154,947 69 $76,790 85 $112,177 10 $60,752 16 $67,114 APPLICATIONS DENIED 9 $74,367 88 $98,206 234 $97,891 35 $38,414 26 $97,312 APPLICATIONS WITHDRAWN 3 $94,143 28 $115,999 93 $99,190 6 $20,348 12 $99,538 FILES CLOSED FOR INCOMPLETENESS 0 $0 6 $174,068 28 $130,394 0 $0 0 $0
Aggregated Statistics For Year 2002(Based on 2 partial tracts) A) FHA, FSA/RHS & VA B) Conventional C) Refinancings D) Home Improvement Loans F) Non-occupant Loans on Number Average Value Number Average Value Number Average Value Number Average Value Number Average Value
LOANS ORIGINATED 16 $89,455 353 $120,301 371 $100,520 28 $42,764 107 $134,961 APPLICATIONS APPROVED, NOT ACCEPTED 3 $84,827 51 $106,287 49 $90,451 10 $26,772 16 $106,556 APPLICATIONS DENIED 6 $82,622 74 $71,284 185 $87,139 41 $16,934 29 $60,970 APPLICATIONS WITHDRAWN 3 $74,530 21 $109,344 93 $97,434 4 $18,755 4 $150,042 FILES CLOSED FOR INCOMPLETENESS 0 $0 7 $133,440 31 $94,476 0 $0 3 $126,997
Aggregated Statistics For Year 2001(Based on 2 partial tracts) A) FHA, FSA/RHS & VA B) Conventional C) Refinancings D) Home Improvement Loans F) Non-occupant Loans on Number Average Value Number Average Value Number Average Value Number Average Value Number Average Value
LOANS ORIGINATED 38 $87,873 405 $112,286 363 $99,781 29 $31,906 124 $124,632 APPLICATIONS APPROVED, NOT ACCEPTED 3 $86,790 79 $67,070 57 $100,880 4 $8,458 7 $107,173 APPLICATIONS DENIED 7 $56,529 71 $60,145 175 $72,625 44 $12,537 18 $53,610 APPLICATIONS WITHDRAWN 0 $0 21 $109,835 106 $81,224 6 $33,343 10 $94,732 FILES CLOSED FOR INCOMPLETENESS 1 $60,310 10 $89,437 13 $88,939 0 $0 3 $96,597
Aggregated Statistics For Year 2000(Based on 2 partial tracts) A) FHA, FSA/RHS & VA B) Conventional C) Refinancings D) Home Improvement Loans F) Non-occupant Loans on Number Average Value Number Average Value Number Average Value Number Average Value Number Average Value
LOANS ORIGINATED 46 $81,704 372 $111,511 110 $62,972 29 $33,681 134 $122,598 APPLICATIONS APPROVED, NOT ACCEPTED 3 $56,387 79 $80,402 41 $56,006 15 $26,772 15 $101,303 APPLICATIONS DENIED 4 $77,228 88 $71,594 119 $55,453 31 $19,692 24 $114,493 APPLICATIONS WITHDRAWN 0 $0 31 $105,200 93 $59,172 7 $31,521 3 $90,710 FILES CLOSED FOR INCOMPLETENESS 1 $63,250 6 $80,660 12 $70,731 0 $0 3 $71,097
Aggregated Statistics For Year 1999(Based on 1 partial tract) A) FHA, FSA/RHS & VA B) Conventional C) Refinancings D) Home Improvement Loans F) Non-occupant Loans on Number Average Value Number Average Value Number Average Value Number Average Value Number Average Value
LOANS ORIGINATED 30 $66,865 188 $102,523 104 $72,226 11 $20,565 71 $114,635 APPLICATIONS APPROVED, NOT ACCEPTED 0 $0 28 $83,029 33 $67,442 5 $26,852 7 $123,320 APPLICATIONS DENIED 2 $84,645 42 $67,497 84 $55,292 15 $16,832 6 $106,050 APPLICATIONS WITHDRAWN 1 $30,650 11 $91,345 37 $58,632 4 $56,188 5 $129,594 FILES CLOSED FOR INCOMPLETENESS 0 $0 5 $144,918 7 $72,866 0 $0 1 $120,400
Detailed HMDA statistics for the following Tracts:
0105.00
Private Mortgage Insurance Companies Aggregated Statistics For Year 2009(Based on 2 partial tracts) A) Conventional B) Refinancings C) Non-occupant Loans on Number Average Value Number Average Value Number Average Value
LOANS ORIGINATED 3 $146,610 1 $317,740 0 $0 APPLICATIONS APPROVED, NOT ACCEPTED 7 $317,736 0 $0 7 $317,736 APPLICATIONS DENIED 4 $197,482 0 $0 0 $0 APPLICATIONS WITHDRAWN 0 $0 0 $0 0 $0 FILES CLOSED FOR INCOMPLETENESS 0 $0 0 $0 0 $0
Aggregated Statistics For Year 2008(Based on 2 partial tracts) A) Conventional B) Refinancings C) Non-occupant Loans on Number Average Value Number Average Value Number Average Value
LOANS ORIGINATED 15 $198,781 10 $183,875 6 $138,273 APPLICATIONS APPROVED, NOT ACCEPTED 24 $274,770 15 $273,410 10 $276,842 APPLICATIONS DENIED 0 $0 7 $229,266 3 $135,823 APPLICATIONS WITHDRAWN 4 $354,510 1 $456,010 3 $298,123 FILES CLOSED FOR INCOMPLETENESS 0 $0 1 $200,060 1 $200,060
Aggregated Statistics For Year 2007(Based on 2 partial tracts) A) Conventional B) Refinancings C) Non-occupant Loans on Number Average Value Number Average Value Number Average Value
LOANS ORIGINATED 46 $243,291 31 $252,300 10 $258,896 APPLICATIONS APPROVED, NOT ACCEPTED 35 $302,732 18 $300,656 28 $324,198 APPLICATIONS DENIED 3 $191,230 1 $182,400 1 $353,040 APPLICATIONS WITHDRAWN 13 $284,242 4 $380,620 13 $320,678 FILES CLOSED FOR INCOMPLETENESS 0 $0 0 $0 0 $0
Aggregated Statistics For Year 2006(Based on 2 partial tracts) A) Conventional B) Refinancings C) Non-occupant Loans on Number Average Value Number Average Value Number Average Value
LOANS ORIGINATED 56 $215,948 15 $280,863 24 $236,831 APPLICATIONS APPROVED, NOT ACCEPTED 41 $229,871 13 $338,895 32 $276,916 APPLICATIONS DENIED 9 $229,312 0 $0 9 $229,312 APPLICATIONS WITHDRAWN 15 $317,638 0 $0 9 $348,790 FILES CLOSED FOR INCOMPLETENESS 1 $363,340 0 $0 0 $0
Aggregated Statistics For Year 2005(Based on 2 partial tracts) A) Conventional B) Refinancings C) Non-occupant Loans on D) Loans On Manufactured Number Average Value Number Average Value Number Average Value Number Average Value
LOANS ORIGINATED 79 $190,262 15 $173,676 35 $171,939 4 $72,080 APPLICATIONS APPROVED, NOT ACCEPTED 38 $208,727 10 $200,939 16 $208,331 0 $0 APPLICATIONS DENIED 1 $423,650 0 $0 1 $423,650 0 $0 APPLICATIONS WITHDRAWN 3 $243,697 7 $233,679 1 $376,580 3 $95,613 FILES CLOSED FOR INCOMPLETENESS 3 $288,807 0 $0 0 $0 0 $0
Aggregated Statistics For Year 2004(Based on 2 partial tracts) A) Conventional B) Refinancings C) Non-occupant Loans on D) Loans On Manufactured Number Average Value Number Average Value Number Average Value Number Average Value
LOANS ORIGINATED 69 $164,731 4 $234,625 13 $155,700 3 $76,983 APPLICATIONS APPROVED, NOT ACCEPTED 32 $169,073 18 $209,291 13 $172,220 0 $0 APPLICATIONS DENIED 6 $92,673 1 $155,930 3 $45,600 1 $61,780 APPLICATIONS WITHDRAWN 9 $152,493 1 $553,100 4 $176,888 0 $0 FILES CLOSED FOR INCOMPLETENESS 1 $235,360 6 $250,070 0 $0 0 $0
Aggregated Statistics For Year 2003(Based on 2 partial tracts) A) Conventional B) Refinancings C) Non-occupant Loans on Number Average Value Number Average Value Number Average Value
LOANS ORIGINATED 60 $140,383 28 $143,895 10 $183,287 APPLICATIONS APPROVED, NOT ACCEPTED 25 $137,862 10 $130,478 6 $127,242 APPLICATIONS DENIED 3 $110,817 0 $0 0 $0 APPLICATIONS WITHDRAWN 1 $273,610 4 $208,515 1 $273,610 FILES CLOSED FOR INCOMPLETENESS 0 $0 0 $0 0 $0
Aggregated Statistics For Year 2002(Based on 2 partial tracts) A) Conventional B) Refinancings C) Non-occupant Loans on Number Average Value Number Average Value Number Average Value
LOANS ORIGINATED 47 $120,215 22 $108,988 15 $111,992 APPLICATIONS APPROVED, NOT ACCEPTED 40 $152,580 9 $123,400 10 $185,640 APPLICATIONS DENIED 0 $0 0 $0 0 $0 APPLICATIONS WITHDRAWN 3 $101,990 1 $157,400 1 $55,900 FILES CLOSED FOR INCOMPLETENESS 0 $0 0 $0 0 $0
Aggregated Statistics For Year 2001(Based on 2 partial tracts) A) Conventional B) Refinancings C) Non-occupant Loans on Number Average Value Number Average Value Number Average Value
LOANS ORIGINATED 50 $107,206 21 $116,489 6 $50,505 APPLICATIONS APPROVED, NOT ACCEPTED 22 $144,024 9 $106,566 7 $191,440 APPLICATIONS DENIED 6 $95,370 1 $136,800 3 $76,983 APPLICATIONS WITHDRAWN 0 $0 1 $205,940 0 $0 FILES CLOSED FOR INCOMPLETENESS 0 $0 0 $0 0 $0
Aggregated Statistics For Year 2000(Based on 2 partial tracts) A) Conventional B) Refinancings C) Non-occupant Loans on Number Average Value Number Average Value Number Average Value
LOANS ORIGINATED 56 $114,791 3 $66,193 19 $144,003 APPLICATIONS APPROVED, NOT ACCEPTED 16 $171,371 0 $0 6 $189,268 APPLICATIONS DENIED 3 $119,150 0 $0 0 $0 APPLICATIONS WITHDRAWN 0 $0 1 $183,870 0 $0 FILES CLOSED FOR INCOMPLETENESS 1 $198,580 0 $0 1 $198,580
Aggregated Statistics For Year 1999(Based on 1 partial tract) A) Conventional B) Refinancings C) Non-occupant Loans on Number Average Value Number Average Value Number Average Value
LOANS ORIGINATED 18 $126,724 5 $72,094 7 $118,837 APPLICATIONS APPROVED, NOT ACCEPTED 4 $94,132 1 $76,620 2 $139,740 APPLICATIONS DENIED 2 $204,680 2 $69,320 1 $207,960 APPLICATIONS WITHDRAWN 1 $98,510 0 $0 1 $98,510 FILES CLOSED FOR INCOMPLETENESS 0 $0 0 $0 0 $0
Detailed PMIC statistics for the following Tracts:
0105.00
2002 - 2018 National Fire Incident Reporting System (NFIRS) incidents See full 2006 National Fire Incident Reporting System statistics for zip code 33955, Florida
Most common first names in zip code 33955 among deceased individuals Name Count Lived (average)
John 45 77.2 years Robert 43 74.1 years William 36 72.9 years Richard 27 72.1 years Charles 21 74.3 years Joseph 20 73.7 years James 18 75.5 years Donald 18 72.2 years Mary 17 83.3 years Thomas 16 71.1 years
Most common last names in zip code 33955 among deceased individuals Last name Count Lived (average)
Davis 10 80.3 years Johnson 8 76.5 years Smith 8 80.6 years Jones 7 76.3 years Walker 7 75.7 years Roberts 6 82.3 years Martin 5 87.0 years Obrien 4 79.0 years Hall 4 69.2 years Brown 4 72.5 years
Businesses in zip code 33955
Name Count Name Count
Circle K 1 Penske 1 FedEx 1 U-Haul 1 Nike 1 UPS 3


 Nearest zip codes: 33950, 33993, 33909, 33903, 33917, 33980.


 According to the data from the years 2002 - 2018 the average number of fire incidents per year is 53. The highest number of fire incidents - 107 took place in 2009, and the least - 1 in 2003. The data has a rising trend.
 When looking into fire subcategories, the most incidents belonged to: Outside Fires (67.7%), and Mobile Property/Vehicle Fires (17.0%).