Estimated zip code population in 2022: 31,372
Zip code population in 2010: 28,666
Zip code population in 2000: 28,561
Houses and condos: 18,997
Renter-occupied apartments: 2,519
% of renters here:
17%State:
33%
March 2022 cost of living index in zip code 33917: 90.5
(less than average, U.S. average is 100)
Land area: 55.3
sq. mi.
Water area: 5.1
sq. mi.
Population density: 568 people per square mile (low).
OSM Map
General Map
Google Map
MSN Map
OSM Map
General Map
Google Map
MSN Map
OSM Map
General Map
Google Map
MSN Map
OSM Map
General Map
Google Map
MSN Map
Please wait while loading the map...
Real estate property taxes paid for housing units in 2022:
This zip code:
0.8% ($1,499)Florida:
0.7% ($2,529)
Median real estate property taxes paid for housing units with mortgages in 2022: $2,074 (0.7%)
Median real estate property taxes paid for housing units with no mortgage in 2022: $1,274 (1.0%)
Profiles of local businesses
Business Search - 14 Million verified businesses
Males: 15,385 Females: 15,986
For population 25 years and over in 33917:
High school or higher: 88.5%Bachelor's degree or higher: 19.8%Graduate or professional degree: 7.1%Unemployed: 3.4%Mean travel time to work (commute): 27.3 minutes
For population 15 years and over in 33917:
Never married: 19.2%Now married: 55.1%Separated: 1.7%Widowed: 11.3%Divorced: 12.8%
Zip code 33917 compared to state average:
Median house value below state average. Black race population percentage significantly below state average. Hispanic race population percentage significantly below state average. Median age significantly above state average. Foreign-born population percentage significantly below state average. Renting percentage below state average. Length of stay since moving in significantly above state average. Number of college students below state average. 26,861 85.6% White 2,704 8.6% Hispanic or Latino 713 2.3% Two or more races 501 1.6% Black 472 1.5% Asian 53 0.2% Some other race 40 0.1% American Indian 24 0.08% Native Hawaiian and Other
Data:
Median household income ($)
Median household income (% change since 2000)
Household income diversity
Ratio of average income to average house value (%)
Ratio of average income to average rent
Median household income ($) - White
Median household income ($) - Black or African American
Median household income ($) - Asian
Median household income ($) - Hispanic or Latino
Median household income ($) - American Indian and Alaska Native
Median household income ($) - Multirace
Median household income ($) - Other Race
Median household income for houses/condos with a mortgage ($)
Median household income for apartments without a mortgage ($)
Races - White alone (%)
Races - White alone (% change since 2000)
Races - Black alone (%)
Races - Black alone (% change since 2000)
Races - American Indian alone (%)
Races - American Indian alone (% change since 2000)
Races - Asian alone (%)
Races - Asian alone (% change since 2000)
Races - Hispanic (%)
Races - Hispanic (% change since 2000)
Races - Native Hawaiian and Other Pacific Islander alone (%)
Races - Native Hawaiian and Other Pacific Islander alone (% change since 2000)
Races - Two or more races (%)
Races - Two or more races (% change since 2000)
Races - Other race alone (%)
Races - Other race alone (% change since 2000)
Racial diversity
Unemployment (%)
Unemployment (% change since 2000)
Unemployment (%) - White
Unemployment (%) - Black or African American
Unemployment (%) - Asian
Unemployment (%) - Hispanic or Latino
Unemployment (%) - American Indian and Alaska Native
Unemployment (%) - Multirace
Unemployment (%) - Other Race
Population density (people per square mile)
Population - Males (%)
Population - Females (%)
Population - Males (%) - White
Population - Males (%) - Black or African American
Population - Males (%) - Asian
Population - Males (%) - Hispanic or Latino
Population - Males (%) - American Indian and Alaska Native
Population - Males (%) - Multirace
Population - Males (%) - Other Race
Population - Females (%) - White
Population - Females (%) - Black or African American
Population - Females (%) - Asian
Population - Females (%) - Hispanic or Latino
Population - Females (%) - American Indian and Alaska Native
Population - Females (%) - Multirace
Population - Females (%) - Other Race
Coronavirus confirmed cases (Apr 27, 2024)
Deaths caused by coronavirus (Apr 27, 2024)
Coronavirus confirmed cases (per 100k population) (Apr 27, 2024)
Deaths caused by coronavirus (per 100k population) (Apr 27, 2024)
Daily increase in number of cases (Apr 27, 2024)
Weekly increase in number of cases (Apr 27, 2024)
Cases doubled (in days) (Apr 27, 2024)
Hospitalized patients (Apr 18, 2022)
Negative test results (Apr 18, 2022)
Total test results (Apr 18, 2022)
COVID Vaccine doses distributed (per 100k population) (Sep 19, 2023)
COVID Vaccine doses administered (per 100k population) (Sep 19, 2023)
COVID Vaccine doses distributed (Sep 19, 2023)
COVID Vaccine doses administered (Sep 19, 2023)
Likely homosexual households (%)
Likely homosexual households (% change since 2000)
Likely homosexual households - Lesbian couples (%)
Likely homosexual households - Lesbian couples (% change since 2000)
Likely homosexual households - Gay men (%)
Likely homosexual households - Gay men (% change since 2000)
Cost of living index
Median gross rent ($)
Median contract rent ($)
Median monthly housing costs ($)
Median house or condo value ($)
Median house or condo value ($ change since 2000)
Mean house or condo value by units in structure - 1, detached ($)
Mean house or condo value by units in structure - 1, attached ($)
Mean house or condo value by units in structure - 2 ($)
Mean house or condo value by units in structure by units in structure - 3 or 4 ($)
Mean house or condo value by units in structure - 5 or more ($)
Mean house or condo value by units in structure - Boat, RV, van, etc. ($)
Mean house or condo value by units in structure - Mobile home ($)
Median house or condo value ($) - White
Median house or condo value ($) - Black or African American
Median house or condo value ($) - Asian
Median house or condo value ($) - Hispanic or Latino
Median house or condo value ($) - American Indian and Alaska Native
Median house or condo value ($) - Multirace
Median house or condo value ($) - Other Race
Median resident age
Resident age diversity
Median resident age - Males
Median resident age - Females
Median resident age - White
Median resident age - Black or African American
Median resident age - Asian
Median resident age - Hispanic or Latino
Median resident age - American Indian and Alaska Native
Median resident age - Multirace
Median resident age - Other Race
Median resident age - Males - White
Median resident age - Males - Black or African American
Median resident age - Males - Asian
Median resident age - Males - Hispanic or Latino
Median resident age - Males - American Indian and Alaska Native
Median resident age - Males - Multirace
Median resident age - Males - Other Race
Median resident age - Females - White
Median resident age - Females - Black or African American
Median resident age - Females - Asian
Median resident age - Females - Hispanic or Latino
Median resident age - Females - American Indian and Alaska Native
Median resident age - Females - Multirace
Median resident age - Females - Other Race
Commute - mean travel time to work (minutes)
Travel time to work - Less than 5 minutes (%)
Travel time to work - Less than 5 minutes (% change since 2000)
Travel time to work - 5 to 9 minutes (%)
Travel time to work - 5 to 9 minutes (% change since 2000)
Travel time to work - 10 to 19 minutes (%)
Travel time to work - 10 to 19 minutes (% change since 2000)
Travel time to work - 20 to 29 minutes (%)
Travel time to work - 20 to 29 minutes (% change since 2000)
Travel time to work - 30 to 39 minutes (%)
Travel time to work - 30 to 39 minutes (% change since 2000)
Travel time to work - 40 to 59 minutes (%)
Travel time to work - 40 to 59 minutes (% change since 2000)
Travel time to work - 60 to 89 minutes (%)
Travel time to work - 60 to 89 minutes (% change since 2000)
Travel time to work - 90 or more minutes (%)
Travel time to work - 90 or more minutes (% change since 2000)
Marital status - Never married (%)
Marital status - Now married (%)
Marital status - Separated (%)
Marital status - Widowed (%)
Marital status - Divorced (%)
Median family income ($)
Median family income (% change since 2000)
Median non-family income ($)
Median non-family income (% change since 2000)
Median per capita income ($)
Median per capita income (% change since 2000)
Median family income ($) - White
Median family income ($) - Black or African American
Median family income ($) - Asian
Median family income ($) - Hispanic or Latino
Median family income ($) - American Indian and Alaska Native
Median family income ($) - Multirace
Median family income ($) - Other Race
Median year house/condo built
Median year apartment built
Year house built - Built 2005 or later (%)
Year house built - Built 2000 to 2004 (%)
Year house built - Built 1990 to 1999 (%)
Year house built - Built 1980 to 1989 (%)
Year house built - Built 1970 to 1979 (%)
Year house built - Built 1960 to 1969 (%)
Year house built - Built 1950 to 1959 (%)
Year house built - Built 1940 to 1949 (%)
Year house built - Built 1939 or earlier (%)
Average household size
Household density (households per square mile)
Average household size - White
Average household size - Black or African American
Average household size - Asian
Average household size - Hispanic or Latino
Average household size - American Indian and Alaska Native
Average household size - Multirace
Average household size - Other Race
Occupied housing units (%)
Vacant housing units (%)
Owner occupied housing units (%)
Renter occupied housing units (%)
Vacancy status - For rent (%)
Vacancy status - For sale only (%)
Vacancy status - Rented or sold, not occupied (%)
Vacancy status - For seasonal, recreational, or occasional use (%)
Vacancy status - For migrant workers (%)
Vacancy status - Other vacant (%)
Residents with income below the poverty level (%)
Residents with income below 50% of the poverty level (%)
Children below poverty level (%)
Poor families by family type - Married-couple family (%)
Poor families by family type - Male, no wife present (%)
Poor families by family type - Female, no husband present (%)
Poverty status for native-born residents (%)
Poverty status for foreign-born residents (%)
Poverty among high school graduates not in families (%)
Poverty among people who did not graduate high school not in families (%)
Residents with income below the poverty level (%) - White
Residents with income below the poverty level (%) - Black or African American
Residents with income below the poverty level (%) - Asian
Residents with income below the poverty level (%) - Hispanic or Latino
Residents with income below the poverty level (%) - American Indian and Alaska Native
Residents with income below the poverty level (%) - Multirace
Residents with income below the poverty level (%) - Other Race
Air pollution - Air Quality Index (AQI)
Air pollution - CO
Air pollution - NO2
Air pollution - SO2
Air pollution - Ozone
Air pollution - PM10
Air pollution - PM25
Air pollution - Pb
Crime - Murders per 100,000 population
Crime - Rapes per 100,000 population
Crime - Robberies per 100,000 population
Crime - Assaults per 100,000 population
Crime - Burglaries per 100,000 population
Crime - Thefts per 100,000 population
Crime - Auto thefts per 100,000 population
Crime - Arson per 100,000 population
Crime - City-data.com crime index
Crime - Violent crime index
Crime - Property crime index
Crime - Murders per 100,000 population (5 year average)
Crime - Rapes per 100,000 population (5 year average)
Crime - Robberies per 100,000 population (5 year average)
Crime - Assaults per 100,000 population (5 year average)
Crime - Burglaries per 100,000 population (5 year average)
Crime - Thefts per 100,000 population (5 year average)
Crime - Auto thefts per 100,000 population (5 year average)
Crime - Arson per 100,000 population (5 year average)
Crime - City-data.com crime index (5 year average)
Crime - Violent crime index (5 year average)
Crime - Property crime index (5 year average)
1996 Presidential Elections Results (%) - Democratic Party (Clinton)
1996 Presidential Elections Results (%) - Republican Party (Dole)
1996 Presidential Elections Results (%) - Other
2000 Presidential Elections Results (%) - Democratic Party (Gore)
2000 Presidential Elections Results (%) - Republican Party (Bush)
2000 Presidential Elections Results (%) - Other
2004 Presidential Elections Results (%) - Democratic Party (Kerry)
2004 Presidential Elections Results (%) - Republican Party (Bush)
2004 Presidential Elections Results (%) - Other
2008 Presidential Elections Results (%) - Democratic Party (Obama)
2008 Presidential Elections Results (%) - Republican Party (McCain)
2008 Presidential Elections Results (%) - Other
2012 Presidential Elections Results (%) - Democratic Party (Obama)
2012 Presidential Elections Results (%) - Republican Party (Romney)
2012 Presidential Elections Results (%) - Other
2016 Presidential Elections Results (%) - Democratic Party (Clinton)
2016 Presidential Elections Results (%) - Republican Party (Trump)
2016 Presidential Elections Results (%) - Other
2020 Presidential Elections Results (%) - Democratic Party (Biden)
2020 Presidential Elections Results (%) - Republican Party (Trump)
2020 Presidential Elections Results (%) - Other
Ancestries Reported - Arab (%)
Ancestries Reported - Czech (%)
Ancestries Reported - Danish (%)
Ancestries Reported - Dutch (%)
Ancestries Reported - English (%)
Ancestries Reported - French (%)
Ancestries Reported - French Canadian (%)
Ancestries Reported - German (%)
Ancestries Reported - Greek (%)
Ancestries Reported - Hungarian (%)
Ancestries Reported - Irish (%)
Ancestries Reported - Italian (%)
Ancestries Reported - Lithuanian (%)
Ancestries Reported - Norwegian (%)
Ancestries Reported - Polish (%)
Ancestries Reported - Portuguese (%)
Ancestries Reported - Russian (%)
Ancestries Reported - Scotch-Irish (%)
Ancestries Reported - Scottish (%)
Ancestries Reported - Slovak (%)
Ancestries Reported - Subsaharan African (%)
Ancestries Reported - Swedish (%)
Ancestries Reported - Swiss (%)
Ancestries Reported - Ukrainian (%)
Ancestries Reported - United States (%)
Ancestries Reported - Welsh (%)
Ancestries Reported - West Indian (%)
Ancestries Reported - Other (%)
Educational Attainment - No schooling completed (%)
Educational Attainment - Less than high school (%)
Educational Attainment - High school or equivalent (%)
Educational Attainment - Less than 1 year of college (%)
Educational Attainment - 1 or more years of college (%)
Educational Attainment - Associate degree (%)
Educational Attainment - Bachelor's degree (%)
Educational Attainment - Master's degree (%)
Educational Attainment - Professional school degree (%)
Educational Attainment - Doctorate degree (%)
School Enrollment - Nursery, preschool (%)
School Enrollment - Kindergarten (%)
School Enrollment - Grade 1 to 4 (%)
School Enrollment - Grade 5 to 8 (%)
School Enrollment - Grade 9 to 12 (%)
School Enrollment - College undergrad (%)
School Enrollment - Graduate or professional (%)
School Enrollment - Not enrolled in school (%)
School enrollment - Public schools (%)
School enrollment - Private schools (%)
School enrollment - Not enrolled (%)
Median number of rooms in houses and condos
Median number of rooms in apartments
Housing units lacking complete plumbing facilities (%)
Housing units lacking complete kitchen facilities (%)
Density of houses
Urban houses (%)
Rural houses (%)
Households with people 60 years and over (%)
Households with people 65 years and over (%)
Households with people 75 years and over (%)
Households with one or more nonrelatives (%)
Households with no nonrelatives (%)
Population in households (%)
Family households (%)
Nonfamily households (%)
Population in families (%)
Family households with own children (%)
Median number of bedrooms in owner occupied houses
Mean number of bedrooms in owner occupied houses
Median number of bedrooms in renter occupied houses
Mean number of bedrooms in renter occupied houses
Median number of vehichles in owner occupied houses
Mean number of vehichles in owner occupied houses
Median number of vehichles in renter occupied houses
Mean number of vehichles in renter occupied houses
Mortgage status - with mortgage (%)
Mortgage status - with second mortgage (%)
Mortgage status - with home equity loan (%)
Mortgage status - with both second mortgage and home equity loan (%)
Mortgage status - without a mortgage (%)
Average family size
Average family size - White
Average family size - Black or African American
Average family size - Asian
Average family size - Hispanic or Latino
Average family size - American Indian and Alaska Native
Average family size - Multirace
Average family size - Other Race
Geographical mobility - Same house 1 year ago (%)
Geographical mobility - Moved within same county (%)
Geographical mobility - Moved from different county within same state (%)
Geographical mobility - Moved from different state (%)
Geographical mobility - Moved from abroad (%)
Place of birth - Born in state of residence (%)
Place of birth - Born in other state (%)
Place of birth - Native, outside of US (%)
Place of birth - Foreign born (%)
Housing units in structures - 1, detached (%)
Housing units in structures - 1, attached (%)
Housing units in structures - 2 (%)
Housing units in structures - 3 or 4 (%)
Housing units in structures - 5 to 9 (%)
Housing units in structures - 10 to 19 (%)
Housing units in structures - 20 to 49 (%)
Housing units in structures - 50 or more (%)
Housing units in structures - Mobile home (%)
Housing units in structures - Boat, RV, van, etc. (%)
House/condo owner moved in on average (years ago)
Renter moved in on average (years ago)
Year householder moved into unit - Moved in 1999 to March 2000 (%)
Year householder moved into unit - Moved in 1995 to 1998 (%)
Year householder moved into unit - Moved in 1990 to 1994 (%)
Year householder moved into unit - Moved in 1980 to 1989 (%)
Year householder moved into unit - Moved in 1970 to 1979 (%)
Year householder moved into unit - Moved in 1969 or earlier (%)
Means of transportation to work - Drove car alone (%)
Means of transportation to work - Carpooled (%)
Means of transportation to work - Public transportation (%)
Means of transportation to work - Bus or trolley bus (%)
Means of transportation to work - Streetcar or trolley car (%)
Means of transportation to work - Subway or elevated (%)
Means of transportation to work - Railroad (%)
Means of transportation to work - Ferryboat (%)
Means of transportation to work - Taxicab (%)
Means of transportation to work - Motorcycle (%)
Means of transportation to work - Bicycle (%)
Means of transportation to work - Walked (%)
Means of transportation to work - Other means (%)
Working at home (%)
Industry diversity
Most Common Industries - Agriculture, forestry, fishing and hunting, and mining (%)
Most Common Industries - Agriculture, forestry, fishing and hunting (%)
Most Common Industries - Mining, quarrying, and oil and gas extraction (%)
Most Common Industries - Construction (%)
Most Common Industries - Manufacturing (%)
Most Common Industries - Wholesale trade (%)
Most Common Industries - Retail trade (%)
Most Common Industries - Transportation and warehousing, and utilities (%)
Most Common Industries - Transportation and warehousing (%)
Most Common Industries - Utilities (%)
Most Common Industries - Information (%)
Most Common Industries - Finance and insurance, and real estate and rental and leasing (%)
Most Common Industries - Finance and insurance (%)
Most Common Industries - Real estate and rental and leasing (%)
Most Common Industries - Professional, scientific, and management, and administrative and waste management services (%)
Most Common Industries - Professional, scientific, and technical services (%)
Most Common Industries - Management of companies and enterprises (%)
Most Common Industries - Administrative and support and waste management services (%)
Most Common Industries - Educational services, and health care and social assistance (%)
Most Common Industries - Educational services (%)
Most Common Industries - Health care and social assistance (%)
Most Common Industries - Arts, entertainment, and recreation, and accommodation and food services (%)
Most Common Industries - Arts, entertainment, and recreation (%)
Most Common Industries - Accommodation and food services (%)
Most Common Industries - Other services, except public administration (%)
Most Common Industries - Public administration (%)
Occupation diversity
Most Common Occupations - Management, business, science, and arts occupations (%)
Most Common Occupations - Management, business, and financial occupations (%)
Most Common Occupations - Management occupations (%)
Most Common Occupations - Business and financial operations occupations (%)
Most Common Occupations - Computer, engineering, and science occupations (%)
Most Common Occupations - Computer and mathematical occupations (%)
Most Common Occupations - Architecture and engineering occupations (%)
Most Common Occupations - Life, physical, and social science occupations (%)
Most Common Occupations - Education, legal, community service, arts, and media occupations (%)
Most Common Occupations - Community and social service occupations (%)
Most Common Occupations - Legal occupations (%)
Most Common Occupations - Education, training, and library occupations (%)
Most Common Occupations - Arts, design, entertainment, sports, and media occupations (%)
Most Common Occupations - Healthcare practitioners and technical occupations (%)
Most Common Occupations - Health diagnosing and treating practitioners and other technical occupations (%)
Most Common Occupations - Health technologists and technicians (%)
Most Common Occupations - Service occupations (%)
Most Common Occupations - Healthcare support occupations (%)
Most Common Occupations - Protective service occupations (%)
Most Common Occupations - Fire fighting and prevention, and other protective service workers including supervisors (%)
Most Common Occupations - Law enforcement workers including supervisors (%)
Most Common Occupations - Food preparation and serving related occupations (%)
Most Common Occupations - Building and grounds cleaning and maintenance occupations (%)
Most Common Occupations - Personal care and service occupations (%)
Most Common Occupations - Sales and office occupations (%)
Most Common Occupations - Sales and related occupations (%)
Most Common Occupations - Office and administrative support occupations (%)
Most Common Occupations - Natural resources, construction, and maintenance occupations (%)
Most Common Occupations - Farming, fishing, and forestry occupations (%)
Most Common Occupations - Construction and extraction occupations (%)
Most Common Occupations - Installation, maintenance, and repair occupations (%)
Most Common Occupations - Production, transportation, and material moving occupations (%)
Most Common Occupations - Production occupations (%)
Most Common Occupations - Transportation occupations (%)
Most Common Occupations - Material moving occupations (%)
People in Group quarters - Institutionalized population (%)
People in Group quarters - Correctional institutions (%)
People in Group quarters - Federal prisons and detention centers (%)
People in Group quarters - Halfway houses (%)
People in Group quarters - Local jails and other confinement facilities (including police lockups) (%)
People in Group quarters - Military disciplinary barracks (%)
People in Group quarters - State prisons (%)
People in Group quarters - Other types of correctional institutions (%)
People in Group quarters - Nursing homes (%)
People in Group quarters - Hospitals/wards, hospices, and schools for the handicapped (%)
People in Group quarters - Hospitals/wards and hospices for chronically ill (%)
People in Group quarters - Hospices or homes for chronically ill (%)
People in Group quarters - Military hospitals or wards for chronically ill (%)
People in Group quarters - Other hospitals or wards for chronically ill (%)
People in Group quarters - Hospitals or wards for drug/alcohol abuse (%)
People in Group quarters - Mental (Psychiatric) hospitals or wards (%)
People in Group quarters - Schools, hospitals, or wards for the mentally retarded (%)
People in Group quarters - Schools, hospitals, or wards for the physically handicapped (%)
People in Group quarters - Institutions for the deaf (%)
People in Group quarters - Institutions for the blind (%)
People in Group quarters - Orthopedic wards and institutions for the physically handicapped (%)
People in Group quarters - Wards in general hospitals for patients who have no usual home elsewhere (%)
People in Group quarters - Wards in military hospitals for patients who have no usual home elsewhere (%)
People in Group quarters - Juvenile institutions (%)
People in Group quarters - Long-term care (%)
People in Group quarters - Homes for abused, dependent, and neglected children (%)
People in Group quarters - Residential treatment centers for emotionally disturbed children (%)
People in Group quarters - Training schools for juvenile delinquents (%)
People in Group quarters - Short-term care, detention or diagnostic centers for delinquent children (%)
People in Group quarters - Type of juvenile institution unknown (%)
People in Group quarters - Noninstitutionalized population (%)
People in Group quarters - College dormitories (includes college quarters off campus) (%)
People in Group quarters - Military quarters (%)
People in Group quarters - On base (%)
People in Group quarters - Barracks, unaccompanied personnel housing (UPH), (Enlisted/Officer), ;and similar group living quarters for military personnel (%)
People in Group quarters - Transient quarters for temporary residents (%)
People in Group quarters - Military ships (%)
People in Group quarters - Group homes (%)
People in Group quarters - Homes or halfway houses for drug/alcohol abuse (%)
People in Group quarters - Homes for the mentally ill (%)
People in Group quarters - Homes for the mentally retarded (%)
People in Group quarters - Homes for the physically handicapped (%)
People in Group quarters - Other group homes (%)
People in Group quarters - Religious group quarters (%)
People in Group quarters - Dormitories (%)
People in Group quarters - Agriculture workers' dormitories on farms (%)
People in Group quarters - Job Corps and vocational training facilities (%)
People in Group quarters - Other workers' dormitories (%)
People in Group quarters - Crews of maritime vessels (%)
People in Group quarters - Other nonhousehold living situations (%)
People in Group quarters - Other noninstitutional group quarters (%)
Residents speaking English at home (%)
Residents speaking English at home - Born in the United States (%)
Residents speaking English at home - Native, born elsewhere (%)
Residents speaking English at home - Foreign born (%)
Residents speaking Spanish at home (%)
Residents speaking Spanish at home - Born in the United States (%)
Residents speaking Spanish at home - Native, born elsewhere (%)
Residents speaking Spanish at home - Foreign born (%)
Residents speaking other language at home (%)
Residents speaking other language at home - Born in the United States (%)
Residents speaking other language at home - Native, born elsewhere (%)
Residents speaking other language at home - Foreign born (%)
Class of Workers - Employee of private company (%)
Class of Workers - Self-employed in own incorporated business (%)
Class of Workers - Private not-for-profit wage and salary workers (%)
Class of Workers - Local government workers (%)
Class of Workers - State government workers (%)
Class of Workers - Federal government workers (%)
Class of Workers - Self-employed workers in own not incorporated business and Unpaid family workers (%)
House heating fuel used in houses and condos - Utility gas (%)
House heating fuel used in houses and condos - Bottled, tank, or LP gas (%)
House heating fuel used in houses and condos - Electricity (%)
House heating fuel used in houses and condos - Fuel oil, kerosene, etc. (%)
House heating fuel used in houses and condos - Coal or coke (%)
House heating fuel used in houses and condos - Wood (%)
House heating fuel used in houses and condos - Solar energy (%)
House heating fuel used in houses and condos - Other fuel (%)
House heating fuel used in houses and condos - No fuel used (%)
House heating fuel used in apartments - Utility gas (%)
House heating fuel used in apartments - Bottled, tank, or LP gas (%)
House heating fuel used in apartments - Electricity (%)
House heating fuel used in apartments - Fuel oil, kerosene, etc. (%)
House heating fuel used in apartments - Coal or coke (%)
House heating fuel used in apartments - Wood (%)
House heating fuel used in apartments - Solar energy (%)
House heating fuel used in apartments - Other fuel (%)
House heating fuel used in apartments - No fuel used (%)
Armed forces status - In Armed Forces (%)
Armed forces status - Civilian (%)
Armed forces status - Civilian - Veteran (%)
Armed forces status - Civilian - Nonveteran (%)
Fatal accidents locations in years 2005-2021
Fatal accidents locations in 2005
Fatal accidents locations in 2006
Fatal accidents locations in 2007
Fatal accidents locations in 2008
Fatal accidents locations in 2009
Fatal accidents locations in 2010
Fatal accidents locations in 2011
Fatal accidents locations in 2012
Fatal accidents locations in 2013
Fatal accidents locations in 2014
Fatal accidents locations in 2015
Fatal accidents locations in 2016
Fatal accidents locations in 2017
Fatal accidents locations in 2018
Fatal accidents locations in 2019
Fatal accidents locations in 2020
Fatal accidents locations in 2021
Alcohol use - People drinking some alcohol every month (%)
Alcohol use - People not drinking at all (%)
Alcohol use - Average days/month drinking alcohol
Alcohol use - Average drinks/week
Alcohol use - Average days/year people drink much
Audiometry - Average condition of hearing (%)
Audiometry - People that can hear a whisper from across a quiet room (%)
Audiometry - People that can hear normal voice from across a quiet room (%)
Audiometry - Ears ringing, roaring, buzzing (%)
Audiometry - Had a job exposure to loud noise (%)
Audiometry - Had off-work exposure to loud noise (%)
Blood Pressure & Cholesterol - Has high blood pressure (%)
Blood Pressure & Cholesterol - Checking blood pressure at home (%)
Blood Pressure & Cholesterol - Frequently checking blood cholesterol (%)
Blood Pressure & Cholesterol - Has high cholesterol level (%)
Consumer Behavior - Money monthly spent on food at supermarket/grocery store
Consumer Behavior - Money monthly spent on food at other stores
Consumer Behavior - Money monthly spent on eating out
Consumer Behavior - Money monthly spent on carryout/delivered foods
Consumer Behavior - Income spent on food at supermarket/grocery store (%)
Consumer Behavior - Income spent on food at other stores (%)
Consumer Behavior - Income spent on eating out (%)
Consumer Behavior - Income spent on carryout/delivered foods (%)
Current Health Status - General health condition (%)
Current Health Status - Blood donors (%)
Current Health Status - Has blood ever tested for HIV virus (%)
Current Health Status - Left-handed people (%)
Dermatology - People using sunscreen (%)
Diabetes - Diabetics (%)
Diabetes - Had a blood test for high blood sugar (%)
Diabetes - People taking insulin (%)
Diet Behavior & Nutrition - Diet health (%)
Diet Behavior & Nutrition - Milk product consumption (# of products/month)
Diet Behavior & Nutrition - Meals not home prepared (#/week)
Diet Behavior & Nutrition - Meals from fast food or pizza place (#/week)
Diet Behavior & Nutrition - Ready-to-eat foods (#/month)
Diet Behavior & Nutrition - Frozen meals/pizza (#/month)
Drug Use - People that ever used marijuana or hashish (%)
Drug Use - Ever used hard drugs (%)
Drug Use - Ever used any form of cocaine (%)
Drug Use - Ever used heroin (%)
Drug Use - Ever used methamphetamine (%)
Health Insurance - People covered by health insurance (%)
Kidney Conditions-Urology - Avg. # of times urinating at night
Medical Conditions - People with asthma (%)
Medical Conditions - People with anemia (%)
Medical Conditions - People with psoriasis (%)
Medical Conditions - People with overweight (%)
Medical Conditions - Elderly people having difficulties in thinking or remembering (%)
Medical Conditions - People who ever received blood transfusion (%)
Medical Conditions - People having trouble seeing even with glass/contacts (%)
Medical Conditions - People with arthritis (%)
Medical Conditions - People with gout (%)
Medical Conditions - People with congestive heart failure (%)
Medical Conditions - People with coronary heart disease (%)
Medical Conditions - People with angina pectoris (%)
Medical Conditions - People who ever had heart attack (%)
Medical Conditions - People who ever had stroke (%)
Medical Conditions - People with emphysema (%)
Medical Conditions - People with thyroid problem (%)
Medical Conditions - People with chronic bronchitis (%)
Medical Conditions - People with any liver condition (%)
Medical Conditions - People who ever had cancer or malignancy (%)
Mental Health - People who have little interest in doing things (%)
Mental Health - People feeling down, depressed, or hopeless (%)
Mental Health - People who have trouble sleeping or sleeping too much (%)
Mental Health - People feeling tired or having little energy (%)
Mental Health - People with poor appetite or overeating (%)
Mental Health - People feeling bad about themself (%)
Mental Health - People who have trouble concentrating on things (%)
Mental Health - People moving or speaking slowly or too fast (%)
Mental Health - People having thoughts they would be better off dead (%)
Oral Health - Average years since last visit a dentist
Oral Health - People embarrassed because of mouth (%)
Oral Health - People with gum disease (%)
Oral Health - General health of teeth and gums (%)
Oral Health - Average days a week using dental floss/device
Oral Health - Average days a week using mouthwash for dental problem
Oral Health - Average number of teeth
Pesticide Use - Households using pesticides to control insects (%)
Pesticide Use - Households using pesticides to kill weeds (%)
Physical Activity - People doing vigorous-intensity work activities (%)
Physical Activity - People doing moderate-intensity work activities (%)
Physical Activity - People walking or bicycling (%)
Physical Activity - People doing vigorous-intensity recreational activities (%)
Physical Activity - People doing moderate-intensity recreational activities (%)
Physical Activity - Average hours a day doing sedentary activities
Physical Activity - Average hours a day watching TV or videos
Physical Activity - Average hours a day using computer
Physical Functioning - People having limitations keeping them from working (%)
Physical Functioning - People limited in amount of work they can do (%)
Physical Functioning - People that need special equipment to walk (%)
Physical Functioning - People experiencing confusion/memory problems (%)
Physical Functioning - People requiring special healthcare equipment (%)
Prescription Medications - Average number of prescription medicines taking
Preventive Aspirin Use - Adults 40+ taking low-dose aspirin (%)
Reproductive Health - Vaginal deliveries (%)
Reproductive Health - Cesarean deliveries (%)
Reproductive Health - Deliveries resulted in a live birth (%)
Reproductive Health - Pregnancies resulted in a delivery (%)
Reproductive Health - Women breastfeeding newborns (%)
Reproductive Health - Women that had a hysterectomy (%)
Reproductive Health - Women that had both ovaries removed (%)
Reproductive Health - Women that have ever taken birth control pills (%)
Reproductive Health - Women taking birth control pills (%)
Reproductive Health - Women that have ever used Depo-Provera or injectables (%)
Reproductive Health - Women that have ever used female hormones (%)
Sexual Behavior - People 18+ that ever had sex (vaginal, anal, or oral) (%)
Sexual Behavior - Males 18+ that ever had vaginal sex with a woman (%)
Sexual Behavior - Males 18+ that ever performed oral sex on a woman (%)
Sexual Behavior - Males 18+ that ever had anal sex with a woman (%)
Sexual Behavior - Males 18+ that ever had any sex with a man (%)
Sexual Behavior - Females 18+ that ever had vaginal sex with a man (%)
Sexual Behavior - Females 18+ that ever performed oral sex on a man (%)
Sexual Behavior - Females 18+ that ever had anal sex with a man (%)
Sexual Behavior - Females 18+ that ever had any kind of sex with a woman (%)
Sexual Behavior - Average age people first had sex
Sexual Behavior - Average number of female sex partners in lifetime (males 18+)
Sexual Behavior - Average number of female vaginal sex partners in lifetime (males 18+)
Sexual Behavior - Average age people first performed oral sex on a woman (18+)
Sexual Behavior - Average number of woman performed oral sex on in lifetime (18+)
Sexual Behavior - Average number of male sex partners in lifetime (males 18+)
Sexual Behavior - Average number of male anal sex partners in lifetime (males 18+)
Sexual Behavior - Average age people first performed oral sex on a man (18+)
Sexual Behavior - Average number of male oral sex partners in lifetime (18+)
Sexual Behavior - People using protection when performing oral sex (%)
Sexual Behavior - Average number of times people have vaginal or anal sex a year
Sexual Behavior - People having sex without condom (%)
Sexual Behavior - Average number of male sex partners in lifetime (females 18+)
Sexual Behavior - Average number of male vaginal sex partners in lifetime (females 18+)
Sexual Behavior - Average number of female sex partners in lifetime (females 18+)
Sexual Behavior - Circumcised males 18+ (%)
Sleep Disorders - Average hours sleeping at night
Sleep Disorders - People that has trouble sleeping (%)
Smoking-Cigarette Use - People smoking cigarettes (%)
Taste & Smell - People 40+ having problems with smell (%)
Taste & Smell - People 40+ having problems with taste (%)
Taste & Smell - People 40+ that ever had wisdom teeth removed (%)
Taste & Smell - People 40+ that ever had tonsils teeth removed (%)
Taste & Smell - People 40+ that ever had a loss of consciousness because of a head injury (%)
Taste & Smell - People 40+ that ever had a broken nose or other serious injury to face or skull (%)
Taste & Smell - People 40+ that ever had two or more sinus infections (%)
Weight - Average height (inches)
Weight - Average weight (pounds)
Weight - Average BMI
Weight - People that are obese (%)
Weight - People that ever were obese (%)
Weight - People trying to lose weight (%)
Urban population: 23,606
Rural population: 7,765
Estimated median house/condo value in 2022: $188,441
33917:
$188,441Florida:
$354,100
Median resident age: This zip code:
61.4 yearsFlorida median age:
42.7 years
Average household size: This zip code:
2.1 peopleFlorida:
2.5 people
Averages for the 2020 tax year for zip code 33917, filed in 2021:
Average Adjusted Gross Income (AGI) in 2020: $54,823 (Individual Income Tax Returns) Here:
$54,823State:
$82,200
Salary/wage: $43,488 (reported on 64.8% of returns )Here:
$43,488State:
$58,347
(% of AGI for various income ranges: 999.3% for AGIs below $25k , 3098.0% for AGIs $25k-50k , 5362.2% for AGIs $50k-75k , 6959.3% for AGIs $75k-100k , 12608.2% for AGIs $100k-200k , 57321.8% for AGIs over 200k ) Taxable interest for individuals: $2,001 (reported on 32.4% of returns )This zip code:
$2,001Florida:
$4,272
(% of AGI for various income ranges: 25.2% for AGIs below $25k , 33.4% for AGIs $25k-50k , 102.2% for AGIs $50k-75k , 133.0% for AGIs $75k-100k , 352.9% for AGIs $100k-200k , 2250.9% for AGIs over 200k ) Ordinary dividends: $7,019 (reported on 21.7% of returns )(% of AGI for various income ranges: 39.8% for AGIs below $25k , 58.6% for AGIs $25k-50k , 202.6% for AGIs $50k-75k , 320.7% for AGIs $75k-100k , 775.2% for AGIs $100k-200k , 7337.3% for AGIs over 200k ) Net capital gain/loss in AGI: +$14,332 (reported on 19.9% of returns )Here:
+$14,332State:
+$62,983
(% of AGI for various income ranges: 7.9% for AGIs below $25k , 43.3% for AGIs $25k-50k , 204.4% for AGIs $50k-75k , 252.9% for AGIs $75k-100k , 1367.4% for AGIs $100k-200k , 22915.5% for AGIs over 200k ) Profit/loss from business: +$9,358 (reported on 14.4% of returns )Here:
+$9,358State:
+$9,719
(% of AGI for various income ranges: 167.5% for AGIs below $25k , 106.1% for AGIs $25k-50k , 200.7% for AGIs $50k-75k , 252.7% for AGIs $75k-100k , 421.8% for AGIs $100k-200k , 2147.3% for AGIs over 200k ) Taxable individual retirement arrangement distribution: $19,189 (reported on 17.6% of returns )33917:
$19,189Florida:
$24,823
(% of AGI for various income ranges: 111.3% for AGIs below $25k , 222.3% for AGIs $25k-50k , 500.2% for AGIs $50k-75k , 1013.6% for AGIs $75k-100k , 2077.9% for AGIs $100k-200k , 7493.6% for AGIs over 200k ) Total itemized deductions: $32,794 (reported on 4.6% of returns )Here:
$32,794State:
$45,393
(% of AGI for various income ranges: 50.3% for AGIs below $25k , 95.9% for AGIs $25k-50k , 262.4% for AGIs $50k-75k , 360.4% for AGIs $75k-100k , 708.6% for AGIs $100k-200k , 5174.5% for AGIs over 200k ) Charity contributions: $7,656 (reported on 3.6% of returns )(% of AGI for various income ranges: 3.1% for AGIs below $25k , 12.2% for AGIs $25k-50k , 36.3% for AGIs $50k-75k , 58.8% for AGIs $75k-100k , 193.5% for AGIs $100k-200k , 1084.5% for AGIs over 200k ) Taxes paid: $5,975 (reported on 4.4% of returns )(% of AGI for various income ranges: 6.6% for AGIs below $25k , 15.2% for AGIs $25k-50k , 39.2% for AGIs $50k-75k , 70.3% for AGIs $75k-100k , 140.8% for AGIs $100k-200k , 922.7% for AGIs over 200k ) Earned income credit: $2,066 (reported on 16.5% of returns )(% of AGI for various income ranges: 89.8% for AGIs below $25k , 49.0% for AGIs $25k-50k , 1.2% for AGIs $50k-75k ) Percentage of individuals using paid preparers for their 2020 taxes: 91.0%(% for various income ranges: 89.8% for AGIs below $25k , 92.0% for AGIs $25k-50k , 92.2% for AGIs $50k-75k , 90.9% for AGIs $75k-100k , 90.6% for AGIs $100k-200k , 95.2% for AGIs over 200k )
Averages for the 2012 tax year for zip code 33917, filed in 2013:
Average Adjusted Gross Income (AGI) in 2012: $44,262 (Individual Income Tax Returns) Here:
$44,262State:
$60,316
Salary/wage: $33,215 (reported on 64.2% of returns )Here:
$33,215State:
$45,277
(% of AGI for various income ranges: 57.0% for AGIs below $25k , 59.0% for AGIs $25k-50k , 49.5% for AGIs $50k-75k , 45.1% for AGIs $75k-100k , 44.5% for AGIs $100k-200k , 29.0% for AGIs over 200k ) Taxable interest for individuals: $1,988 (reported on 38.1% of returns )This zip code:
$1,988Florida:
$3,587
(% of AGI for various income ranges: 2.5% for AGIs below $25k , 1.6% for AGIs $25k-50k , 1.5% for AGIs $50k-75k , 1.6% for AGIs $75k-100k , 1.4% for AGIs $100k-200k , 2.1% for AGIs over 200k ) Ordinary dividends: $5,854 (reported on 25.3% of returns )(% of AGI for various income ranges: 3.3% for AGIs below $25k , 2.8% for AGIs $25k-50k , 2.2% for AGIs $50k-75k , 2.5% for AGIs $75k-100k , 3.5% for AGIs $100k-200k , 6.7% for AGIs over 200k ) Net capital gain/loss in AGI: +$5,709 (reported on 21.1% of returns )Here:
+$5,709State:
+$33,493
(% of AGI for various income ranges: 0.4% for AGIs $25k-50k , 0.7% for AGIs $50k-75k , 1.4% for AGIs $75k-100k , 2.6% for AGIs $100k-200k , 14.9% for AGIs over 200k ) Profit/loss from business: +$9,237 (reported on 13.4% of returns )Here:
+$9,237State:
+$10,012
(% of AGI for various income ranges: 8.5% for AGIs below $25k , 2.8% for AGIs $25k-50k , 1.6% for AGIs $50k-75k , 1.5% for AGIs $75k-100k , 1.7% for AGIs $100k-200k , 1.7% for AGIs over 200k ) Taxable individual retirement arrangement distribution: $15,169 (reported on 21.7% of returns )33917:
$15,169Florida:
$21,544
(% of AGI for various income ranges: 6.7% for AGIs below $25k , 6.0% for AGIs $25k-50k , 7.0% for AGIs $50k-75k , 8.7% for AGIs $75k-100k , 9.1% for AGIs $100k-200k , 6.9% for AGIs over 200k ) Self-employment retirement plans: $14,150 (reported on 0.2% of returns )33917:
$14,150Florida:
$20,611
Total itemized deductions: $19,860 (23% of AGI, reported on 21.2% of returns )Here:
$19,860State:
$25,533
Here:
23.3% of AGIState:
18.0% of AGI
(% of AGI for various income ranges: 8.7% for AGIs below $25k , 9.1% for AGIs $25k-50k , 9.7% for AGIs $50k-75k , 9.8% for AGIs $75k-100k , 10.8% for AGIs $100k-200k , 8.0% for AGIs over 200k ) Charity contributions: $3,681 (reported on 16.6% of returns )(% of AGI for various income ranges: 0.7% for AGIs below $25k , 0.9% for AGIs $25k-50k , 1.3% for AGIs $50k-75k , 1.5% for AGIs $75k-100k , 1.9% for AGIs $100k-200k , 2.1% for AGIs over 200k ) Taxes paid: $4,693 (reported on 20.6% of returns )(% of AGI for various income ranges: 1.4% for AGIs below $25k , 1.7% for AGIs $25k-50k , 1.9% for AGIs $50k-75k , 2.5% for AGIs $75k-100k , 2.7% for AGIs $100k-200k , 2.9% for AGIs over 200k ) Earned income credit: $2,173 (reported on 18.1% of returns )(% of AGI for various income ranges: 5.7% for AGIs below $25k , 0.7% for AGIs $25k-50k ) Percentage of individuals using paid preparers for their 2012 taxes: 50.3%(% for various income ranges: 46.9% for AGIs below $25k , 49.2% for AGIs $25k-50k , 52.6% for AGIs $50k-75k , 53.3% for AGIs $75k-100k , 62.7% for AGIs $100k-200k , 87.5% for AGIs over 200k )
Averages for the 2004 tax year for zip code 33917, filed in 2005:
Average Adjusted Gross Income (AGI) in 2004: $39,755 (Individual Income Tax Returns) Here:
$39,755State:
$50,523
Salary/wage: $30,311 (reported on 70.4% of returns )Here:
$30,311State:
$39,563
(% of AGI for various income ranges: 93.3% for AGIs below $10k , 61.2% for AGIs $10k-25k , 63.2% for AGIs $25k-50k , 57.7% for AGIs $50k-75k , 56.8% for AGIs $75k-100k , 36.1% for AGIs over 100k ) Taxable interest for individuals: $2,261 (reported on 49.2% of returns )This zip code:
$2,261Florida:
$3,211
(% of AGI for various income ranges: 10.3% for AGIs below $10k , 3.9% for AGIs $10k-25k , 2.7% for AGIs $25k-50k , 2.7% for AGIs $50k-75k , 2.6% for AGIs $75k-100k , 2.1% for AGIs over 100k ) Taxable dividends: $3,121 (reported on 29.3% of returns )(% of AGI for various income ranges: 7.6% for AGIs below $10k , 2.9% for AGIs $10k-25k , 2.0% for AGIs $25k-50k , 2.3% for AGIs $50k-75k , 2.6% for AGIs $75k-100k , 1.8% for AGIs over 100k ) Net capital gain/loss: +$10,300 (reported on 24.8% of returns )Here:
+$10,300State:
+$27,205
(% of AGI for various income ranges: -5.7% for AGIs below $10k , 0.2% for AGIs $10k-25k , 1.2% for AGIs $25k-50k , 2.5% for AGIs $50k-75k , 4.3% for AGIs $75k-100k , 17.7% for AGIs over 100k ) Profit/loss from business: +$8,469 (reported on 12.8% of returns )Here:
+$8,469State:
+$10,634
(% of AGI for various income ranges: 4.5% for AGIs below $10k , 4.6% for AGIs $10k-25k , 2.3% for AGIs $25k-50k , 2.5% for AGIs $50k-75k , 2.6% for AGIs $75k-100k , 2.2% for AGIs over 100k ) IRA payment deduction: $3,105 (reported on 2.4% of returns )33917:
$3,105Florida:
$3,082
(% of AGI for various income ranges: 0.3% for AGIs below $10k , 0.2% for AGIs $10k-25k , 0.2% for AGIs $25k-50k , 0.2% for AGIs $50k-75k , 0.2% for AGIs $75k-100k , 0.1% for AGIs over 100k ) Self-employed pension: $7,103 (reported on 0.2% of returns )Here:
$7,103Florida:
$15,857
Total itemized deductions: $16,623 (23% of AGI, reported on 25.0% of returns )Here:
$16,623State:
$20,370
Here:
22.7% of AGIState:
20.7% of AGI
(% of AGI for various income ranges: 19.2% for AGIs below $10k , 10.5% for AGIs $10k-25k , 10.8% for AGIs $25k-50k , 11.6% for AGIs $50k-75k , 11.7% for AGIs $75k-100k , 8.3% for AGIs over 100k ) Charity contributions deductions: $2,917 (4% of AGI, reported on 20.1% of returns )Here:
3.7% of AGIState:
3.8% of AGI
(% of AGI for various income ranges: 0.9% for AGIs below $10k , 1.0% for AGIs $10k-25k , 1.2% for AGIs $25k-50k , 1.5% for AGIs $50k-75k , 1.8% for AGIs $75k-100k , 1.8% for AGIs over 100k ) Total tax: $6,039 (reported on 73.7% of returns )(% of AGI for various income ranges: 2.9% for AGIs below $10k , 3.7% for AGIs $10k-25k , 6.9% for AGIs $25k-50k , 9.3% for AGIs $50k-75k , 11.0% for AGIs $75k-100k , 19.9% for AGIs over 100k ) Earned income credit: $1,653 (reported on 15.1% of returns )Percentage of individuals using paid preparers for their 2004 taxes: 59.9%(% for various income ranges: 54.9% for AGIs below $10k , 60.1% for AGIs $10k-25k , 60.2% for AGIs $25k-50k , 60.5% for AGIs $50k-75k , 61.1% for AGIs $75k-100k , 71.6% for AGIs over 100k )
Estimated median household income in 2022: This zip code:
$52,112Florida:
$69,303
Nearest zip codes: 33903 ,
33916 ,
33905 ,
33909 ,
33901 ,
33966 .
North Fort Myers Zip Code Map
Percentage of family households: This zip code:
26.1%Florida:
41.2%
Percentage of households with unmarried partners: This zip code:
6.6%Florida:
46.7%
Likely homosexual households (counted as self-reported same-sex unmarried-partner households)
Lesbian couples: 0.2% of all households Gay men: 0.0% of all households
Household received Food Stamps/SNAP in the past 12 months: 1,347Household did not receive Food Stamps/SNAP in the past 12 months: 13,887
Women who had a birth in the past 12 months: 177 (158 now married , 24 unmarried) Women who did not have a birth in the past 12 months: 3,735 (1,629 now married , 2,106 unmarried)
Housing units in zip code 33917 with a mortgage: 4,240 (318
second mortgage , 44
home equity loan , 259
both second mortgage and home equity loan )
Houses without a mortgage: 50
Median monthly owner costs for units with a mortgage: $1,417
Median monthly owner costs for units without a mortgage: $477
Residents with income below the poverty level in 2022:
This zip code:
15.6%Whole state:
12.7%
Residents with income below 50% of the poverty level in 2022:
This zip code:
7.9%Whole state:
6.6%
Median number of rooms in houses and condos: Median number of rooms in apartments: Notable locations in this zip code not listed on our city pages
Click to draw/clear zip code borders Notable locations in zip code 33917: (A) , Palmetto - Pine Country Club (B) , North Fort Myers Fire Control and Rescue Service District Station 1 (C) , Bayshore Fire and Rescue (D) , North Fort Myers Fire Control District Station 4 (E) , Lee County Emergency Medical Services (F) , North Fort Myers Fire Control District Station 3 (G) , Lee County Sheriff's Posse (H) , Lee Civic Center (I) . Display/hide their locations on the map
Churches in zip code 33917 include: (A) , Korean Presbyterian Church (B) , Church of the Golden Keys (C) , Calvary Baptist Chapel (D) , Apostolic Christian Church (E) , All Saints Byzantine Catholic Church (F) , Open Bible Community Church (G) , Church of the Nazarene North (H) , Prince of Peace Lutheran Church (I) . Display/hide their locations on the map
Cemetery: (1) . Display/hide its location on the map
Creeks: (A) , Popash Creek (B) , Daughtrey Creek (C) , Stroud Creek (D) . Display/hide their locations on the map
Park in zip code 33917: (1) . Display/hide its location on the map
Year house built (houses)
234 2020 or later929 2010 to 20192,734 2000 to 20092,937 1990 to 19995,156 1980 to 19894,121 1970 to 19791,229 1960 to 1969800 1950 to 195998 1940 to 194960 1939 or earlier
Zip code 33917 household income distribution in 2022 1,562 Less than $10,000880 $10,000 to $14,999881 $15,000 to $19,999577 $20,000 to $24,999582 $25,000 to $29,999598 $30,000 to $34,999889 $35,000 to $39,999669 $40,000 to $44,999686 $45,000 to $49,9991,027 $50,000 to $59,9991,625 $60,000 to $74,9992,058 $75,000 to $99,9991,035 $100,000 to $124,999684 $125,000 to $149,999734 $150,000 to $199,999642 $200,000 or moreEstimate of home value of owner-occupied houses/condos in 2022 in zip code 33917 305 Less than $10,000142 $10,000 to $14,999177 $15,000 to $19,999170 $20,000 to $24,999322 $25,000 to $29,999253 $30,000 to $34,999128 $35,000 to $39,999425 $40,000 to $49,999247 $50,000 to $59,999729 $60,000 to $69,999336 $70,000 to $79,999387 $80,000 to $89,999448 $90,000 to $99,999665 $100,000 to $124,999204 $125,000 to $149,999679 $150,000 to $174,999235 $175,000 to $199,999760 $200,000 to $249,999939 $250,000 to $299,9991,714 $300,000 to $399,999738 $400,000 to $499,9991,030 $500,000 to $749,999152 $750,000 to $999,99978 $1,000,000 to $1,499,99916 $1,500,000 to $1,999,99959 $2,000,000 or moreRent paid by renters in 2022 in zip code 33917 38 Less than $10078 $250 to $29919 $300 to $3499 $350 to $39931 $450 to $49944 $500 to $54957 $550 to $59942 $600 to $64933 $650 to $699187 $700 to $74950 $750 to $799409 $800 to $899126 $900 to $999471 $1,000 to $1,249219 $1,250 to $1,499238 $1,500 to $1,99958 $2,000 to $2,49940 $2,500 to $2,999143 No cash rent
Median gross rent in 2022: $1,204.
Median price asked for vacant for-sale houses and condos in 2022: $311,836.
Estimated median house (or condo) value in 2022 for: White Non-Hispanic householders: $361,234Black or African American householders: $183,114American Indian or Alaska Native householders: $592,957Asian householders: $749,104Some other race householders: $128,845Two or more races householders: $266,348Hispanic or Latino householders: $341,591Estimated median house or condo value in 2022: $188,441
33917:
$188,441Florida:
$354,100
Lower value quartile - upper value quartile: $85,614 - $348,089
Mean price in 2022: Detached houses: $380,260Here:
$380,260State:
$500,941
Townhouses or other attached units: $249,517Here:
$249,517State:
$370,869
In 2-unit structures: $222,555Here:
$222,555State:
$423,188
In 3-to-4-unit structures: $172,906Here:
$172,906State:
$309,944
In 5-or-more-unit structures: $172,600Here:
$172,600State:
$447,145
Mobile homes: $85,635Here:
$85,635State:
$113,202
Occupied boats, RVs, vans, etc.: $56,321Here:
$56,321State:
$73,933
Housing units in structures:
One, detached: 8,458One, attached: 398Two: 1743 or 4: 2105 to 9: 48710 to 19: 23720 to 49: 19150 or more: 24Mobile homes: 8,509Boats, RVs, vans, etc.: 165Unemployment : 3.4%
Means of transportation to work in zip code 33917 69.8% 8,426 Drove a car alone10.7% 1,291 Carpooled0.0% 1 Bus or trolley bus1.1% 134 Taxi2.0% 244 Bicycle0.5% 55 Walked2.6% 320 Other means12.3% 1,485 Worked at homeTravel time to work (commute) in zip code 33917 330 Less than 5 minutes172 5 to 9 minutes1,201 10 to 14 minutes1,395 15 to 19 minutes2,001 20 to 24 minutes798 25 to 29 minutes2,042 30 to 34 minutes429 35 to 39 minutes466 40 to 44 minutes1,029 45 to 59 minutes353 60 to 89 minutes220 90 or more minutes
Neighborhoods in zip code 33917: Percentage of zip code residents living and working in this county: 94.1%
Household type by relationship:
Households: 31,372
Male householders: 7,429 (2,053 living alone ), Female householders: 7,771 (3,342 living alone )7,442 spouses (7,250 opposite-sex spouses ), 951 unmarried partners , (894 opposite-sex unmarried partners ), 5,174 children (4,770 natural , 179 adopted , 227 stepchildren ), 470 grandchildren , 319 brothers or sisters , 501 parents , 35 foster children , 502 other relatives , 934 non-relatives In group quarters: 117 (-1 institutionalized population )
Size of family households: 6,122 2-persons , 1,418 3-persons , 836 4-persons , 245 5-persons , 89 6-persons , 54 7-or-more-persons
Size of nonfamily households: 5,399 1-person , 890 2-persons , 117 3-persons , 13 4-persons
1,874 married couples with children. single-parent households (279 men , 687 women ).
90.3% of residents of 33917 zip code speak English at home. of residents speak Spanish at home (69% very well, 11% well, 9% not well, 11% not at all ).of residents speak other Indo-European language at home (70% very well, 19% well, 11% not well ).of residents speak Asian or Pacific Island language at home (17% very well, 78% well, 5% not well ).of residents speak other language at home (71% very well, 29% well ).
Foreign born population: 2,557 (8.2%)
(44.9%
of them are naturalized citizens )
This zip code:
8.2%Whole state:
21.7%
15% Barbados 7% Bolivia 6% Honduras 4% Guatemala 4% France 4% Belize 3% Croatia 18% German 16% American 11% English 11% Irish 9% Italian 2% Canadian 2% Polish
Year of entry for the foreign-born population
1,006 2010 or later 669 2000 to 2009 443 1990 to 1999 1,068 Before 1990
Major facilities with environmental interests located in this zip code:
GULF COAST AUTO REPAIR (26 CARDINAL DR in NORTH FORT MYERS, FL)
STATE MASTER (FDM) - CHAZ-FLD069676336, HAZARDOUS WASTE REGULATION PROGRAM (Resource Conservation and Recovery Act (tracking hazardous waste)) Business SIC classification: GENERAL AUTOMOTIVE REPAIR SHOPSBusiness NAICS classification: GENERAL AUTOMOTIVE REPAIR.Organizations: NON NOTIFIER (CONTACT/OWNER)
Alternative names: ALS RADIATOR
NORTH FT. MYERS ACADEMY FOR THE ARTS - K-8 (FORMER (1856 SUNCOAST LANE, N.E. in NORTH FT. MYERS, FL)
(National Center for Education Statistics) - STATE ID-0601 Organizations: LEE COUNTY SCHOOL DISTRICT (SCHOOL DISTRICT)
CIRCLE K #7262 (2171 LAUREL LANE in FORT MYERS, FL)
National Pollutant Discharge Elimination System NON-MAJOR (Tracking pollutant discharge elimination systems) - permit (Resource Conservation and Recovery Act (tracking hazardous waste)) Business SIC classification: GASOLINE SERVICE STATIONSOrganizations: STEVE BELIN, COMPLIANCE MGR (CONTACT/OWNER)
HERONS GLEN - SALES CENTER (APPRX 11, 306FT E OF US 41ON A in NORTH FORT MYERS, FL)
National Pollutant Discharge Elimination System NON-MAJOR (Tracking pollutant discharge elimination systems) - permit Organizations: DOUG CORDELLO (CONTACT/OWNER)
MERCANTILE COMMERCE CENTER (7995 MERCANTILE in N FT MYERS, FL)
National Pollutant Discharge Elimination System NON-MAJOR (Tracking pollutant discharge elimination systems) - permit Organizations: PAUL KRACKHARDT (CONTACT/OWNER)
HERONS GLEN - UNIT 13 (HERONS GLEN SUBDIVISION CORNER in NORTH FORT MYERS, FL)
National Pollutant Discharge Elimination System NON-MAJOR (Tracking pollutant discharge elimination systems) - permit Organizations: JIM TRAXINGER (CONTACT/OWNER)
HERONS GLEN - UNITS 11, 12 & 1 (APPROX 11,306 FT E OF US 41ON in NORTH FT MYERS, FL)
National Pollutant Discharge Elimination System NON-MAJOR (Tracking pollutant discharge elimination systems) - permit Organizations: DOUG CORDELLO (CONTACT/OWNER)
PHASE 2 HERONS GLEN CONSTRUCTI (APPROX. 3600' S OF AVENIDA DEL in NORTH FORT MYERS, FL)
National Pollutant Discharge Elimination System NON-MAJOR (Tracking pollutant discharge elimination systems) - permit Organizations: DOUG CORDELLO (CONTACT/OWNER)
MELLOW ESTATES (6031 MELLOW DR in N FORT MYERS, FL)
National Pollutant Discharge Elimination System NON-MAJOR (Tracking pollutant discharge elimination systems) - permit Organizations: VINCENT HONC (CONTACT/OWNER)
ADCO EQUIPMENT CORP (18931 SR 31 in NORTH FORT MYERS, FL)
(Resource Conservation and Recovery Act (tracking hazardous waste)) Business NAICS classification: FARM MACHINERY AND EQUIPMENT MANUFACTURING.Organizations: ALBERT COLE (CONTACT/OWNER)
APM AUTOMOTIVE (17490 EAST ST in NORTH FORT MYERS, FL)
(Resource Conservation and Recovery Act (tracking hazardous waste)) Business NAICS classification: ALL OTHER MOTOR VEHICLE PARTS MANUFACTURING.Organizations: PAUL HUTCHINS (CONTACT/OWNER)
ADAMS TANK & LIFT INC (17460 D EAST ST in NORTH FORT MYERS, FL)
(Resource Conservation and Recovery Act (tracking hazardous waste)) Business NAICS classification: MILITARY ARMORED VEHICLE, TANK, AND TANK COMPONENT MANUFACTURING.
Housing units lacking complete plumbing facilities: 1.6%
Housing units lacking complete kitchen facilities: 0.6%
95.5% Electricity 2.3% No fuel used 1.7% Utility gas
Population in 1990: 24,751. Population change in the 1990s: +3,810 (+15.4%).
Place of birth for U.S.-born residents:
This state: 7,989Northeast: 6,860Midwest: 8,390South: 3,812West: 1,033
57% of the 33917 zip code residents lived in the same house 5 years ago.
Out of people who lived in different houses, 53% lived in this county.
Out of people who lived in different counties, 50% lived in Florida.
85% of the 33917 zip code residents lived in the same house 1 year ago.
Out of people who lived in different houses, 44% moved from this county.
Out of people who lived in different houses, 11% moved from different county within same state.
Out of people who lived in different houses, 42% moved from different state.
Out of people who lived in different houses, 3% moved from abroad.
Private vs. public school enrollment:
Students in private schools in grades 1 to 8 (elementary and middle school): 168
Students in private schools in grades 9 to 12 (high school): 171
Students in private undergraduate colleges: 112
Occupation by median earnings in the past 12 months ($)
83,840 Farming, fishing, and forestry occupations 78,787 Computer and mathematical occupations 69,389 Fire fighting and prevention, and other protective service workers including supervisors 65,838 Legal occupations 65,278 Management occupations 56,199 Business and financial operations occupations
Companies with federal contracts located in this zip code:
MCCLURE, HARVEY & BARBARA (251 LANTERN LN in FORT MYERS, FL; small business)
$3,835 with Army for Facilities Operations Support Services. Taking place in CT. Signed on 2006-02-09. Completion date: 2006-09-10.
BEAL SIGN SERVICE (10201 BEAL LANE in NORTH FORT MYE, FL; small business) in 3 contracts from 2000 to 2002
$1,425 with U.S. Army Corps of Engineers - civil program financing only for Signs, Advertising Displays, and Identification Plates. Signed on 2002-01-28. Completion date: 2003-10-01.
, same as above. Signed on 2000-11-08. Completion date: 2003-10-01.
, same as above. Signed on 2000-11-08. Completion date: 2003-10-01.
Top industries in this zip code by the number of employees in 2005:
Construction: New Single-Family Housing Construction (except Operative Builders) (250-499 employees: 1 establishment, 20-49 employees: 1 establishment, 5-9 employees: 1 establishment, 1-4 employees: 6 establishments)Utilities: Electric Power Distribution (250-499: 1, 10-19: 1)Construction: Poured Concrete Foundation and Structure Contractors (100-249: 1, 1-4: 7)Management of Companies and Enterprises: Corporate, Subsidiary, and Regional Managing Offices (100-249: 1)Construction: Plumbing, Heating, and Air-Conditioning Contractors (10-19: 6, 5-9: 3, 1-4: 10)Construction: Residential Remodelers (50-99: 1, 1-4: 9)Construction: All Other Specialty Trade Contractors (10-19: 4, 5-9: 1, 1-4: 6)Wholesale Trade: Book, Periodical, and Newspaper Merchant Wholesalers (50-99: 1)
People in group quarters in 2010:
63 people in nursing facilities/skilled-nursing facilities
12 people in group homes intended for adults
2 people in other noninstitutional facilities
People in group quarters in 2000:
63 people in homes for the mentally retarded
Fatal accident statistics in 2014:
Fatal accident count: 4Vehicles involved in fatal accidents: 6Fatal accidents caused by drunken drivers: 0Fatalities: 4Persons involved in fatal accidents: 15Pedestrians involved in fatal accidents: 2
Fatal accident statistics in 2013:
Fatal accident count: 2Vehicles involved in fatal accidents: 3Fatal accidents caused by drunken drivers: 0Fatalities: 2Persons involved in fatal accidents: 3Pedestrians involved in fatal accidents: 1
Home Mortgage Disclosure Act Aggregated Statistics For Year 2009(Based on 9 full and 6 partial tracts) A) FHA, FSA/RHS & VA B) Conventional C) Refinancings D) Home Improvement Loans F) Non-occupant Loans on G) Loans On Manufactured Number Average Value Number Average Value Number Average Value Number Average Value Number Average Value Number Average Value
LOANS ORIGINATED 49 $134,259 154 $122,644 264 $142,280 19 $66,878 121 $130,275 43 $82,481 APPLICATIONS APPROVED, NOT ACCEPTED 8 $189,801 13 $116,108 56 $166,610 5 $6,914 11 $187,812 5 $56,692 APPLICATIONS DENIED 18 $195,806 52 $79,034 245 $166,759 16 $57,931 46 $157,521 50 $90,442 APPLICATIONS WITHDRAWN 6 $128,193 19 $223,906 139 $189,191 8 $140,791 31 $243,170 9 $64,163 FILES CLOSED FOR INCOMPLETENESS 10 $166,078 6 $152,180 36 $149,861 0 $0 3 $154,840 2 $66,845
Aggregated Statistics For Year 2008(Based on 9 full and 6 partial tracts) A) FHA, FSA/RHS & VA B) Conventional C) Refinancings D) Home Improvement Loans F) Non-occupant Loans on G) Loans On Manufactured Number Average Value Number Average Value Number Average Value Number Average Value Number Average Value Number Average Value
LOANS ORIGINATED 41 $155,620 215 $159,052 291 $166,854 31 $80,586 105 $153,318 85 $69,564 APPLICATIONS APPROVED, NOT ACCEPTED 11 $154,374 83 $144,263 105 $141,536 16 $31,633 29 $164,320 64 $66,499 APPLICATIONS DENIED 25 $136,803 101 $125,277 378 $181,678 61 $65,329 49 $143,130 137 $77,236 APPLICATIONS WITHDRAWN 7 $111,626 36 $144,822 107 $193,126 3 $44,200 24 $174,755 26 $96,571 FILES CLOSED FOR INCOMPLETENESS 0 $0 10 $195,822 31 $205,482 5 $18,404 8 $134,612 0 $0
Aggregated Statistics For Year 2007(Based on 9 full and 6 partial tracts) A) FHA, FSA/RHS & VA B) Conventional C) Refinancings D) Home Improvement Loans E) Loans on Dwellings For 5+ Families F) Non-occupant Loans on G) Loans On Manufactured Number Average Value Number Average Value Number Average Value Number Average Value Number Average Value Number Average Value Number Average Value
LOANS ORIGINATED 23 $152,759 411 $183,718 676 $184,293 73 $107,189 0 $0 172 $181,477 187 $84,491 APPLICATIONS APPROVED, NOT ACCEPTED 6 $151,717 128 $158,673 174 $172,692 35 $73,559 0 $0 45 $173,174 93 $101,808 APPLICATIONS DENIED 14 $164,180 220 $151,239 576 $208,259 99 $66,297 2 $134,285 63 $206,534 192 $90,340 APPLICATIONS WITHDRAWN 2 $153,000 52 $182,765 212 $160,334 25 $183,579 2 $78,000 27 $187,790 13 $94,943 FILES CLOSED FOR INCOMPLETENESS 0 $0 34 $335,863 73 $199,583 2 $237,500 0 $0 6 $485,877 0 $0
Aggregated Statistics For Year 2006(Based on 9 full and 6 partial tracts) A) FHA, FSA/RHS & VA B) Conventional C) Refinancings D) Home Improvement Loans F) Non-occupant Loans on G) Loans On Manufactured Number Average Value Number Average Value Number Average Value Number Average Value Number Average Value Number Average Value
LOANS ORIGINATED 29 $103,095 817 $186,984 761 $190,518 129 $130,689 300 $208,318 225 $79,927 APPLICATIONS APPROVED, NOT ACCEPTED 2 $118,725 208 $184,989 178 $148,037 37 $97,469 49 $142,054 125 $74,659 APPLICATIONS DENIED 12 $100,339 357 $152,233 494 $185,883 121 $73,887 77 $134,597 251 $73,713 APPLICATIONS WITHDRAWN 10 $119,455 116 $175,424 281 $182,605 15 $115,198 50 $169,081 25 $108,088 FILES CLOSED FOR INCOMPLETENESS 2 $134,000 42 $229,427 96 $194,275 6 $295,373 8 $314,581 6 $94,193
Aggregated Statistics For Year 2005(Based on 9 full and 6 partial tracts) A) FHA, FSA/RHS & VA B) Conventional C) Refinancings D) Home Improvement Loans F) Non-occupant Loans on G) Loans On Manufactured Number Average Value Number Average Value Number Average Value Number Average Value Number Average Value Number Average Value
LOANS ORIGINATED 20 $96,587 1,093 $169,584 784 $166,639 130 $107,040 361 $176,690 321 $76,418 APPLICATIONS APPROVED, NOT ACCEPTED 7 $75,063 212 $136,767 171 $124,082 39 $67,659 72 $150,404 129 $73,144 APPLICATIONS DENIED 11 $126,747 407 $140,295 541 $157,336 141 $70,949 103 $121,267 265 $75,585 APPLICATIONS WITHDRAWN 4 $163,112 187 $178,372 345 $154,797 30 $131,110 67 $191,323 37 $113,490 FILES CLOSED FOR INCOMPLETENESS 0 $0 47 $196,033 144 $164,954 8 $71,769 12 $229,623 13 $109,572
Aggregated Statistics For Year 2004(Based on 9 full and 6 partial tracts) A) FHA, FSA/RHS & VA B) Conventional C) Refinancings D) Home Improvement Loans F) Non-occupant Loans on G) Loans On Manufactured Number Average Value Number Average Value Number Average Value Number Average Value Number Average Value Number Average Value
LOANS ORIGINATED 25 $85,815 1,112 $148,391 708 $127,630 106 $53,894 386 $168,529 337 $59,677 APPLICATIONS APPROVED, NOT ACCEPTED 6 $104,415 181 $90,466 188 $123,520 20 $19,378 78 $92,717 109 $60,376 APPLICATIONS DENIED 7 $103,509 337 $103,049 441 $104,395 132 $39,010 89 $97,757 264 $53,092 APPLICATIONS WITHDRAWN 5 $73,004 81 $136,190 238 $132,822 23 $80,064 27 $118,881 24 $110,983 FILES CLOSED FOR INCOMPLETENESS 0 $0 21 $120,108 194 $125,441 3 $32,600 8 $121,574 34 $86,172
Aggregated Statistics For Year 2003(Based on 9 full and 6 partial tracts) A) FHA, FSA/RHS & VA B) Conventional C) Refinancings D) Home Improvement Loans E) Loans on Dwellings For 5+ Families F) Non-occupant Loans on Number Average Value Number Average Value Number Average Value Number Average Value Number Average Value Number Average Value
LOANS ORIGINATED 39 $82,250 934 $120,567 1,577 $109,250 87 $27,056 2 $283,490 415 $103,864 APPLICATIONS APPROVED, NOT ACCEPTED 12 $95,425 116 $103,190 265 $96,908 24 $31,414 0 $0 23 $84,640 APPLICATIONS DENIED 21 $79,459 222 $91,622 563 $104,868 148 $24,814 0 $0 66 $84,040 APPLICATIONS WITHDRAWN 5 $75,112 68 $134,184 274 $104,292 8 $55,440 0 $0 25 $145,234 FILES CLOSED FOR INCOMPLETENESS 0 $0 30 $124,825 50 $111,791 4 $24,225 0 $0 2 $150,000
Aggregated Statistics For Year 2002(Based on 5 full and 6 partial tracts) A) FHA, FSA/RHS & VA B) Conventional C) Refinancings D) Home Improvement Loans E) Loans on Dwellings For 5+ Families F) Non-occupant Loans on Number Average Value Number Average Value Number Average Value Number Average Value Number Average Value Number Average Value
LOANS ORIGINATED 50 $88,364 447 $112,979 620 $102,016 69 $23,495 3 $98,700 129 $110,910 APPLICATIONS APPROVED, NOT ACCEPTED 2 $59,845 71 $82,300 94 $91,167 12 $30,996 0 $0 13 $72,612 APPLICATIONS DENIED 23 $85,786 171 $90,452 344 $81,189 91 $19,731 0 $0 41 $99,215 APPLICATIONS WITHDRAWN 9 $95,510 73 $113,552 143 $98,997 4 $16,112 0 $0 12 $90,084 FILES CLOSED FOR INCOMPLETENESS 4 $97,292 18 $138,714 50 $133,521 1 $9,630 0 $0 2 $75,475
Aggregated Statistics For Year 2001(Based on 5 full and 6 partial tracts) A) FHA, FSA/RHS & VA B) Conventional C) Refinancings D) Home Improvement Loans F) Non-occupant Loans on Number Average Value Number Average Value Number Average Value Number Average Value Number Average Value
LOANS ORIGINATED 83 $79,169 478 $86,725 540 $89,507 75 $24,895 98 $67,177 APPLICATIONS APPROVED, NOT ACCEPTED 3 $77,293 80 $61,739 82 $79,118 26 $41,861 17 $58,825 APPLICATIONS DENIED 14 $58,551 191 $65,270 391 $64,424 81 $14,531 29 $48,822 APPLICATIONS WITHDRAWN 6 $57,097 37 $99,561 188 $77,451 9 $31,934 5 $75,044 FILES CLOSED FOR INCOMPLETENESS 4 $64,618 16 $72,575 36 $71,717 2 $47,525 7 $67,639
Aggregated Statistics For Year 2000(Based on 5 full and 6 partial tracts) A) FHA, FSA/RHS & VA B) Conventional C) Refinancings D) Home Improvement Loans E) Loans on Dwellings For 5+ Families F) Non-occupant Loans on Number Average Value Number Average Value Number Average Value Number Average Value Number Average Value Number Average Value
LOANS ORIGINATED 56 $76,921 437 $73,760 191 $67,982 92 $17,676 2 $122,000 89 $53,679 APPLICATIONS APPROVED, NOT ACCEPTED 3 $55,773 66 $77,113 106 $50,301 33 $36,246 0 $0 15 $47,865 APPLICATIONS DENIED 18 $71,404 210 $52,829 293 $57,078 81 $16,920 0 $0 31 $46,083 APPLICATIONS WITHDRAWN 9 $69,820 35 $74,771 155 $59,605 7 $22,801 0 $0 15 $73,743 FILES CLOSED FOR INCOMPLETENESS 2 $144,020 13 $81,095 24 $55,115 1 $23,770 0 $0 4 $67,195
Aggregated Statistics For Year 1999(Based on 4 full and 3 partial tracts) A) FHA, FSA/RHS & VA B) Conventional C) Refinancings D) Home Improvement Loans F) Non-occupant Loans on Number Average Value Number Average Value Number Average Value Number Average Value Number Average Value
LOANS ORIGINATED 49 $77,283 409 $77,678 300 $73,670 69 $20,341 118 $78,335 APPLICATIONS APPROVED, NOT ACCEPTED 1 $114,090 85 $50,766 137 $62,370 24 $19,997 21 $49,244 APPLICATIONS DENIED 7 $69,634 236 $46,671 315 $56,144 55 $15,303 26 $60,644 APPLICATIONS WITHDRAWN 6 $77,735 35 $76,824 156 $67,456 15 $36,951 9 $76,841 FILES CLOSED FOR INCOMPLETENESS 4 $78,082 14 $61,301 23 $67,793 1 $29,480 2 $46,715
Private Mortgage Insurance Companies Aggregated Statistics For Year 2009(Based on 6 full and 4 partial tracts) A) Conventional B) Refinancings C) Non-occupant Loans on Number Average Value Number Average Value Number Average Value
LOANS ORIGINATED 5 $133,564 0 $0 0 $0 APPLICATIONS APPROVED, NOT ACCEPTED 7 $191,819 3 $302,520 0 $0 APPLICATIONS DENIED 2 $124,000 5 $156,706 2 $124,000 APPLICATIONS WITHDRAWN 0 $0 0 $0 0 $0 FILES CLOSED FOR INCOMPLETENESS 0 $0 0 $0 0 $0
Aggregated Statistics For Year 2008(Based on 9 full and 6 partial tracts) A) Conventional B) Refinancings C) Non-occupant Loans on D) Loans On Manufactured Number Average Value Number Average Value Number Average Value Number Average Value
LOANS ORIGINATED 42 $162,776 8 $223,931 12 $113,045 2 $54,710 APPLICATIONS APPROVED, NOT ACCEPTED 21 $249,500 16 $224,371 6 $174,640 4 $112,400 APPLICATIONS DENIED 7 $216,404 5 $181,496 4 $183,160 0 $0 APPLICATIONS WITHDRAWN 5 $425,004 0 $0 1 $60,830 0 $0 FILES CLOSED FOR INCOMPLETENESS 2 $225,000 2 $66,845 0 $0 0 $0
Aggregated Statistics For Year 2007(Based on 9 full and 6 partial tracts) A) Conventional B) Refinancings C) Non-occupant Loans on D) Loans On Manufactured Number Average Value Number Average Value Number Average Value Number Average Value
LOANS ORIGINATED 62 $215,665 32 $251,685 13 $198,872 5 $110,616 APPLICATIONS APPROVED, NOT ACCEPTED 13 $242,910 9 $194,420 5 $217,446 1 $135,000 APPLICATIONS DENIED 3 $202,220 0 $0 2 $219,830 0 $0 APPLICATIONS WITHDRAWN 7 $192,944 1 $577,980 0 $0 3 $137,803 FILES CLOSED FOR INCOMPLETENESS 1 $154,140 0 $0 0 $0 0 $0
Aggregated Statistics For Year 2006(Based on 9 full and 6 partial tracts) A) Conventional B) Refinancings C) Non-occupant Loans on D) Loans On Manufactured Number Average Value Number Average Value Number Average Value Number Average Value
LOANS ORIGINATED 70 $212,380 21 $285,970 36 $243,608 3 $143,333 APPLICATIONS APPROVED, NOT ACCEPTED 24 $210,102 5 $206,236 11 $217,950 1 $96,000 APPLICATIONS DENIED 1 $73,000 0 $0 0 $0 1 $73,000 APPLICATIONS WITHDRAWN 4 $247,072 0 $0 4 $247,072 0 $0 FILES CLOSED FOR INCOMPLETENESS 0 $0 1 $192,000 1 $192,000 0 $0
Aggregated Statistics For Year 2005(Based on 9 full and 6 partial tracts) A) Conventional B) Refinancings C) Non-occupant Loans on D) Loans On Manufactured Number Average Value Number Average Value Number Average Value Number Average Value
LOANS ORIGINATED 97 $201,557 25 $208,940 34 $176,940 4 $67,848 APPLICATIONS APPROVED, NOT ACCEPTED 33 $241,240 9 $183,659 18 $272,034 0 $0 APPLICATIONS DENIED 5 $142,252 0 $0 2 $42,770 0 $0 APPLICATIONS WITHDRAWN 12 $344,867 5 $212,794 2 $230,640 0 $0 FILES CLOSED FOR INCOMPLETENESS 1 $64,550 0 $0 0 $0 0 $0
Aggregated Statistics For Year 2004(Based on 9 full and 6 partial tracts) A) Conventional B) Refinancings C) Non-occupant Loans on D) Loans On Manufactured Number Average Value Number Average Value Number Average Value Number Average Value
LOANS ORIGINATED 114 $166,208 31 $150,458 36 $157,753 3 $71,557 APPLICATIONS APPROVED, NOT ACCEPTED 28 $202,498 18 $200,607 12 $214,579 0 $0 APPLICATIONS DENIED 1 $203,950 2 $66,845 0 $0 0 $0 APPLICATIONS WITHDRAWN 8 $138,058 5 $158,672 3 $145,703 0 $0 FILES CLOSED FOR INCOMPLETENESS 0 $0 0 $0 0 $0 0 $0
Aggregated Statistics For Year 2003(Based on 9 full and 6 partial tracts) A) Conventional B) Refinancings C) Non-occupant Loans on Number Average Value Number Average Value Number Average Value
LOANS ORIGINATED 133 $133,554 78 $132,998 34 $120,372 APPLICATIONS APPROVED, NOT ACCEPTED 47 $159,266 20 $144,020 15 $186,925 APPLICATIONS DENIED 1 $69,360 0 $0 0 $0 APPLICATIONS WITHDRAWN 10 $137,221 8 $116,586 4 $89,615 FILES CLOSED FOR INCOMPLETENESS 0 $0 2 $186,000 0 $0
Aggregated Statistics For Year 2002(Based on 5 full and 6 partial tracts) A) Conventional B) Refinancings C) Non-occupant Loans on Number Average Value Number Average Value Number Average Value
LOANS ORIGINATED 130 $117,451 54 $116,940 24 $100,622 APPLICATIONS APPROVED, NOT ACCEPTED 23 $146,263 13 $94,964 1 $32,760 APPLICATIONS DENIED 1 $115,610 1 $72,000 0 $0 APPLICATIONS WITHDRAWN 12 $141,677 10 $155,083 1 $178,900 FILES CLOSED FOR INCOMPLETENESS 1 $151,000 0 $0 0 $0
Aggregated Statistics For Year 2001(Based on 5 full and 6 partial tracts) A) Conventional B) Refinancings C) Non-occupant Loans on Number Average Value Number Average Value Number Average Value
LOANS ORIGINATED 133 $101,741 47 $110,325 15 $65,916 APPLICATIONS APPROVED, NOT ACCEPTED 23 $140,825 3 $124,027 5 $87,504 APPLICATIONS DENIED 2 $158,000 5 $132,682 2 $202,645 APPLICATIONS WITHDRAWN 4 $166,000 1 $80,000 0 $0 FILES CLOSED FOR INCOMPLETENESS 0 $0 3 $96,137 0 $0
Aggregated Statistics For Year 2000(Based on 5 full and 6 partial tracts) A) Conventional B) Refinancings C) Non-occupant Loans on Number Average Value Number Average Value Number Average Value
LOANS ORIGINATED 97 $89,036 16 $68,914 12 $64,435 APPLICATIONS APPROVED, NOT ACCEPTED 18 $100,578 2 $132,135 2 $70,000 APPLICATIONS DENIED 2 $89,075 3 $115,643 0 $0 APPLICATIONS WITHDRAWN 4 $136,000 0 $0 0 $0 FILES CLOSED FOR INCOMPLETENESS 0 $0 0 $0 0 $0
Aggregated Statistics For Year 1999(Based on 4 full and 3 partial tracts) A) Conventional B) Refinancings C) Non-occupant Loans on Number Average Value Number Average Value Number Average Value
LOANS ORIGINATED 52 $102,983 20 $95,862 6 $111,700 APPLICATIONS APPROVED, NOT ACCEPTED 10 $129,360 2 $119,890 2 $163,140 APPLICATIONS DENIED 3 $103,697 3 $65,767 0 $0 APPLICATIONS WITHDRAWN 3 $67,860 1 $141,000 0 $0 FILES CLOSED FOR INCOMPLETENESS 0 $0 0 $0 0 $0
2002 - 2018 National Fire Incident Reporting System (NFIRS) incidents See full 2006 National Fire Incident Reporting System statistics for zip code 33917, Florida
Most common first names in zip code 33917 among deceased individuals Name Count Lived (average)
John 239 77.1 years Robert 220 73.7 years William 169 76.6 years Mary 148 77.1 years James 136 72.7 years Charles 136 77.2 years Joseph 120 76.9 years Richard 97 72.1 years George 89 78.8 years Dorothy 84 80.3 years
Most common last names in zip code 33917 among deceased individuals Last name Count Lived (average)
Smith 89 75.3 years Miller 41 75.9 years Johnson 37 74.4 years Jones 32 74.9 years Davis 32 76.6 years Williams 25 80.2 years Brown 23 74.1 years Wilson 21 73.7 years Walker 18 79.0 years Roberts 18 83.4 years
Businesses in zip code 33917
Name Count Name Count
AutoZone 1 FedEx 2 CVS 1 MasterBrand Cabinets 6 Circle K 1 Subway 1 Decora Cabinetry 2 UPS 2 Domino's Pizza 1 Walgreens 1 Dunkin Donuts 1

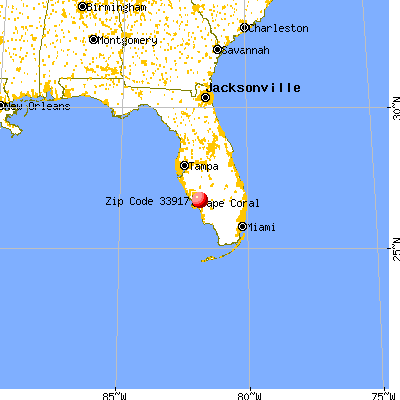


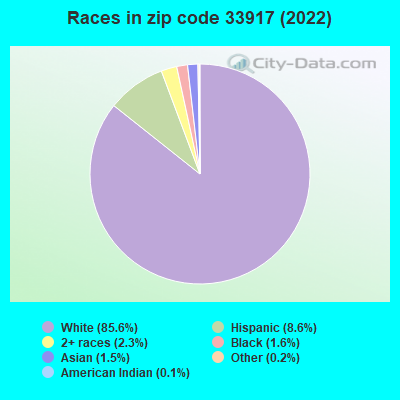


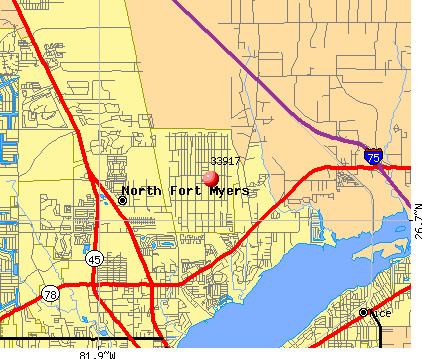 Nearest zip codes: 33903, 33916, 33905, 33909, 33901, 33966.
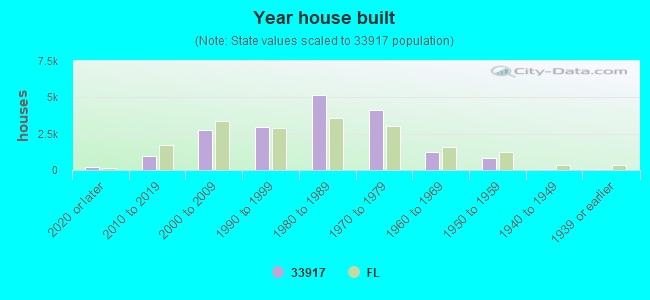

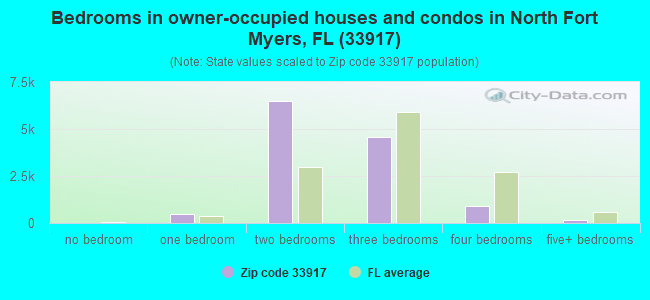
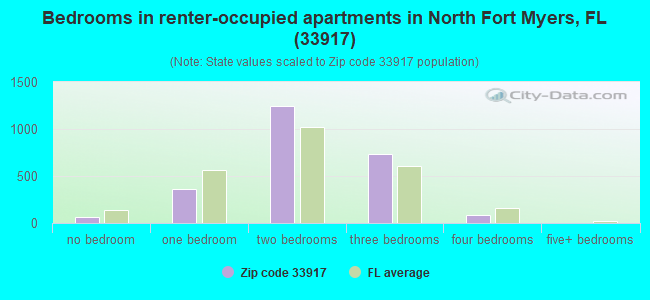
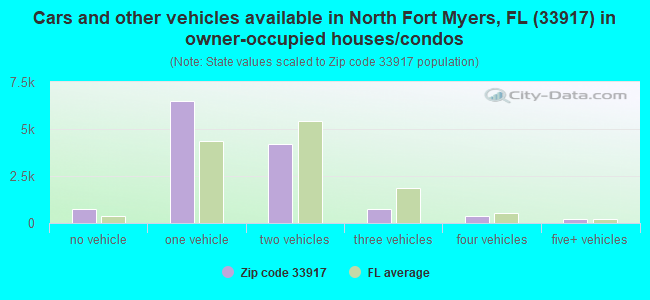
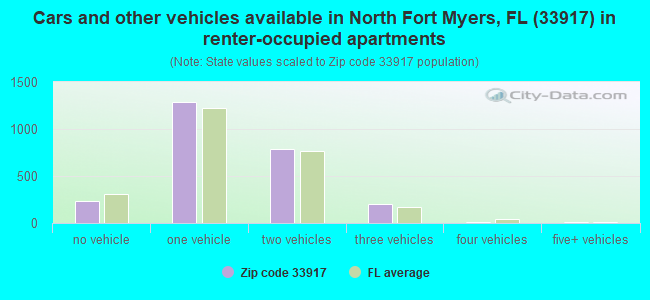


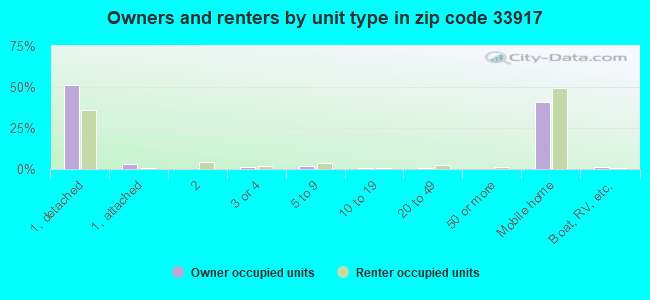
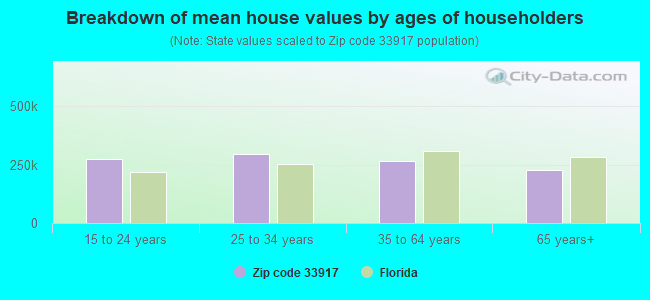


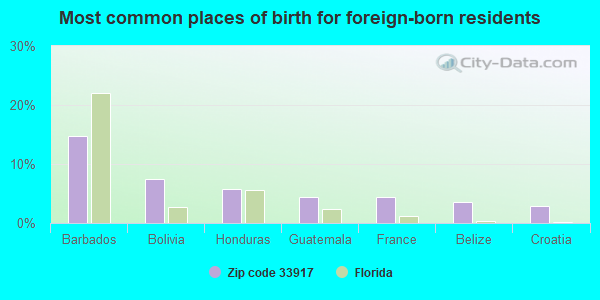
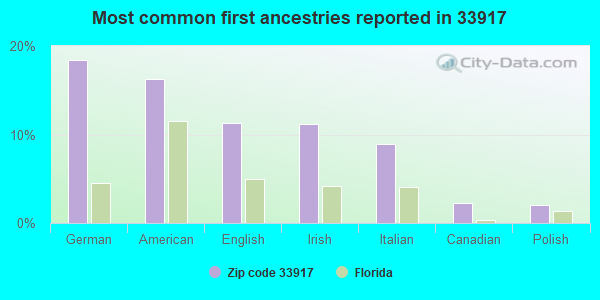
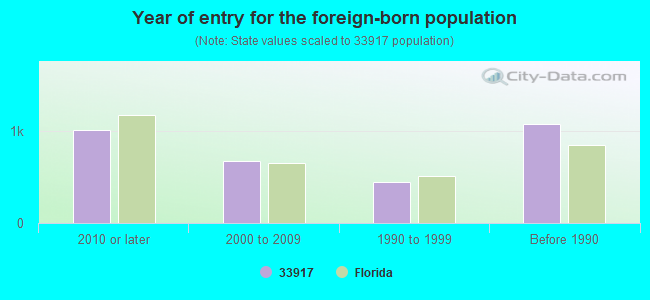
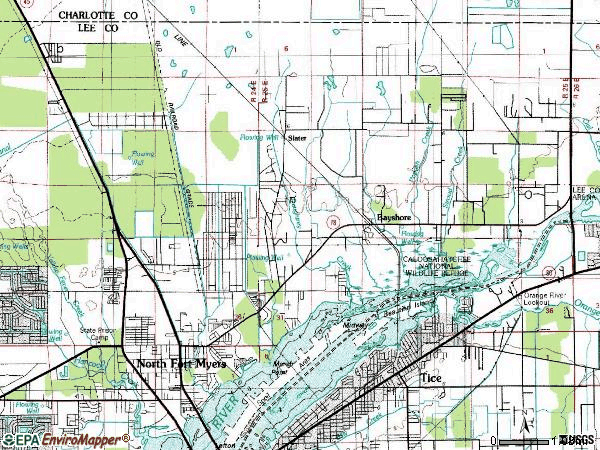

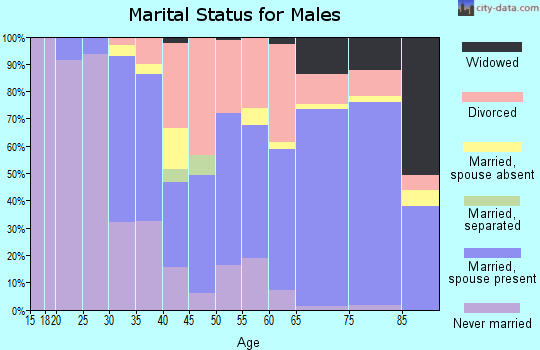
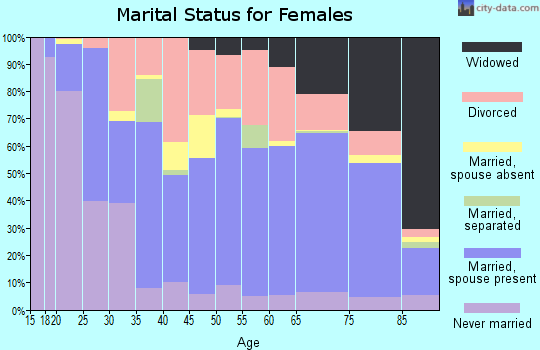
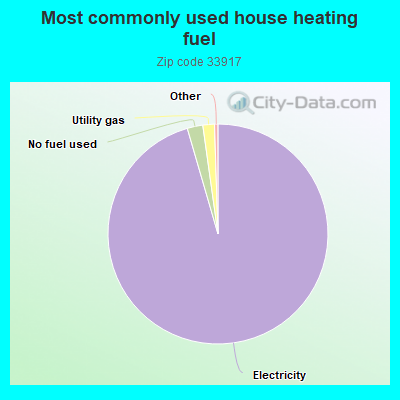
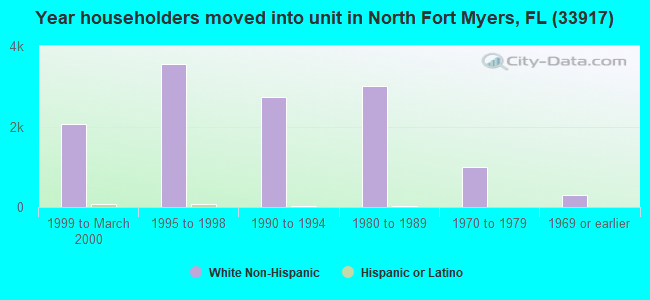
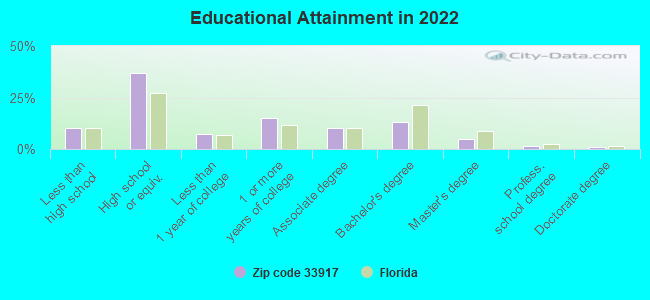
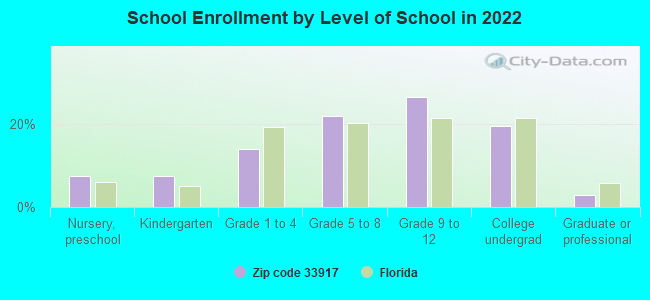
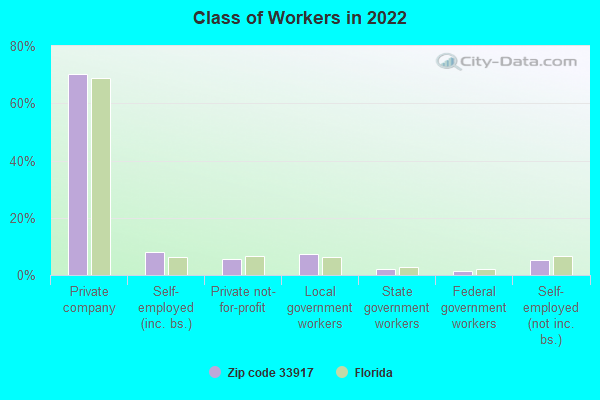
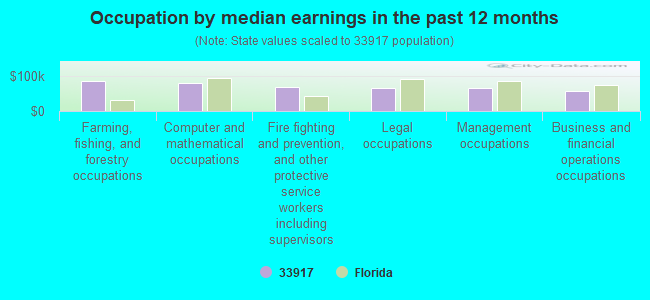
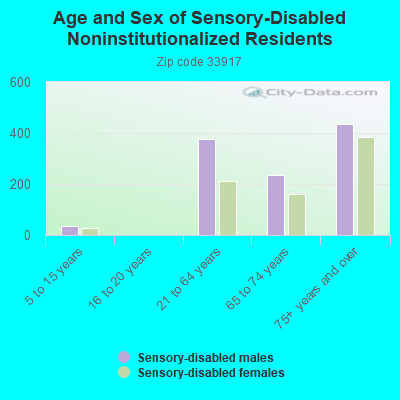
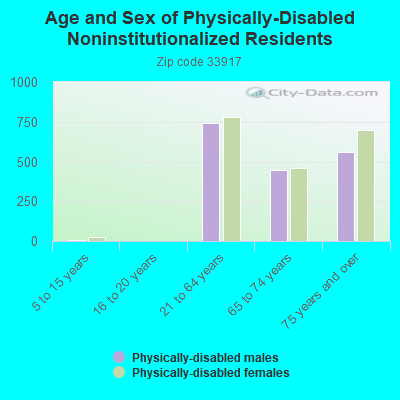
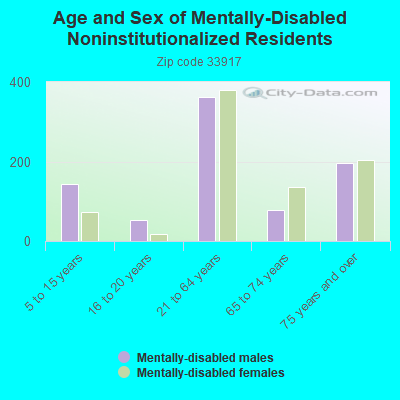
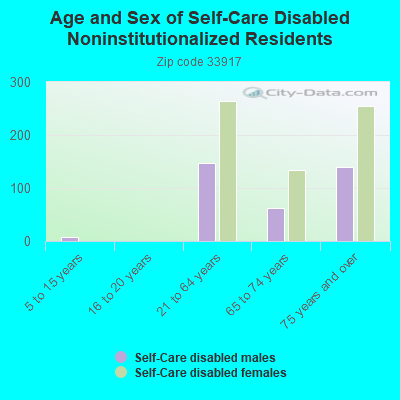
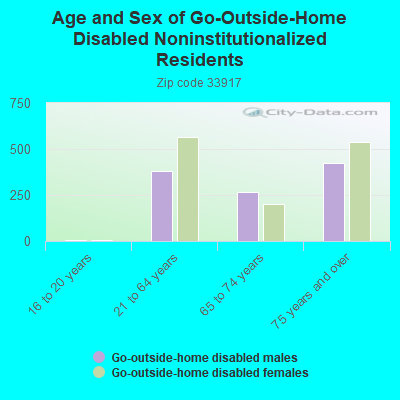
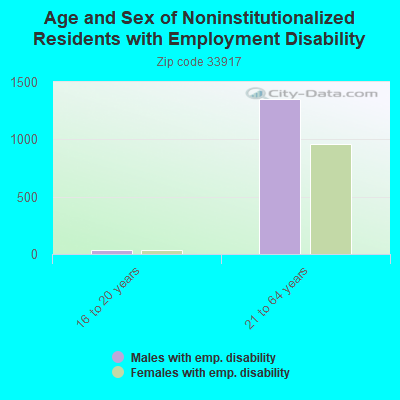
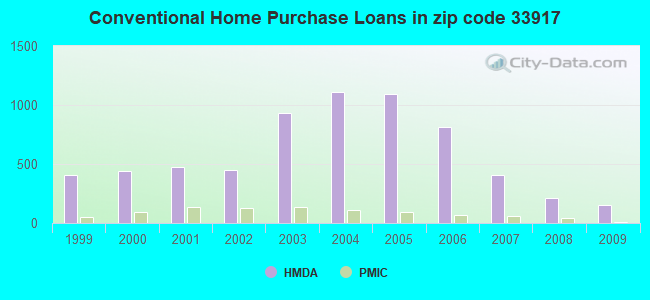
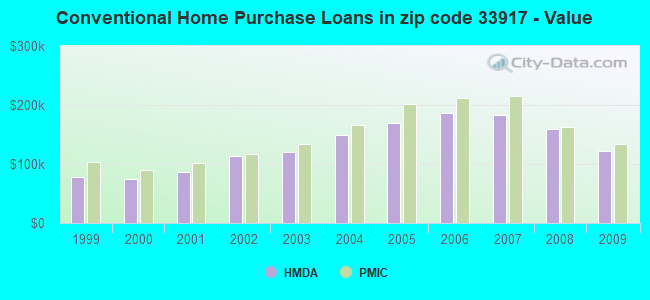
 According to the data from the years 2002 - 2018 the average number of fire incidents per year is 238. The highest number of fires - 372 took place in 2004, and the least - 140 in 2002. The data has a growing trend.
 When looking into fire subcategories, the most incidents belonged to: Outside Fires (61.5%), and Structure Fires (20.1%).