Estimated zip code population in 2022: 24,969 Zip code population in 2010: 19,500 Zip code population in 2000: 21,072
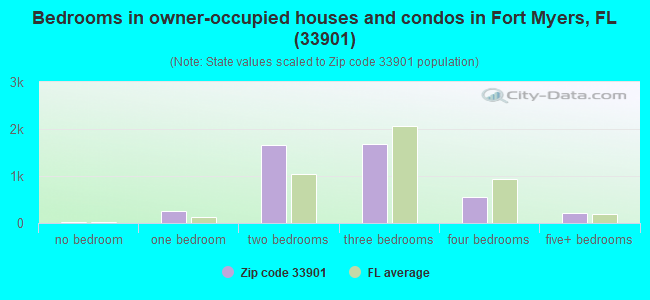
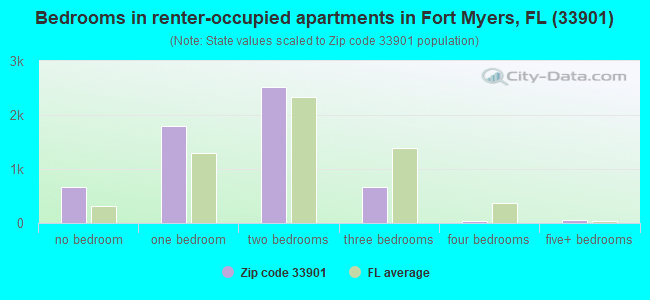
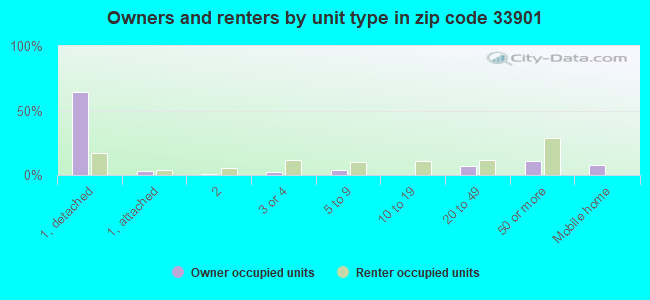
Houses and condos: 12,058 Renter-occupied apartments: 5,662
% of renters here:
56%
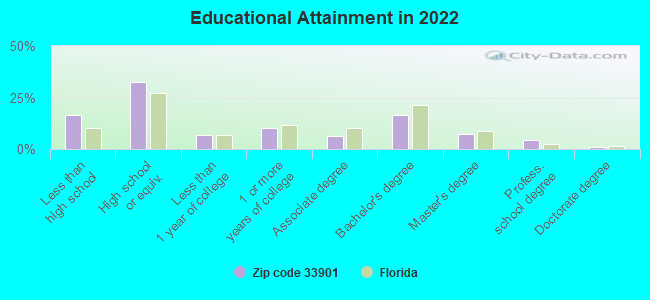
State:
33%
March 2022 cost of living index in zip code 33901: 93.9 (less than average, U.S. average is 100)
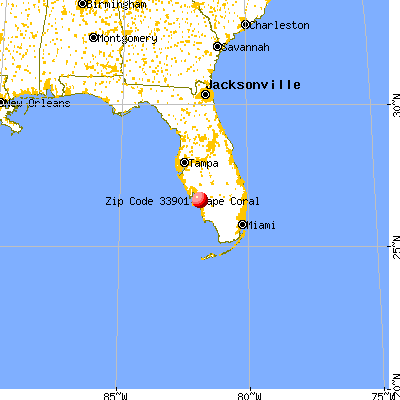
Land area: 6.4 sq. mi. Water area: 2.9 sq. mi.
Population density: 3,895 people per square mile
(average).
OSM Map
General Map
Google Map
MSN Map
OSM Map
General Map
Google Map
MSN Map
OSM Map
General Map
Google Map
MSN Map
OSM Map
General Map
Google Map
MSN Map
Please wait while loading the map...
Real estate property taxes paid for housing units in 2022:
This zip code:
0.8% ($2,596)
Florida:
0.7% ($2,529)
Median real estate property taxes paid for housing units with mortgages in 2022: $3,523 (0.8%) Median real estate property taxes paid for housing units with no mortgage in 2022: $1,713 (0.6%)
Averages for the 2020 tax year for zip code 33901, filed in 2021:
Average Adjusted Gross Income (AGI) in 2020: $67,986 (Individual Income Tax Returns)
Here:
$67,986
State:
$82,200
Salary/wage: $48,050 (reported on 80.7% of returns)
Here:
$48,050
State:
$58,347
(% of AGI for various income ranges: 1279.0% for AGIs below $25k, 3718.8% for AGIs $25k-50k, 6750.9% for AGIs $50k-75k, 9566.8% for AGIs $75k-100k, 16951.8% for AGIs $100k-200k, 107140.0% for AGIs over 200k)
Taxable interest for individuals: $2,750 (reported on 21.5% of returns)
This zip code:
$2,750
Florida:
$4,272
(% of AGI for various income ranges: 11.5% for AGIs below $25k, 18.6% for AGIs $25k-50k, 47.2% for AGIs $50k-75k, 135.9% for AGIs $75k-100k, 390.8% for AGIs $100k-200k, 2540.8% for AGIs over 200k)
Ordinary dividends: $11,441 (reported on 15.8% of returns)
Here:
$11,441
State:
$15,863
(% of AGI for various income ranges: 18.3% for AGIs below $25k, 37.1% for AGIs $25k-50k, 161.2% for AGIs $50k-75k, 354.7% for AGIs $75k-100k, 972.3% for AGIs $100k-200k, 9418.3% for AGIs over 200k)
Net capital gain/loss in AGI: +$37,696 (reported on 15.8% of returns)
Here:
+$37,696
State:
+$62,983
(% of AGI for various income ranges: 7.7% for AGIs below $25k, 41.7% for AGIs $25k-50k, 145.0% for AGIs $50k-75k, 317.9% for AGIs $75k-100k, 1694.4% for AGIs $100k-200k, 43809.2% for AGIs over 200k)
Profit/loss from business: +$11,431 (reported on 18.7% of returns)
Here:
+$11,431
State:
+$9,719
(% of AGI for various income ranges: 126.9% for AGIs below $25k, 125.4% for AGIs $25k-50k, 292.0% for AGIs $50k-75k, 543.5% for AGIs $75k-100k, 999.7% for AGIs $100k-200k, 6094.2% for AGIs over 200k)
Taxable individual retirement arrangement distribution: $24,507 (reported on 7.2% of returns)
33901:
$24,507
Florida:
$24,823
(% of AGI for various income ranges: 38.0% for AGIs below $25k, 64.1% for AGIs $25k-50k, 232.3% for AGIs $50k-75k, 630.6% for AGIs $75k-100k, 1518.5% for AGIs $100k-200k, 5025.0% for AGIs over 200k)
Self-employed (Keogh) retirement plans: $22,860 (reported on 0.5% of returns)
33901:
$22,860
Florida:
$29,694
(% of AGI for various income ranges: 952.5% for AGIs over 200k)
Total itemized deductions: $41,389 (reported on 5.8% of returns)
Here:
$41,389
State:
$45,393
(% of AGI for various income ranges: 32.7% for AGIs below $25k, 73.9% for AGIs $25k-50k, 239.6% for AGIs $50k-75k, 449.4% for AGIs $75k-100k, 1214.6% for AGIs $100k-200k, 11958.3% for AGIs over 200k)
Charity contributions: $18,437 (reported on 4.7% of returns)
Here:
$18,437
State:
$20,178
(% of AGI for various income ranges: 1.5% for AGIs below $25k, 15.6% for AGIs $25k-50k, 50.0% for AGIs $50k-75k, 98.2% for AGIs $75k-100k, 376.9% for AGIs $100k-200k, 5366.7% for AGIs over 200k)
Taxes paid: $6,561 (reported on 5.6% of returns)
33901:
$6,561
State:
$6,967
(% of AGI for various income ranges: 3.6% for AGIs below $25k, 10.7% for AGIs $25k-50k, 34.9% for AGIs $50k-75k, 74.4% for AGIs $75k-100k, 246.7% for AGIs $100k-200k, 1687.5% for AGIs over 200k)
Earned income credit: $2,435 (reported on 25.6% of returns)
Here:
$2,435
State:
$2,306
(% of AGI for various income ranges: 134.2% for AGIs below $25k, 83.8% for AGIs $25k-50k)
Percentage of individuals using paid preparers for their 2020 taxes: 91.0%
Here:
91%
State:
92%
(% for various income ranges: 90.0% for AGIs below $25k, 92.3% for AGIs $25k-50k, 90.1% for AGIs $50k-75k, 91.1% for AGIs $75k-100k, 91.7% for AGIs $100k-200k, 92.5% for AGIs over 200k)
Averages for the 2012 tax year for zip code 33901, filed in 2013:
Average Adjusted Gross Income (AGI) in 2012: $50,330 (Individual Income Tax Returns)
Here:
$50,330
State:
$60,316
Salary/wage: $37,628 (reported on 81.6% of returns)
Here:
$37,628
State:
$45,277
(% of AGI for various income ranges: 80.4% for AGIs below $25k, 80.6% for AGIs $25k-50k, 71.6% for AGIs $50k-75k, 66.4% for AGIs $75k-100k, 59.9% for AGIs $100k-200k, 41.9% for AGIs over 200k)
Taxable interest for individuals: $3,278 (reported on 23.1% of returns)
This zip code:
$3,278
Florida:
$3,587
(% of AGI for various income ranges: 1.0% for AGIs below $25k, 1.0% for AGIs $25k-50k, 1.4% for AGIs $50k-75k, 1.4% for AGIs $75k-100k, 1.4% for AGIs $100k-200k, 2.0% for AGIs over 200k)
Ordinary dividends: $10,185 (reported on 16.4% of returns)
Here:
$10,185
State:
$12,831
(% of AGI for various income ranges: 2.2% for AGIs below $25k, 2.3% for AGIs $25k-50k, 2.9% for AGIs $50k-75k, 3.8% for AGIs $75k-100k, 4.1% for AGIs $100k-200k, 3.9% for AGIs over 200k)
Net capital gain/loss in AGI: +$13,344 (reported on 14.2% of returns)
Here:
+$13,344
State:
+$33,493
(% of AGI for various income ranges: 0.4% for AGIs $25k-50k, 1.1% for AGIs $50k-75k, 1.2% for AGIs $75k-100k, 3.1% for AGIs $100k-200k, 8.2% for AGIs over 200k)
Profit/loss from business: +$12,055 (reported on 15.8% of returns)
Here:
+$12,055
State:
+$10,012
(% of AGI for various income ranges: 7.5% for AGIs below $25k, 2.6% for AGIs $25k-50k, 2.8% for AGIs $50k-75k, 4.0% for AGIs $75k-100k, 3.9% for AGIs $100k-200k, 3.1% for AGIs over 200k)
Taxable individual retirement arrangement distribution: $18,897 (reported on 7.7% of returns)
33901:
$18,897
Florida:
$21,544
(% of AGI for various income ranges: 1.7% for AGIs below $25k, 1.6% for AGIs $25k-50k, 3.3% for AGIs $50k-75k, 4.0% for AGIs $75k-100k, 6.3% for AGIs $100k-200k, 2.2% for AGIs over 200k)
Self-employment retirement plans: $38,000 (reported on 0.4% of returns)
33901:
$38,000
Florida:
$20,611
Total itemized deductions: $25,784 (18% of AGI, reported on 19.1% of returns)
Here:
$25,784
State:
$25,533
Here:
17.9% of AGI
State:
18.0% of AGI
(% of AGI for various income ranges: 6.5% for AGIs below $25k, 10.1% for AGIs $25k-50k, 10.2% for AGIs $50k-75k, 11.4% for AGIs $75k-100k, 13.3% for AGIs $100k-200k, 9.2% for AGIs over 200k)
Charity contributions: $6,421 (reported on 14.3% of returns)
Here:
$6,421
State:
$5,698
(% of AGI for various income ranges: 0.5% for AGIs below $25k, 1.1% for AGIs $25k-50k, 1.4% for AGIs $50k-75k, 1.9% for AGIs $75k-100k, 2.3% for AGIs $100k-200k, 2.5% for AGIs over 200k)
Taxes paid: $5,664 (reported on 18.2% of returns)
33901:
$5,664
State:
$6,203
(% of AGI for various income ranges: 0.8% for AGIs below $25k, 1.5% for AGIs $25k-50k, 1.7% for AGIs $50k-75k, 1.9% for AGIs $75k-100k, 3.2% for AGIs $100k-200k, 2.4% for AGIs over 200k)
Earned income credit: $2,489 (reported on 29.9% of returns)
Here:
$2,489
State:
$2,372
(% of AGI for various income ranges: 9.1% for AGIs below $25k, 1.2% for AGIs $25k-50k)
Percentage of individuals using paid preparers for their 2012 taxes: 54.3%
Here:
54%
State:
54%
(% for various income ranges: 53.3% for AGIs below $25k, 49.8% for AGIs $25k-50k, 53.0% for AGIs $50k-75k, 56.4% for AGIs $75k-100k, 68.0% for AGIs $100k-200k, 83.3% for AGIs over 200k)
Averages for the 2004 tax year for zip code 33901, filed in 2005:
Average Adjusted Gross Income (AGI) in 2004: $48,426 (Individual Income Tax Returns)
Here:
$48,426
State:
$50,523
Salary/wage: $33,734 (reported on 83.3% of returns)
Here:
$33,734
State:
$39,563
(% of AGI for various income ranges: 109.8% for AGIs below $10k, 84.7% for AGIs $10k-25k, 83.7% for AGIs $25k-50k, 70.5% for AGIs $50k-75k, 71.4% for AGIs $75k-100k, 36.5% for AGIs over 100k)
Taxable interest for individuals: $3,640 (reported on 31.6% of returns)
This zip code:
$3,640
Florida:
$3,211
(% of AGI for various income ranges: 5.3% for AGIs below $10k, 2.0% for AGIs $10k-25k, 1.7% for AGIs $25k-50k, 3.2% for AGIs $50k-75k, 2.9% for AGIs $75k-100k, 2.4% for AGIs over 100k)
Taxable dividends: $6,210 (reported on 19.8% of returns)
Here:
$6,210
State:
$6,129
(% of AGI for various income ranges: 6.1% for AGIs below $10k, 1.5% for AGIs $10k-25k, 1.5% for AGIs $25k-50k, 3.0% for AGIs $50k-75k, 2.8% for AGIs $75k-100k, 2.9% for AGIs over 100k)
Net capital gain/loss: +$46,442 (reported on 17.2% of returns)
Here:
+$46,442
State:
+$27,205
(% of AGI for various income ranges: -2.3% for AGIs below $10k, 0.3% for AGIs $10k-25k, 0.9% for AGIs $25k-50k, 3.1% for AGIs $50k-75k, 3.5% for AGIs $75k-100k, 30.9% for AGIs over 100k)
Profit/loss from business: +$14,721 (reported on 11.7% of returns)
Here:
+$14,721
State:
+$10,634
(% of AGI for various income ranges: 12.3% for AGIs below $10k, 3.0% for AGIs $10k-25k, 2.3% for AGIs $25k-50k, 2.6% for AGIs $50k-75k, 3.6% for AGIs $75k-100k, 4.0% for AGIs over 100k)
IRA payment deduction: $2,903 (reported on 1.8% of returns)
33901:
$2,903
Florida:
$3,082
(% of AGI for various income ranges: 0.1% for AGIs $10k-25k, 0.2% for AGIs $25k-50k, 0.2% for AGIs $50k-75k, 0.2% for AGIs $75k-100k, 0.1% for AGIs over 100k)
Self-employed pension: $23,912 (reported on 0.6% of returns)
Here:
$23,912
Florida:
$15,857
Total itemized deductions: $18,806 (18% of AGI, reported on 26.7% of returns)
Here:
$18,806
State:
$20,370
Here:
18.0% of AGI
State:
20.7% of AGI
(% of AGI for various income ranges: 16.9% for AGIs below $10k, 10.7% for AGIs $10k-25k, 14.7% for AGIs $25k-50k, 14.9% for AGIs $50k-75k, 14.6% for AGIs $75k-100k, 7.1% for AGIs over 100k)
Charity contributions deductions: $4,999 (4% of AGI, reported on 22.5% of returns)
Here:
$4,999
State:
$4,064
Here:
4.4% of AGI
State:
3.8% of AGI
(% of AGI for various income ranges: 0.7% for AGIs below $10k, 1.4% for AGIs $10k-25k, 2.0% for AGIs $25k-50k, 2.5% for AGIs $50k-75k, 2.5% for AGIs $75k-100k, 2.7% for AGIs over 100k)
Total tax: $10,680 (reported on 64.5% of returns)
33901:
$10,680
State:
$9,431
(% of AGI for various income ranges: 3.1% for AGIs below $10k, 3.3% for AGIs $10k-25k, 6.6% for AGIs $25k-50k, 9.6% for AGIs $50k-75k, 11.8% for AGIs $75k-100k, 21.2% for AGIs over 100k)
Earned income credit: $1,855 (reported on 25.8% of returns)
Here:
$1,855
State:
$1,808
Percentage of individuals using paid preparers for their 2004 taxes: 60.5%
Here:
60%
State:
60%
(% for various income ranges: 57.2% for AGIs below $10k, 61.8% for AGIs $10k-25k, 55.4% for AGIs $25k-50k, 61.7% for AGIs $50k-75k, 61.5% for AGIs $75k-100k, 80.7% for AGIs over 100k)
Likely homosexual households (counted as self-reported same-sex unmarried-partner households)
Lesbian couples: 0.2% of all households
Gay men: 0.3% of all households
Household received Food Stamps/SNAP in the past 12 months: 1,701 Household did not receive Food Stamps/SNAP in the past 12 months: 8,358
Women who had a birth in the past 12 months: 293 (110 now married, 171 unmarried) Women who did not have a birth in the past 12 months: 4,939 (1,986 now married, 2,952 unmarried)
Housing units in zip code 33901 with a mortgage: 2,175 (192 second mortgage, 170 both second mortgage and home equity loan) Houses without a mortgage: 6
Median monthly owner costs for units with a mortgage: $2,102 Median monthly owner costs for units without a mortgage: $583
Residents with income below the poverty level in 2022:
This zip code:
21.0%
Whole state:
12.7%
Residents with income below 50% of the poverty level in 2022:
This zip code:
11.0%
Whole state:
6.6%
Median number of rooms in houses and condos:
Here:
5.6
State:
5.9
Median number of rooms in apartments:
Here:
3.8
State:
4.2
Notable locations in this zip code not listed on our city pages
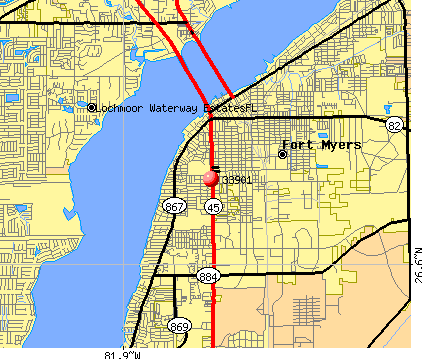
Notable locations in zip code 33901: Eagle Harbor Golf Club (A), Edison Square (B), Fort Myers-Lee County Library (C), Southwest Florida Pro Fire (D), City of Fort Myers Fire and Rescue Station 1 (E), City of Fort Myers Fire and Rescue Station 3 (F), Southwest Florida Addictions Services Adult Detoxification Center (G), Lee County Emergency Medical Services (H), US Marshals Service (I), Federal Bureau of Investigation (J), US Secret Service (K), US Marshals Service (L), Lee County Sheriff's Office (M), Fort Myers Police Department (N), Lee County Sheriff's Office Corrections Bureau Jail (O), Edison and Ford Winter Estates (P), City of Fort Myers Southwest Florida Museum of History (Q). Display/hide their locations on the map
Shopping Centers: Edison Mall Shopping Center (1), Edison Mall (2), Boca Grande Railroad Depot Shopping Center (3), Morse Shores Shopping Centers (4), Fowler Street Shopping Center (5). Display/hide their locations on the map
Churches in zip code 33901 include: Zion Hope Missionary Baptist Church (A), Word of Life Church (B), Saint Lukes Episcopal Church (C), Saint Hilary's Episcopal Church (D), Saint Francis Xavier Catholic Church (E), Lutheran Church of the Redeemer (F), Islamic Center of Southwest Florida (G), Iglesia Emmanuel Baptist Church (H), Gulf Coast Church of Christ on McGregor (I). Display/hide their locations on the map
In group quarters: 1,827 (-1 institutionalized population)
Size of family households: 2,249 2-persons, 1,248 3-persons, 881 4-persons, 470 5-persons, 104 6-persons, 154 7-or-more-persons
Size of nonfamily households: 4,466 1-person, 480 2-persons, 19 5-persons
2,956 married couples with children.
2,104 single-parent households (624 men, 1,480 women).
68.4% of residents of 33901 zip code speak English at home.
17.2% of residents speak Spanish at home (48% very well, 18% well, 20% not well, 14% not at all).
13.7% of residents speak other Indo-European language at home (54% very well, 20% well, 13% not well, 14% not at all).
1.1% of residents speak Asian or Pacific Island language at home (72% very well, 28% well).
0.3% of residents speak other language at home (83% very well, 17% well).
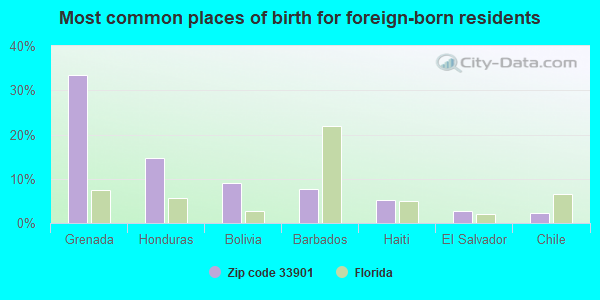
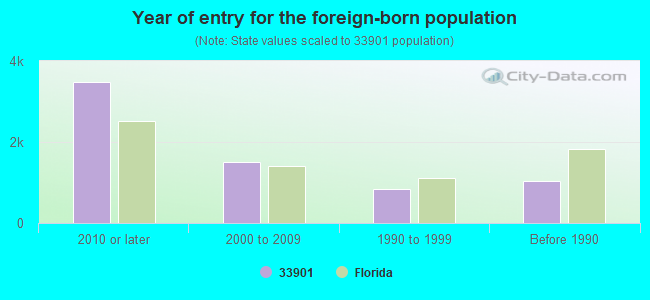
Foreign born population: 6,121 (24.5%) (42.4% of them are naturalized citizens)
Major facilities with environmental interests located in this zip code:
PALL AEROPOWER CORP (4245 EVANS AVE in FORT MYERS, FL)
AIR MINOR (AIRS/AFS) STATE MASTER (FDM) - CHAZ-FLD115383804, HAZARDOUS WASTE REGULATION PROGRAM, WAFR-FLR05C477, NPDES STORMWATER PROGRAM, NPDES STORMWATER PERMIT National Pollutant Discharge Elimination System NON-MAJOR (Tracking pollutant discharge elimination systems) - permit Large Quantity Generators, more that 1000 kg of hazardous waste/month (Resource Conservation and Recovery Act (tracking hazardous waste)) TRI REPORTER (Tracking of toxic chemicals releasing facilities) Business SIC classification: INDUSTRIAL AND COMMERCIAL MACHINERY AND EQUIPMENT; AIRCRAFT PARTS AND AUXILIARY EQUIPMENT Business NAICS classification: OTHER COMMERCIAL AND SERVICE INDUSTRY MACHINERY MANUFACTURING. Organizations: PALL AEROPOWER CORP FTM, STEPHEN SPENCER (CONTACT/OWNER)
Alternative names: PALL AEROPOWER CORPORATION- FORT MYERS, PALL AEROPOWER CORP FTM, PALL AEROPPOWER CORPORATION
GIO AUTO PAINT & BODY SHOP INC (3660 FOWLER ST in FORT MYERS, FL)
STATE MASTER (FDM) - CHAZ-FLR000044008, HAZARDOUS WASTE REGULATION PROGRAM (Resource Conservation and Recovery Act (tracking hazardous waste)) Business SIC classification: TOP, BODY, AND UPHOLSTERY REPAIR SHOPS AND PAINT SHOPS Business NAICS classification: AUTOMOTIVE BODY, PAINT, AND INTERIOR REPAIR AND MAINTENANCE. Organizations: HERITAGE AUTOMOTIVE ENTERPRISES, ADOLPH MUSCH (CONTACT/OWNER)
Alternative names: HERITAGE AUTOMOTIVE ENTERPRISES
MATTINGLY TILE COMPANY (3030 PALM AVE in FT MYERS, FL)
STATE MASTER (FDM) - WAFR-FLR05C343, NPDES STORMWATER PROGRAM, NPDES STORMWATER PERMIT National Pollutant Discharge Elimination System NON-MAJOR (Tracking pollutant discharge elimination systems) - permit Business SIC classification: CUT STONE AND STONE PRODUCTS Organizations: VITTORIO DESANCTIS (CONTACT/OWNER)
Alternative names: DESANCTIS MARBLE & GRANITE/MATTINGLY TILE CO.
ALS AUTO REPAIR (3220 PALM AVE in FORT MYERS, FL)
STATE MASTER (FDM) - CHAZ-FLD982102667, HAZARDOUS WASTE REGULATION PROGRAM (Resource Conservation and Recovery Act (tracking hazardous waste)) Business SIC classification: GENERAL AUTOMOTIVE REPAIR SHOPS Business NAICS classification: GENERAL AUTOMOTIVE REPAIR. Organizations: ALTON L HICKMAN JR (CONTACT/OWNER)
Alternative names: DICKS AUTO BODY INC, DICKS AUTO BODY INC
SATURN SOUTHWEST FLORIDA LLC (4201 FOWLER ST in FORT MYERS, FL)
STATE MASTER (FDM) - CHAZ-FL0001015171, HAZARDOUS WASTE REGULATION PROGRAM Small Quantity Generators, between 100 kg and 1000 kg of hazardous waste/month (Resource Conservation and Recovery Act (tracking hazardous waste)) - notification Business SIC classification: MOTOR VEHICLE DEALERS (NEW AND USED) Organizations: SATURN OF FORT MYERS, TOM NELSON, OPER DIR (CONTACT/OWNER)
Alternative names: SATURN OF FORT MYERS
LEE MEMORIAL HOSPITAL DOCTORS (2780 CLEVELAND AVE in FT MYERS, FL)
National Pollutant Discharge Elimination System NON-MAJOR (Tracking pollutant discharge elimination systems) - permit National Pollutant Discharge Elimination System NON-MAJOR (Tracking pollutant discharge elimination systems) - permit Organizations: DIRK FRINK (CONTACT/OWNER)
Alternative names: B & K CATTLE COMPANY, LEE MEMORIAL HOSPITAL FRONT PA
JACKS ECONOMY AUTO PAINTING (2540 WILLARD ST in FORT MYERS, FL)
STATE MASTER (FDM) - CHAZ-FLD984251066, HAZARDOUS WASTE REGULATION PROGRAM Small Quantity Generators, between 100 kg and 1000 kg of hazardous waste/month (Resource Conservation and Recovery Act (tracking hazardous waste)) Business SIC classification: TOP, BODY, AND UPHOLSTERY REPAIR SHOPS AND PAINT SHOPS Business NAICS classification: AUTOMOTIVE BODY, PAINT, AND INTERIOR REPAIR AND MAINTENANCE. Organizations: JACK LIPSCOMB (CONTACT/OWNER)
MYSTIK (4102 CLEVELAND AVE in FORT MYERS, FL)
STATE MASTER (FDM) - CHAZ-FLD984210567, HAZARDOUS WASTE REGULATION PROGRAM Small Quantity Generators, between 100 kg and 1000 kg of hazardous waste/month (Resource Conservation and Recovery Act (tracking hazardous waste)) - notification Business SIC classification: GASOLINE SERVICE STATIONS Organizations: AMOCO SERVICE STATION #834, STEPHEN LANE, DEALER (CONTACT/OWNER)
Alternative names: AMOCO SERVICE STATION #834
COMMERCE LTD PARTNERSHIP #9408 (4455 CLEVELAND AVENUE in FORT MYERS, FL)
STATE MASTER (FDM) - CHAZ-FLD984176644, HAZARDOUS WASTE REGULATION PROGRAM Small Quantity Generators, between 100 kg and 1000 kg of hazardous waste/month (Resource Conservation and Recovery Act (tracking hazardous waste)) - notification Business SIC classification: MISCELLANEOUS APPAREL AND ACCESSORY STORES Organizations: GALLENTINE EXXON, JOHN GALLENTINE, DEALER (CONTACT/OWNER)
Alternative names: GALLENTINE EXXON
ALLEN PARK ELEMENTARY SCHOOL (3345 CANELO DR. in FORT MYERS, FL)
(Geographic Names Information System) (National Center for Education Statistics) - STATE ID-0081 Organizations: LEE COUNTY SCHOOL DISTRICT (SCHOOL DISTRICT)
A & D SCRAP MATERIALS, INC (3066 CRANFORD AVE in FT MYERS, FL)
National Pollutant Discharge Elimination System NON-MAJOR (Tracking pollutant discharge elimination systems) - permit (Resource Conservation and Recovery Act (tracking hazardous waste)) Business SIC classification: SCRAP AND WASTE MATERIALS Organizations: JOSEPH DOZIER (CONTACT/OWNER)
, A & D SCRAP MATERIALS INC (CONTACT/OWNER)
RICHARD MILBURN ACADEMY (3830 EVANS AVENUE in FT. MYERS, FL)
(National Center for Education Statistics) - STATE ID-4101 Organizations: LEE COUNTY SCHOOL DISTRICT (SCHOOL DISTRICT)
PRICE HALFWAY HOUSE (2266 SECOND STREET in FT. MYERS, FL)
(National Center for Education Statistics) - STATE ID-0662 Organizations: LEE COUNTY SCHOOL DISTRICT (SCHOOL DISTRICT)
Housing units lacking complete plumbing facilities: 1.8% Housing units lacking complete kitchen facilities: 5.0%
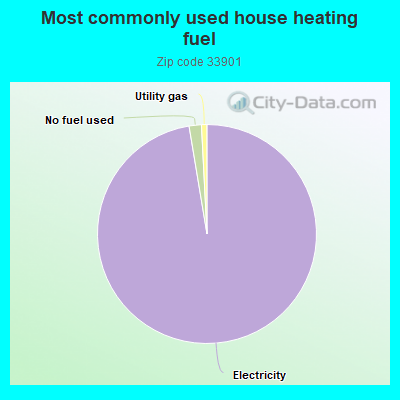
96.9%Electricity
1.8%No fuel used
0.8%Utility gas
Population in 1990: 22,150.
Place of birth for U.S.-born residents:
This state: 8,614
Northeast: 2,917
Midwest: 3,579
South: 2,526
West: 733
43% of the 33901 zip code residents lived in the same house 5 years ago. Out of people who lived in different houses, 62% lived in this county. Out of people who lived in different counties, 50% lived in Florida.
82% of the 33901 zip code residents lived in the same house 1 year ago. Out of people who lived in different houses, 54% moved from this county. Out of people who lived in different houses, 17% moved from different county within same state. Out of people who lived in different houses, 16% moved from different state. Out of people who lived in different houses, 9% moved from abroad.
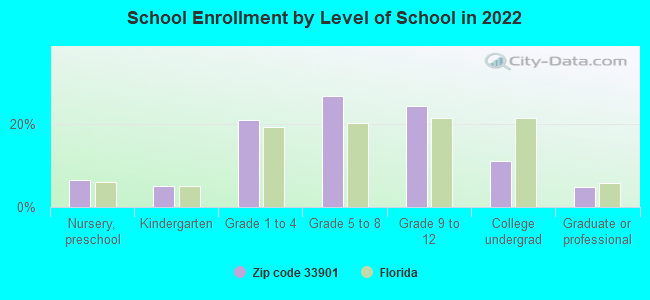
Private vs. public school enrollment:
Students in private schools in grades 1 to 8 (elementary and middle school): 277
Here:
11.1%
Florida:
15.8%
Students in private schools in grades 9 to 12 (high school): 98
Here:
7.7%
Florida:
12.9%
Students in private undergraduate colleges: 111
Here:
19.3%
Florida:
23.6%
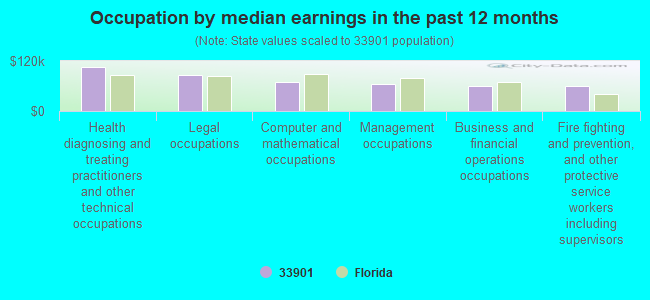
Occupation by median earnings in the past 12 months ($)
106,383Health diagnosing and treating practitioners and other technical occupations
87,022Legal occupations
70,064Computer and mathematical occupations
64,664Management occupations
60,094Business and financial operations occupations
59,787Fire fighting and prevention, and other protective service workers including supervisors
Companies with federal contracts located in this zip code (FORT MYERS, FL):
ANCEL ST JOHN (600 CENTER RD; small business) : $89,030 in 19 contractsfrom 2003 to 2006
Contracts for Guard Services by Army, U.S. Army Corps of Engineers - civil program financing only Signed by year:2000: $0; 2001: $0; 2002: $0; 2003: $8,700; 2004: $35,070; 2005: $31,312; 2006: $13,948.
Biggest contracts:
$14,198 with Army for Guard Services. Signed on 2006-02-09. Completion date: 2005-09-30.
$13,050 with U.S. Army Corps of Engineers - civil program financing only for Guard Services. Signed on 2004-01-30. Completion date: 2004-09-30.
$13,050 with Army for Guard Services. Signed on 2004-01-30. Completion date: 2004-09-30.
$10,465, same as above.Signed on 2005-03-08. Completion date: 2005-09-30.
BOB DEAN SUPPLY, INC (2624 HANSON ST) : $56,743 in 8 contractsfrom 2001 to 2005
Contracts for Structural Shapes, Nonferrous Scrap, Office Furniture, Pipe, Tube and Rigid Tubing, and moreby U.S. Army Corps of Engineers - civil program financing only, Army, Geological Survey Signed by year:2000: $0; 2001: $30,357; 2002: $0; 2003: $0; 2004: $8,240; 2005: $18,146; 2006: $0.
Biggest contracts:
$18,486 with U.S. Army Corps of Engineers - civil program financing only for Structural Shapes. Signed on 2001-03-26. Completion date: 2001-04-16.
$11,871 with U.S. Army Corps of Engineers - civil program financing only for Nonferrous Scrap. Signed on 2001-03-26. Completion date: 2001-04-09.
$4,971 with Army for Structural Shapes. Signed on 2005-01-27. Completion date: 2005-02-04.
$4,971 with U.S. Army Corps of Engineers - civil program financing only for Structural Shapes. Signed on 2005-01-27. Completion date: 2005-02-04.
PALL AEROPOWER CORPORATION (4245 EVANS AVENUE)
$55,218 with Defense Logistics Agency for Aircraft Hydraulic, Vacuum, and De-icing System Components. Signed on 2003-12-22. Completion date: 2004-05-20.
SPRINT-FLORIDA, INCORPORATED (1520 LEE ST; small business) : $36,398 in 7 contractsfrom 2000 to 2004
Contracts for Telephone and/or Communications Services (includes Telegraph, Telex, and Cablevision Services) by U.S. Army Corps of Engineers - civil program financing only, Army Signed by year:2000: $18,000; 2001: $33,190; 2002: $0; 2003: $0; 2004: -$14,792; 2005: $0; 2006: $0.
Biggest contracts:
$18,000 with U.S. Army Corps of Engineers - civil program financing only for Telephone and/or Communications Services (includes Telegraph, Telex, and Cablevision Services). Signed on 2001-11-06. Completion date: 2000-10-01.
$18,000, same as above.Signed on 2000-10-24. Completion date: 2000-10-01.
$15,190, same as above.Signed on 2001-05-24. Completion date: 1999-10-01.
$0, same as above.Signed on 2000-10-24. Completion date: 2000-10-01.
SCHOOL BOARD OF LEE COUNTY (2055 CENTRAL AVE) : $10,039 in 3 contractsfrom 2004 to 2005
$5,422 with Army for Motor Passenger Services. Signed on 2005-09-08. Completion date: 2005-04-10.
$3,432 with Army for Passenger Motor Charter Service. Signed on 2004-07-14. Completion date: 2004-07-23.
$1,185, same as above.Signed on 2005-01-25. Completion date: 2004-07-23.
Top industries in this zip code by the number of employees in 2005:
Health Care and Social Assistance: General Medical and Surgical Hospitals (over 1000 employees: 2 establishments, 20-49 employees: 1 establishment, 10-19 employees: 1 establishment)
Administrative and Support and Waste Management and Remediation Services: Temporary Help Services (250-499: 1, 100-249: 6, 50-99: 1, 20-49: 1, 5-9: 2, 1-4: 1)
Health Care and Social Assistance: Offices of Physicians (except Mental Health Specialists) (100-249: 2, 50-99: 4, 20-49: 5, 10-19: 18, 5-9: 13, 1-4: 17)
Professional, Scientific, and Technical Services: Offices of Lawyers (100-249: 2, 50-99: 2, 20-49: 5, 10-19: 13, 5-9: 20, 1-4: 89)
2002 - 2018 National Fire Incident Reporting System (NFIRS) incidents
According to the data from the years 2002 - 2018 the average number of fire incidents per year is 118. The highest number of fires - 267 took place in 2006, and the least - 3 in 2005. The data has a growing trend.
When looking into fire subcategories, the most incidents belonged to: Outside Fires (42.7%), and Structure Fires (28.0%).
Fire incident types reported to NFIRS in Zip Code 33901


 Nearest zip codes: 33916, 33966, 33907, 33903, 33990, 33919.


 According to the data from the years 2002 - 2018 the average number of fire incidents per year is 118. The highest number of fires - 267 took place in 2006, and the least - 3 in 2005. The data has a growing trend.
 When looking into fire subcategories, the most incidents belonged to: Outside Fires (42.7%), and Structure Fires (28.0%).