Estimated zip code population in 2022: 23,062 Zip code population in 2010: 20,776 Zip code population in 2000: 23,107
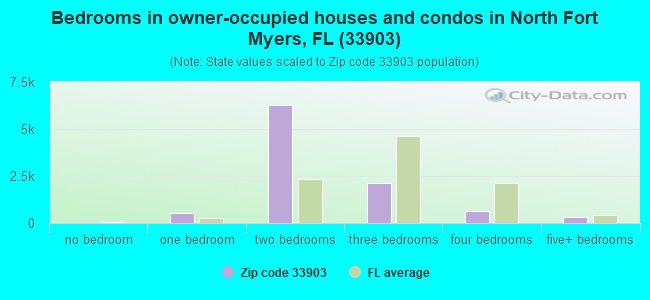
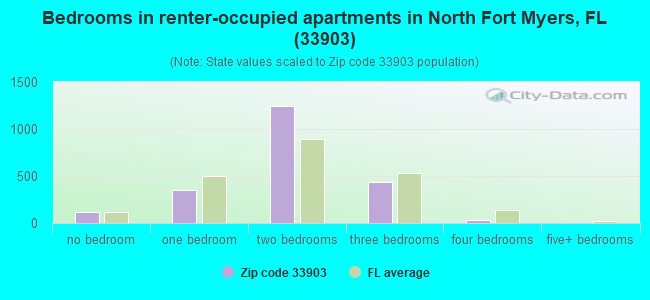
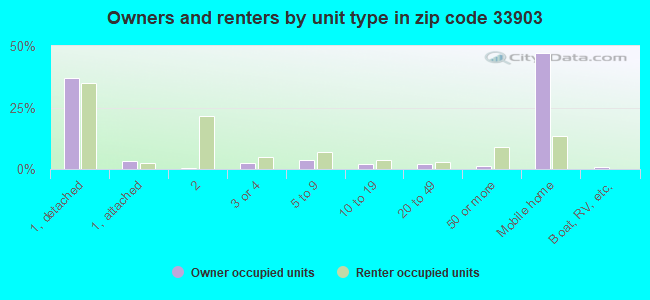
Houses and condos: 15,765 Renter-occupied apartments: 2,200
% of renters here:
18%
State:
33%
March 2022 cost of living index in zip code 33903: 89.3 (less than average, U.S. average is 100)
Land area: 12.6 sq. mi. Water area: 2.7 sq. mi.
Population density: 1,837 people per square mile
(low).
OSM Map
General Map
Google Map
MSN Map
OSM Map
General Map
Google Map
MSN Map
OSM Map
General Map
Google Map
MSN Map
OSM Map
General Map
Google Map
MSN Map
Please wait while loading the map...
Real estate property taxes paid for housing units in 2022:
This zip code:
0.8% ($1,178)
Florida:
0.7% ($2,529)
Median real estate property taxes paid for housing units with mortgages in 2022: $2,010 (0.7%) Median real estate property taxes paid for housing units with no mortgage in 2022: $940 (0.9%)
Averages for the 2020 tax year for zip code 33903, filed in 2021:
Average Adjusted Gross Income (AGI) in 2020: $57,684 (Individual Income Tax Returns)
Here:
$57,684
State:
$82,200
Salary/wage: $44,882 (reported on 65.3% of returns)
Here:
$44,882
State:
$58,347
(% of AGI for various income ranges: 1030.0% for AGIs below $25k, 3090.6% for AGIs $25k-50k, 5162.5% for AGIs $50k-75k, 7280.2% for AGIs $75k-100k, 13252.2% for AGIs $100k-200k, 70872.0% for AGIs over 200k)
Taxable interest for individuals: $1,884 (reported on 32.0% of returns)
This zip code:
$1,884
Florida:
$4,272
(% of AGI for various income ranges: 24.8% for AGIs below $25k, 33.7% for AGIs $25k-50k, 72.2% for AGIs $50k-75k, 192.1% for AGIs $75k-100k, 284.9% for AGIs $100k-200k, 2083.0% for AGIs over 200k)
Ordinary dividends: $7,739 (reported on 21.9% of returns)
Here:
$7,739
State:
$15,863
(% of AGI for various income ranges: 48.0% for AGIs below $25k, 65.1% for AGIs $25k-50k, 181.9% for AGIs $50k-75k, 300.8% for AGIs $75k-100k, 704.7% for AGIs $100k-200k, 9014.0% for AGIs over 200k)
Net capital gain/loss in AGI: +$19,490 (reported on 19.8% of returns)
Here:
+$19,490
State:
+$62,983
(% of AGI for various income ranges: 15.4% for AGIs below $25k, 48.6% for AGIs $25k-50k, 164.0% for AGIs $50k-75k, 394.0% for AGIs $75k-100k, 1319.1% for AGIs $100k-200k, 30939.0% for AGIs over 200k)
Profit/loss from business: +$10,767 (reported on 14.6% of returns)
Here:
+$10,767
State:
+$9,719
(% of AGI for various income ranges: 167.7% for AGIs below $25k, 141.1% for AGIs $25k-50k, 190.2% for AGIs $50k-75k, 202.9% for AGIs $75k-100k, 582.5% for AGIs $100k-200k, 3438.0% for AGIs over 200k)
Taxable individual retirement arrangement distribution: $18,726 (reported on 16.7% of returns)
33903:
$18,726
Florida:
$24,823
(% of AGI for various income ranges: 105.9% for AGIs below $25k, 200.0% for AGIs $25k-50k, 549.2% for AGIs $50k-75k, 1036.2% for AGIs $75k-100k, 2093.6% for AGIs $100k-200k, 5612.0% for AGIs over 200k)
Total itemized deductions: $33,524 (reported on 4.4% of returns)
Here:
$33,524
State:
$45,393
(% of AGI for various income ranges: 37.5% for AGIs below $25k, 91.7% for AGIs $25k-50k, 210.3% for AGIs $50k-75k, 334.4% for AGIs $75k-100k, 866.2% for AGIs $100k-200k, 5135.0% for AGIs over 200k)
Charity contributions: $9,885 (reported on 3.5% of returns)
Here:
$9,885
State:
$20,178
(% of AGI for various income ranges: 3.0% for AGIs below $25k, 10.9% for AGIs $25k-50k, 26.9% for AGIs $50k-75k, 72.9% for AGIs $75k-100k, 233.6% for AGIs $100k-200k, 1621.0% for AGIs over 200k)
Taxes paid: $6,180 (reported on 4.4% of returns)
33903:
$6,180
State:
$6,967
(% of AGI for various income ranges: 5.3% for AGIs below $25k, 15.2% for AGIs $25k-50k, 39.0% for AGIs $50k-75k, 65.2% for AGIs $75k-100k, 163.5% for AGIs $100k-200k, 932.0% for AGIs over 200k)
Earned income credit: $1,981 (reported on 15.7% of returns)
Here:
$1,981
State:
$2,306
(% of AGI for various income ranges: 83.2% for AGIs below $25k, 46.2% for AGIs $25k-50k)
Percentage of individuals using paid preparers for their 2020 taxes: 91.4%
Here:
91%
State:
92%
(% for various income ranges: 90.5% for AGIs below $25k, 91.8% for AGIs $25k-50k, 91.9% for AGIs $50k-75k, 90.8% for AGIs $75k-100k, 92.7% for AGIs $100k-200k, 94.1% for AGIs over 200k)
Averages for the 2012 tax year for zip code 33903, filed in 2013:
Average Adjusted Gross Income (AGI) in 2012: $43,620 (Individual Income Tax Returns)
Here:
$43,620
State:
$60,316
Salary/wage: $34,328 (reported on 63.5% of returns)
Here:
$34,328
State:
$45,277
(% of AGI for various income ranges: 54.9% for AGIs below $25k, 57.2% for AGIs $25k-50k, 48.1% for AGIs $50k-75k, 43.3% for AGIs $75k-100k, 50.1% for AGIs $100k-200k, 43.5% for AGIs over 200k)
Taxable interest for individuals: $2,034 (reported on 37.9% of returns)
This zip code:
$2,034
Florida:
$3,587
(% of AGI for various income ranges: 2.3% for AGIs below $25k, 1.4% for AGIs $25k-50k, 1.4% for AGIs $50k-75k, 1.5% for AGIs $75k-100k, 2.1% for AGIs $100k-200k, 2.0% for AGIs over 200k)
Ordinary dividends: $6,085 (reported on 26.6% of returns)
Here:
$6,085
State:
$12,831
(% of AGI for various income ranges: 6.5% for AGIs below $25k, 2.7% for AGIs $25k-50k, 2.7% for AGIs $50k-75k, 3.1% for AGIs $75k-100k, 3.5% for AGIs $100k-200k, 4.5% for AGIs over 200k)
Net capital gain/loss in AGI: +$7,546 (reported on 21.1% of returns)
Here:
+$7,546
State:
+$33,493
(% of AGI for various income ranges: 0.5% for AGIs $25k-50k, 0.4% for AGIs $50k-75k, 1.8% for AGIs $75k-100k, 3.3% for AGIs $100k-200k, 16.7% for AGIs over 200k)
Profit/loss from business: +$10,021 (reported on 12.5% of returns)
Here:
+$10,021
State:
+$10,012
(% of AGI for various income ranges: 6.5% for AGIs below $25k, 2.3% for AGIs $25k-50k, 1.6% for AGIs $50k-75k, 2.9% for AGIs $75k-100k, 2.3% for AGIs $100k-200k, 2.5% for AGIs over 200k)
Taxable individual retirement arrangement distribution: $13,449 (reported on 22.0% of returns)
33903:
$13,449
Florida:
$21,544
(% of AGI for various income ranges: 7.2% for AGIs below $25k, 5.7% for AGIs $25k-50k, 7.6% for AGIs $50k-75k, 8.1% for AGIs $75k-100k, 8.5% for AGIs $100k-200k, 3.9% for AGIs over 200k)
Self-employment retirement plans: $39,000 (reported on 0.2% of returns)
33903:
$39,000
Florida:
$20,611
Total itemized deductions: $20,323 (23% of AGI, reported on 18.6% of returns)
Here:
$20,323
State:
$25,533
Here:
22.6% of AGI
State:
18.0% of AGI
(% of AGI for various income ranges: 8.6% for AGIs below $25k, 7.2% for AGIs $25k-50k, 8.1% for AGIs $50k-75k, 9.2% for AGIs $75k-100k, 9.7% for AGIs $100k-200k, 9.6% for AGIs over 200k)
Charity contributions: $4,613 (reported on 15.1% of returns)
Here:
$4,613
State:
$5,698
(% of AGI for various income ranges: 0.9% for AGIs below $25k, 0.8% for AGIs $25k-50k, 1.4% for AGIs $50k-75k, 1.6% for AGIs $75k-100k, 1.7% for AGIs $100k-200k, 3.3% for AGIs over 200k)
Taxes paid: $4,640 (reported on 18.2% of returns)
33903:
$4,640
State:
$6,203
(% of AGI for various income ranges: 1.4% for AGIs below $25k, 1.4% for AGIs $25k-50k, 1.6% for AGIs $50k-75k, 2.0% for AGIs $75k-100k, 2.7% for AGIs $100k-200k, 2.6% for AGIs over 200k)
Earned income credit: $2,045 (reported on 16.9% of returns)
Here:
$2,045
State:
$2,372
(% of AGI for various income ranges: 4.9% for AGIs below $25k, 0.5% for AGIs $25k-50k)
Percentage of individuals using paid preparers for their 2012 taxes: 52.4%
Here:
52%
State:
54%
(% for various income ranges: 48.7% for AGIs below $25k, 50.0% for AGIs $25k-50k, 55.2% for AGIs $50k-75k, 62.9% for AGIs $75k-100k, 65.5% for AGIs $100k-200k, 86.7% for AGIs over 200k)
Averages for the 2004 tax year for zip code 33903, filed in 2005:
Average Adjusted Gross Income (AGI) in 2004: $38,084 (Individual Income Tax Returns)
Here:
$38,084
State:
$50,523
Salary/wage: $29,526 (reported on 68.1% of returns)
Here:
$29,526
State:
$39,563
(% of AGI for various income ranges: 127.7% for AGIs below $10k, 58.8% for AGIs $10k-25k, 62.0% for AGIs $25k-50k, 54.8% for AGIs $50k-75k, 51.4% for AGIs $75k-100k, 38.0% for AGIs over 100k)
Taxable interest for individuals: $2,474 (reported on 50.0% of returns)
This zip code:
$2,474
Florida:
$3,211
(% of AGI for various income ranges: 15.7% for AGIs below $10k, 4.3% for AGIs $10k-25k, 2.8% for AGIs $25k-50k, 2.9% for AGIs $50k-75k, 3.1% for AGIs $75k-100k, 2.8% for AGIs over 100k)
Taxable dividends: $3,363 (reported on 30.8% of returns)
Here:
$3,363
State:
$6,129
(% of AGI for various income ranges: 12.2% for AGIs below $10k, 3.0% for AGIs $10k-25k, 2.2% for AGIs $25k-50k, 2.4% for AGIs $50k-75k, 3.2% for AGIs $75k-100k, 2.6% for AGIs over 100k)
Net capital gain/loss: +$12,744 (reported on 26.0% of returns)
Here:
+$12,744
State:
+$27,205
(% of AGI for various income ranges: -6.2% for AGIs below $10k, 0.3% for AGIs $10k-25k, 0.8% for AGIs $25k-50k, 2.3% for AGIs $50k-75k, 5.0% for AGIs $75k-100k, 25.3% for AGIs over 100k)
Profit/loss from business: +$8,496 (reported on 12.1% of returns)
Here:
+$8,496
State:
+$10,634
(% of AGI for various income ranges: 7.8% for AGIs below $10k, 3.8% for AGIs $10k-25k, 2.1% for AGIs $25k-50k, 1.5% for AGIs $50k-75k, 2.5% for AGIs $75k-100k, 3.2% for AGIs over 100k)
IRA payment deduction: $3,277 (reported on 2.5% of returns)
33903:
$3,277
Florida:
$3,082
(% of AGI for various income ranges: 0.5% for AGIs below $10k, 0.2% for AGIs $10k-25k, 0.3% for AGIs $25k-50k, 0.2% for AGIs $50k-75k, 0.2% for AGIs $75k-100k, 0.2% for AGIs over 100k)
Self-employed pension: $11,000 (reported on 0.2% of returns)
Here:
$11,000
Florida:
$15,857
Total itemized deductions: $16,922 (23% of AGI, reported on 21.9% of returns)
Here:
$16,922
State:
$20,370
Here:
23.0% of AGI
State:
20.7% of AGI
(% of AGI for various income ranges: 24.2% for AGIs below $10k, 9.6% for AGIs $10k-25k, 9.5% for AGIs $25k-50k, 9.4% for AGIs $50k-75k, 10.5% for AGIs $75k-100k, 9.1% for AGIs over 100k)
Charity contributions deductions: $3,090 (4% of AGI, reported on 17.6% of returns)
Here:
$3,090
State:
$4,064
Here:
3.9% of AGI
State:
3.8% of AGI
(% of AGI for various income ranges: 1.4% for AGIs below $10k, 1.0% for AGIs $10k-25k, 1.2% for AGIs $25k-50k, 1.4% for AGIs $50k-75k, 1.9% for AGIs $75k-100k, 1.7% for AGIs over 100k)
Total tax: $5,734 (reported on 73.2% of returns)
33903:
$5,734
State:
$9,431
(% of AGI for various income ranges: 4.0% for AGIs below $10k, 3.6% for AGIs $10k-25k, 7.0% for AGIs $25k-50k, 9.5% for AGIs $50k-75k, 11.4% for AGIs $75k-100k, 19.1% for AGIs over 100k)
Earned income credit: $1,645 (reported on 14.3% of returns)
Here:
$1,645
State:
$1,808
Percentage of individuals using paid preparers for their 2004 taxes: 59.2%
Here:
59%
State:
60%
(% for various income ranges: 57.6% for AGIs below $10k, 59.3% for AGIs $10k-25k, 57.1% for AGIs $25k-50k, 57.2% for AGIs $50k-75k, 65.0% for AGIs $75k-100k, 75.1% for AGIs over 100k)
Likely homosexual households (counted as self-reported same-sex unmarried-partner households)
Lesbian couples: 0.1% of all households
Gay men: 0.2% of all households
Household received Food Stamps/SNAP in the past 12 months: 1,102 Household did not receive Food Stamps/SNAP in the past 12 months: 11,055
Women who had a birth in the past 12 months: 273 (215 now married, 62 unmarried) Women who did not have a birth in the past 12 months: 2,387 (879 now married, 1,507 unmarried)
Housing units in zip code 33903 with a mortgage: 2,759 (185 second mortgage, 171 both second mortgage and home equity loan) Houses without a mortgage: 138
Median monthly owner costs for units with a mortgage: $1,535 Median monthly owner costs for units without a mortgage: $586
Residents with income below the poverty level in 2022:
This zip code:
12.8%
Whole state:
12.7%
Residents with income below 50% of the poverty level in 2022:
This zip code:
8.0%
Whole state:
6.6%
Median number of rooms in houses and condos:
Here:
5.1
State:
5.9
Median number of rooms in apartments:
Here:
4.0
State:
4.2
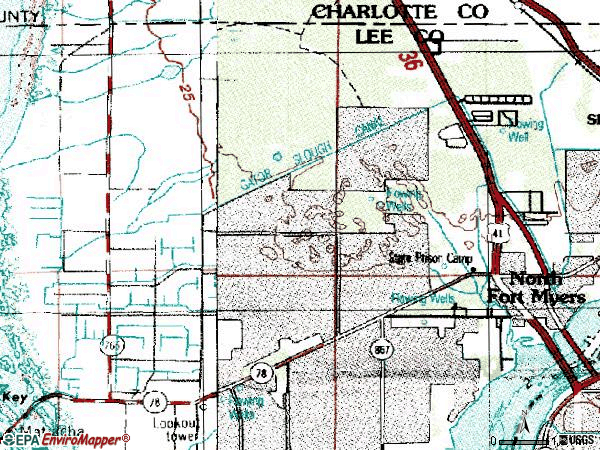
Notable locations in this zip code not listed on our city pages
Notable locations in zip code 33903: Six Lakes Country Club (A), Palms at Pompano Beach Golf Course (B), Palm - Aire Country Club (C), Palm Gardens Golf Course (D), Lee County Library System North Fort Myers Public Library (E), Shell Factory Museum (F), North Fort Myers Fire Control District Station 2 (G), Lee County Emergency Medical Services (H), Caloosahatchee Forestry Center (I), Lee County Sheriff's Office Alpha North District (J). Display/hide their locations on the map
Shopping Centers: Tropic Isles Shopping Center (1), Pine Island Shopping Center (2), Fort Myers Shopping Center (3), Eastgate Shopping Center (4). Display/hide their locations on the map
Churches in zip code 33903 include: Northside Baptist Church (A), North Fort Myers First Baptist Church (B), North Fort Myers Church of the Brethren (C), Holy Theotokos Monastery (D), Gulf Coast Cathedral of Praise Church of God (E), Church of God of North Fort Myers (F), Church of Christ (G), Bethany Evangelical Lutheran Church (H), All Souls Episcopal Church (I). Display/hide their locations on the map
In group quarters: 171 (-1 institutionalized population)
Size of family households: 4,593 2-persons, 786 3-persons, 533 4-persons, 268 5-persons, 20 6-persons, 34 7-or-more-persons
Size of nonfamily households: 5,245 1-person, 595 2-persons, 30 3-persons
926 married couples with children.
844 single-parent households (399 men, 445 women).
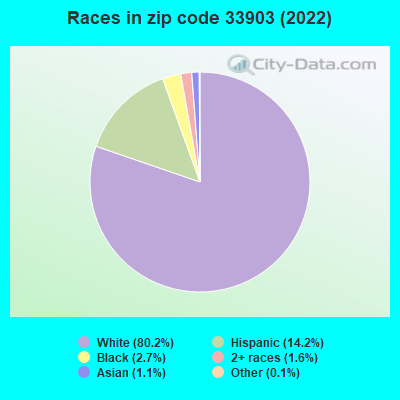
87.4% of residents of 33903 zip code speak English at home.
11.3% of residents speak Spanish at home (48% very well, 22% well, 13% not well, 18% not at all).
1.6% of residents speak other Indo-European language at home (72% very well, 22% well, 6% not well).
0.3% of residents speak Asian or Pacific Island language at home (84% very well, 16% not well).
0.2% of residents speak other language at home (25% well, 75% not at all).
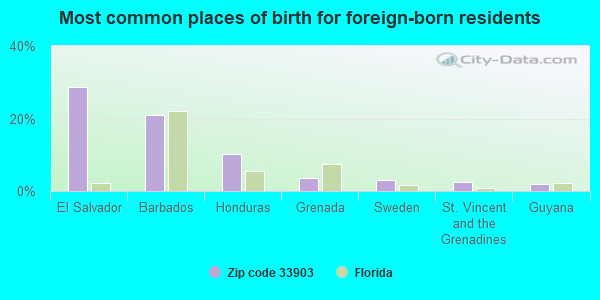
Foreign born population: 2,718 (11.8%) (43.4% of them are naturalized citizens)
This zip code:
11.8%
Whole state:
21.7%
29%El Salvador
21%Barbados
10%Honduras
3%Grenada
3%Sweden
3%St. Vincent and the Grenadines
2%Guyana
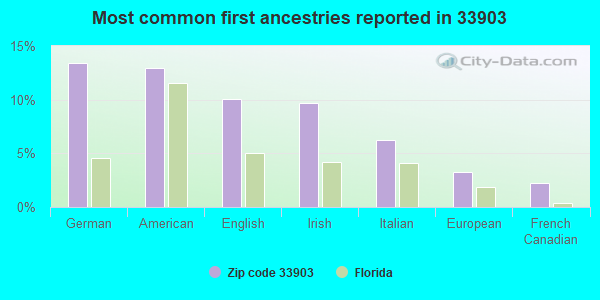
13%German
13%American
10%English
10%Irish
6%Italian
3%European
2%French Canadian
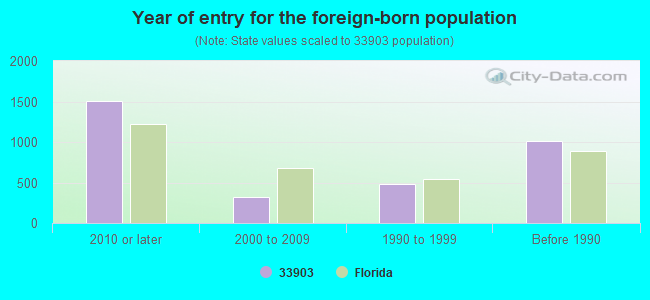
Year of entry for the foreign-born population
1,5062010 or later
3252000 to 2009
4861990 to 1999
1,012Before 1990
Major facilities with environmental interests located in this zip code:
OLDCASTLE PRECAST INC (2140 PONDELLA ROAD in N FT MYERS, FL)
STATE MASTER (FDM) - WAFR-FLG110021, INDUSTRIAL WASTEWATER PROGRAM, WAFR-FLR05A755, NPDES STORMWATER PROGRAM, WAFR-FLR10D261, WAFR-FLR10Q980, WAFR-FLR05A755, NPDES STORMWATER PERMIT, WAFR-FLR10D261, WAFR-FLR10Q980, National Pollutant Discharge Elimination System NON-MAJOR (Tracking pollutant discharge elimination systems) - permit National Pollutant Discharge Elimination System NON-MAJOR (Tracking pollutant discharge elimination systems) - permit TRI REPORTER (Tracking of toxic chemicals releasing facilities) Business SIC classification: CONCRETE PRODUCTS, EXCEPT BLOCK AND BRICK; READY-MIXED CONCRETE Organizations: AVALON ENGINEERING, INC., OLDCASTLE PRECAST, INC., OLD CASTLE PRECAST EAST INC. (CONTACT/APPLICANT)
, OLDCASTLE PRECAST E, INC. (CONTACT/APPLICANT)
, JAN OLSEN (CONTACT/OWNER)
, OLDCASTLE PRECAST, INC. (CONTACT/PERMIT)
, OLD CASTLE PRECAST EAST INC (CONTACT/PERMIT)
, HONC CONSTRUCTION INC (CONTACT/PERMIT)
Alternative names: OLD CASTLE PRECAST EAST INCorporated, OLDCASTLE PRECAST, INC. CONCRETE BATCH PLANT REPLACEMENT
PONDELLA CBP (2110 PONDELLA RD in N FT MYERS, FL)
STATE MASTER (FDM) - WAFR-FLG110028, INDUSTRIAL WASTEWATER PROGRAM, WAFR-FLR05A248, NPDES STORMWATER PROGRAM, NPDES STORMWATER PERMIT National Pollutant Discharge Elimination System NON-MAJOR (Tracking pollutant discharge elimination systems) - permit Business SIC classification: READY-MIXED CONCRETE Organizations: CREATIVE ENVIRONMENTAL SOLUTIONS, DUFRESNE-HENRY/CATTLEMEN RD, SCHWAB READY MIX, INC. (CONTACT/APPLICANT)
, RICHARD HIRE (CONTACT/OWNER)
, SCHWAB READY MIX INC (CONTACT/PERMIT)
Alternative names: SCHWAB READY MIX INC
MOBILE SERVICE STATION #02-554 (14991 N CLEVELAND AVE in NORTH FORT MYERS, FL)
STATE MASTER (FDM) - WAFR-FLG910536, INDUSTRIAL WASTEWATER PROGRAM National Pollutant Discharge Elimination System NON-MAJOR (Tracking pollutant discharge elimination systems) - permit Business SIC classification: GASOLINE SERVICE STATIONS Organizations: OHM REMEDIATION SERVICES CORP., FDOT (CONTACT/APPLICANT)
NORTH FORT MYERS HIGH SCHOOL (5000 ORANGE GROVE BLVD. in NORTH FT. MYERS, FL)
(Geographic Names Information System) (National Center for Education Statistics) - STATE ID-0311 Organizations: LEE COUNTY SCHOOL DISTRICT (SCHOOL DISTRICT)
ISLAND PINES CONDOMINIUM (1155 HANCOCK CREEK SOUTH BLVD in CAPE CORAL, FL)
National Pollutant Discharge Elimination System NON-MAJOR (Tracking pollutant discharge elimination systems) - permit National Pollutant Discharge Elimination System NON-MAJOR (Tracking pollutant discharge elimination systems) - permit Organizations: GREGG FOUS (CONTACT/OWNER)
, PATRICK MALOOLY (CONTACT/OWNER)
Alternative names: RIVERCREST PHASE 2, PARCELS O
J. COLIN ENGLISH ELEMENTARY SCHOOL (120 PINE ISLAND ROAD in NORTH FORT MYERS, FL)
(National Center for Education Statistics) - STATE ID-0261 Organizations: LEE COUNTY SCHOOL DISTRICT (SCHOOL DISTRICT)
HANCOCK CREEK ELEMENTARY SCHOOL (1601 SKYLINE DRIVE in NORTH FORT MYERS, FL)
(National Center for Education Statistics) - STATE ID-0801 Organizations: LEE COUNTY SCHOOL DISTRICT (SCHOOL DISTRICT)
CIRCLE K #7483 (780 PONDELLA RD in N. FT. MYERS, FL)
National Pollutant Discharge Elimination System NON-MAJOR (Tracking pollutant discharge elimination systems) - permit (Resource Conservation and Recovery Act (tracking hazardous waste)) Business SIC classification: GASOLINE SERVICE STATIONS Organizations: STEVE BELIN (CONTACT/OWNER)
HESS STATION #09337 (14010 N CLEVELAND AVE in N FT MYERS, FL)
National Pollutant Discharge Elimination System NON-MAJOR (Tracking pollutant discharge elimination systems) - permit (Resource Conservation and Recovery Act (tracking hazardous waste)) Organizations: THOMAS WHITAKER, ENV COORD (CONTACT/OWNER)
Alternative names: AMERADA HESS STATION #09337
NORTH FORT MYERS MEMBER SERVIC (565 PINE ISLAND ROAD in NORTH FORT MYERS, FL)
National Pollutant Discharge Elimination System NON-MAJOR (Tracking pollutant discharge elimination systems) - permit Organizations: EARL BRENDLE (CONTACT/OWNER)
PRECISION ECONOWIND INCORPORATED (8940 N. FORK DR. in N FT MYERS, FL)
AIR SYNTHETIC MINOR (AIRS/AFS) CRITERIA AND HAZARDOUS AIR POLLUTANT INVENTORY (Inventory of air pollution sources) Small Quantity Generators, between 100 kg and 1000 kg of hazardous waste/month (Resource Conservation and Recovery Act (tracking hazardous waste)) - notification TRI REPORTER (Tracking of toxic chemicals releasing facilities) Business SIC classification: ELECTRONIC COILS, TRANSFORMERS, AND OTHER INDUCTORS Business NAICS classification: ELECTRONIC COIL, TRANSFORMER, AND OTHER INDUCTOR MANUFACTURING. Organizations: TINGLEY TERRY MGR (CONTACT/OWNER)
NE 24TH LN PRIVATE WAREHOUSE I (NE 24TH LN in CAPE CORAL, FL)
National Pollutant Discharge Elimination System NON-MAJOR (Tracking pollutant discharge elimination systems) - permit Organizations: MICHAEL POWELL (CONTACT/OWNER)
Housing units lacking complete plumbing facilities: 0.9% Housing units lacking complete kitchen facilities: 1.2%
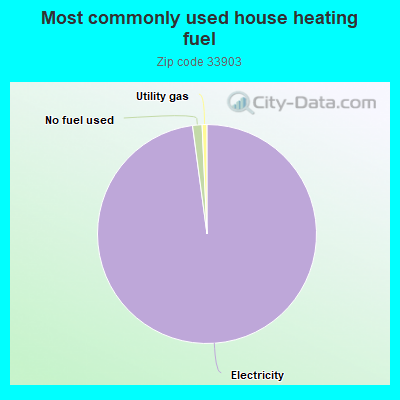
97.3%Electricity
1.4%No fuel used
0.7%Utility gas
Population in 1990: 20,015. Population change in the 1990s: +3,092 (+15.4%).
Place of birth for U.S.-born residents:
This state: 3,842
Northeast: 6,242
Midwest: 7,031
South: 2,071
West: 637
57% of the 33903 zip code residents lived in the same house 5 years ago. Out of people who lived in different houses, 48% lived in this county. Out of people who lived in different counties, 50% lived in Florida.
87% of the 33903 zip code residents lived in the same house 1 year ago. Out of people who lived in different houses, 49% moved from this county. Out of people who lived in different houses, 7% moved from different county within same state. Out of people who lived in different houses, 37% moved from different state. Out of people who lived in different houses, 6% moved from abroad.
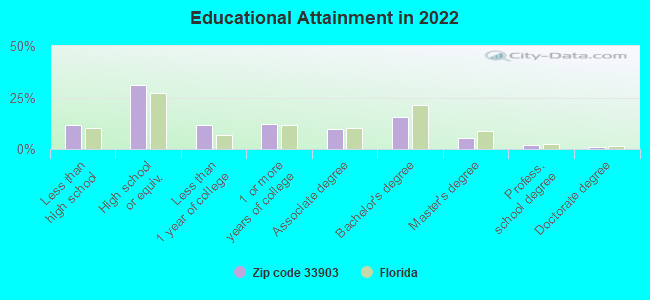
Private vs. public school enrollment:
Students in private schools in grades 1 to 8 (elementary and middle school): 55
Here:
3.8%
Florida:
15.8%
Students in private schools in grades 9 to 12 (high school):
Here:
0.0%
Florida:
12.9%
Students in private undergraduate colleges: 76
Here:
15.7%
Florida:
23.6%
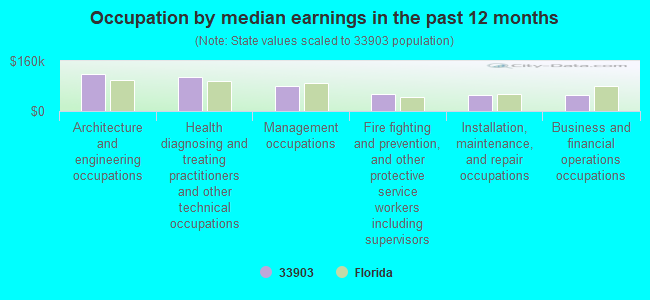
Occupation by median earnings in the past 12 months ($)
116,913Architecture and engineering occupations
108,476Health diagnosing and treating practitioners and other technical occupations
81,086Management occupations
55,826Fire fighting and prevention, and other protective service workers including supervisors
52,400Installation, maintenance, and repair occupations
51,657Business and financial operations occupations
Companies with federal contracts located in this zip code:
SCOTTIE'S CANVAS & MARINE OUTF (2211 N TAMIAMI TRAIL in FORT MYERS, FL; small business)
$22,000 with Air Force for Draperies, Awnings, and Shades. Signed on 2004-11-09. Completion date: 2005-02-01.
RIVERS EDGE MOBILE HOME PARK (1064 N. TAMIAMI TRAIL in NORTH FORT MYERS, FL; small business) : $7,863 in 3 contractsfrom 2005 to 2006
$7,560 with Federal Emergency Management Agency for Lease or Rental of Facilities -- Parking Facilities Conservation. Signed on 2005-12-22. Effective on 2005-11-07. Completion date: 2006-09-30.
$1,050 with Federal Emergency Management Agency for Lease or Rental of Facilities -- Other Non-Building Facilities. Signed on 2006-09-18. Effective on 2006-10-01. Completion date: 2006-12-31.
-$747 with Federal Emergency Management Agency for Lease or Rental of Facilities -- Parking Facilities Conservation. Signed on 2006-08-13. Effective on 2006-07-26. Completion date: 2006-09-30.
BALLARD, DANNY (9521 LITTLETON in FORT MYERS, FL; small business)
$4,860 with Army for Food Services. Signed on 2003-07-15. Completion date: 2003-07-29.
Top industries in this zip code by the number of employees in 2005:
2002 - 2018 National Fire Incident Reporting System (NFIRS) incidents
According to the data from the years 2002 - 2018 the average number of fire incidents per year is 24. The highest number of fires - 76 took place in 2002, and the least - 2 in 2005. The data has a dropping trend.
When looking into fire subcategories, the most incidents belonged to: Outside Fires (57.8%), and Structure Fires (23.5%).
Fire incident types reported to NFIRS in Zip Code 33903


 Nearest zip codes: 33909, 33990, 33901, 33916, 33917, 33904.


 According to the data from the years 2002 - 2018 the average number of fire incidents per year is 24. The highest number of fires - 76 took place in 2002, and the least - 2 in 2005. The data has a dropping trend.
 When looking into fire subcategories, the most incidents belonged to: Outside Fires (57.8%), and Structure Fires (23.5%).