Estimated zip code population in 2022: 40,354 Zip code population in 2010: 31,203 Zip code population in 2000: 25,891
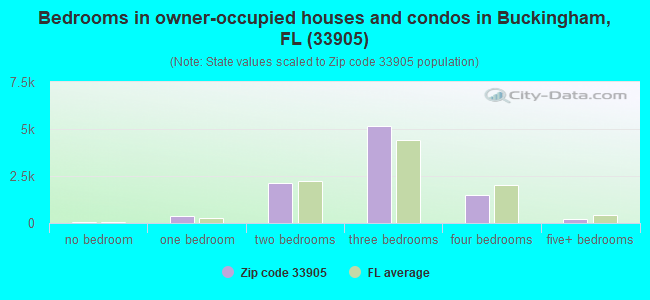
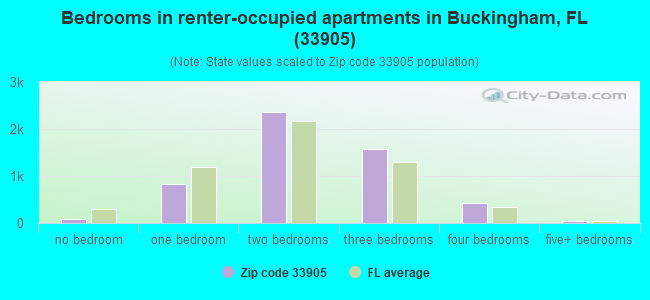
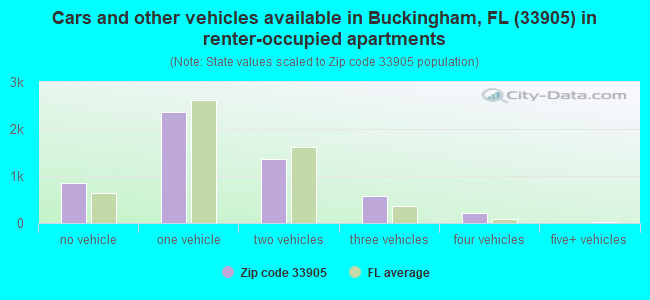
Houses and condos: 17,046 Renter-occupied apartments: 5,350
% of renters here:
36%
State:
33%
March 2022 cost of living index in zip code 33905: 91.5 (less than average, U.S. average is 100)
Land area: 42.0 sq. mi. Water area: 3.2 sq. mi.
Population density: 960 people per square mile
(low).
OSM Map
General Map
Google Map
MSN Map
OSM Map
General Map
Google Map
MSN Map
OSM Map
General Map
Google Map
MSN Map
OSM Map
General Map
Google Map
MSN Map
Please wait while loading the map...
Real estate property taxes paid for housing units in 2022:
This zip code:
0.7% ($1,829)
Florida:
0.7% ($2,529)
Median real estate property taxes paid for housing units with mortgages in 2022: $2,005 (0.7%) Median real estate property taxes paid for housing units with no mortgage in 2022: $1,626 (0.7%)
Averages for the 2020 tax year for zip code 33905, filed in 2021:
Average Adjusted Gross Income (AGI) in 2020: $60,934 (Individual Income Tax Returns)
Here:
$60,934
State:
$82,200
Salary/wage: $47,354 (reported on 79.5% of returns)
Here:
$47,354
State:
$58,347
(% of AGI for various income ranges: 1270.6% for AGIs below $25k, 3776.0% for AGIs $25k-50k, 6680.4% for AGIs $50k-75k, 9408.9% for AGIs $75k-100k, 15684.7% for AGIs $100k-200k, 60948.4% for AGIs over 200k)
Taxable interest for individuals: $2,131 (reported on 22.6% of returns)
This zip code:
$2,131
Florida:
$4,272
(% of AGI for various income ranges: 11.1% for AGIs below $25k, 17.9% for AGIs $25k-50k, 36.9% for AGIs $50k-75k, 91.2% for AGIs $75k-100k, 207.5% for AGIs $100k-200k, 2040.0% for AGIs over 200k)
Ordinary dividends: $7,867 (reported on 15.2% of returns)
Here:
$7,867
State:
$15,863
(% of AGI for various income ranges: 20.0% for AGIs below $25k, 35.5% for AGIs $25k-50k, 112.0% for AGIs $50k-75k, 228.9% for AGIs $75k-100k, 519.9% for AGIs $100k-200k, 5236.3% for AGIs over 200k)
Net capital gain/loss in AGI: +$29,283 (reported on 14.7% of returns)
Here:
+$29,283
State:
+$62,983
(% of AGI for various income ranges: 6.2% for AGIs below $25k, 24.7% for AGIs $25k-50k, 105.2% for AGIs $50k-75k, 333.5% for AGIs $75k-100k, 1125.4% for AGIs $100k-200k, 31281.6% for AGIs over 200k)
Profit/loss from business: +$10,309 (reported on 17.7% of returns)
Here:
+$10,309
State:
+$9,719
(% of AGI for various income ranges: 170.0% for AGIs below $25k, 140.8% for AGIs $25k-50k, 211.8% for AGIs $50k-75k, 263.9% for AGIs $75k-100k, 537.5% for AGIs $100k-200k, 4097.9% for AGIs over 200k)
Taxable individual retirement arrangement distribution: $29,420 (reported on 9.2% of returns)
33905:
$29,420
Florida:
$24,823
(% of AGI for various income ranges: 53.9% for AGIs below $25k, 87.5% for AGIs $25k-50k, 238.8% for AGIs $50k-75k, 527.0% for AGIs $75k-100k, 1619.0% for AGIs $100k-200k, 9297.4% for AGIs over 200k)
Self-employed (Keogh) retirement plans: $24,425 (reported on 0.2% of returns)
33905:
$24,425
Florida:
$29,694
(% of AGI for various income ranges: 514.2% for AGIs over 200k)
Total itemized deductions: $36,600 (reported on 5.2% of returns)
Here:
$36,600
State:
$45,393
(% of AGI for various income ranges: 29.3% for AGIs below $25k, 74.8% for AGIs $25k-50k, 303.8% for AGIs $50k-75k, 353.5% for AGIs $75k-100k, 853.8% for AGIs $100k-200k, 6717.9% for AGIs over 200k)
Charity contributions: $11,692 (reported on 4.1% of returns)
Here:
$11,692
State:
$20,178
(% of AGI for various income ranges: 2.2% for AGIs below $25k, 9.9% for AGIs $25k-50k, 43.6% for AGIs $50k-75k, 51.3% for AGIs $75k-100k, 193.5% for AGIs $100k-200k, 2580.0% for AGIs over 200k)
Taxes paid: $6,530 (reported on 5.0% of returns)
33905:
$6,530
State:
$6,967
(% of AGI for various income ranges: 5.0% for AGIs below $25k, 12.4% for AGIs $25k-50k, 47.7% for AGIs $50k-75k, 70.5% for AGIs $75k-100k, 181.5% for AGIs $100k-200k, 1027.9% for AGIs over 200k)
Earned income credit: $2,493 (reported on 20.0% of returns)
Here:
$2,493
State:
$2,306
(% of AGI for various income ranges: 126.1% for AGIs below $25k, 73.5% for AGIs $25k-50k, 1.3% for AGIs $50k-75k)
Percentage of individuals using paid preparers for their 2020 taxes: 88.7%
Here:
89%
State:
92%
(% for various income ranges: 86.6% for AGIs below $25k, 88.6% for AGIs $25k-50k, 90.0% for AGIs $50k-75k, 90.3% for AGIs $75k-100k, 91.8% for AGIs $100k-200k, 92.5% for AGIs over 200k)
Averages for the 2012 tax year for zip code 33905, filed in 2013:
Average Adjusted Gross Income (AGI) in 2012: $43,356 (Individual Income Tax Returns)
Here:
$43,356
State:
$60,316
Salary/wage: $34,681 (reported on 82.9% of returns)
Here:
$34,681
State:
$45,277
(% of AGI for various income ranges: 78.0% for AGIs below $25k, 83.5% for AGIs $25k-50k, 72.3% for AGIs $50k-75k, 71.2% for AGIs $75k-100k, 60.5% for AGIs $100k-200k, 34.7% for AGIs over 200k)
Taxable interest for individuals: $2,339 (reported on 20.7% of returns)
This zip code:
$2,339
Florida:
$3,587
(% of AGI for various income ranges: 0.9% for AGIs below $25k, 0.6% for AGIs $25k-50k, 0.7% for AGIs $50k-75k, 0.8% for AGIs $75k-100k, 1.7% for AGIs $100k-200k, 1.9% for AGIs over 200k)
Ordinary dividends: $6,862 (reported on 13.2% of returns)
Here:
$6,862
State:
$12,831
(% of AGI for various income ranges: 1.7% for AGIs below $25k, 1.0% for AGIs $25k-50k, 1.7% for AGIs $50k-75k, 1.8% for AGIs $75k-100k, 2.9% for AGIs $100k-200k, 3.3% for AGIs over 200k)
Net capital gain/loss in AGI: +$8,924 (reported on 10.8% of returns)
Here:
+$8,924
State:
+$33,493
(% of AGI for various income ranges: 0.4% for AGIs $25k-50k, 1.2% for AGIs $50k-75k, 1.1% for AGIs $75k-100k, 2.4% for AGIs $100k-200k, 7.4% for AGIs over 200k)
Profit/loss from business: +$9,986 (reported on 13.8% of returns)
Here:
+$9,986
State:
+$10,012
(% of AGI for various income ranges: 8.8% for AGIs below $25k, 1.9% for AGIs $25k-50k, 1.8% for AGIs $50k-75k, 1.5% for AGIs $75k-100k, 2.3% for AGIs $100k-200k, 3.0% for AGIs over 200k)
Taxable individual retirement arrangement distribution: $23,197 (reported on 9.1% of returns)
33905:
$23,197
Florida:
$21,544
(% of AGI for various income ranges: 2.3% for AGIs below $25k, 2.0% for AGIs $25k-50k, 4.0% for AGIs $50k-75k, 4.5% for AGIs $75k-100k, 7.5% for AGIs $100k-200k, 8.8% for AGIs over 200k)
Self-employment retirement plans: $16,600 (reported on 0.2% of returns)
33905:
$16,600
Florida:
$20,611
Total itemized deductions: $22,214 (23% of AGI, reported on 19.8% of returns)
Here:
$22,214
State:
$25,533
Here:
23.1% of AGI
State:
18.0% of AGI
(% of AGI for various income ranges: 6.3% for AGIs below $25k, 11.2% for AGIs $25k-50k, 9.3% for AGIs $50k-75k, 10.5% for AGIs $75k-100k, 12.3% for AGIs $100k-200k, 10.4% for AGIs over 200k)
Charity contributions: $4,518 (reported on 12.4% of returns)
Here:
$4,518
State:
$5,698
(% of AGI for various income ranges: 0.5% for AGIs below $25k, 0.7% for AGIs $25k-50k, 1.2% for AGIs $50k-75k, 1.5% for AGIs $75k-100k, 1.7% for AGIs $100k-200k, 2.2% for AGIs over 200k)
Taxes paid: $5,408 (reported on 18.7% of returns)
33905:
$5,408
State:
$6,203
(% of AGI for various income ranges: 0.9% for AGIs below $25k, 1.9% for AGIs $25k-50k, 1.6% for AGIs $50k-75k, 2.0% for AGIs $75k-100k, 3.4% for AGIs $100k-200k, 3.7% for AGIs over 200k)
Earned income credit: $2,608 (reported on 24.7% of returns)
Here:
$2,608
State:
$2,372
(% of AGI for various income ranges: 8.0% for AGIs below $25k, 1.2% for AGIs $25k-50k)
Percentage of individuals using paid preparers for their 2012 taxes: 45.9%
Here:
46%
State:
54%
(% for various income ranges: 44.6% for AGIs below $25k, 39.8% for AGIs $25k-50k, 49.6% for AGIs $50k-75k, 55.7% for AGIs $75k-100k, 64.9% for AGIs $100k-200k, 72.7% for AGIs over 200k)
Averages for the 2004 tax year for zip code 33905, filed in 2005:
Average Adjusted Gross Income (AGI) in 2004: $38,123 (Individual Income Tax Returns)
Here:
$38,123
State:
$50,523
Salary/wage: $32,082 (reported on 85.4% of returns)
Here:
$32,082
State:
$39,563
(% of AGI for various income ranges: 102.5% for AGIs below $10k, 81.3% for AGIs $10k-25k, 84.2% for AGIs $25k-50k, 79.7% for AGIs $50k-75k, 74.4% for AGIs $75k-100k, 47.8% for AGIs over 100k)
Taxable interest for individuals: $1,910 (reported on 30.7% of returns)
This zip code:
$1,910
Florida:
$3,211
(% of AGI for various income ranges: 3.5% for AGIs below $10k, 1.8% for AGIs $10k-25k, 1.0% for AGIs $25k-50k, 1.0% for AGIs $50k-75k, 1.5% for AGIs $75k-100k, 2.1% for AGIs over 100k)
Taxable dividends: $2,670 (reported on 15.3% of returns)
Here:
$2,670
State:
$6,129
(% of AGI for various income ranges: 2.9% for AGIs below $10k, 1.2% for AGIs $10k-25k, 0.7% for AGIs $25k-50k, 0.9% for AGIs $50k-75k, 1.0% for AGIs $75k-100k, 1.3% for AGIs over 100k)
Net capital gain/loss: +$17,083 (reported on 13.0% of returns)
Here:
+$17,083
State:
+$27,205
(% of AGI for various income ranges: -3.0% for AGIs below $10k, -0.2% for AGIs $10k-25k, 0.6% for AGIs $25k-50k, 1.7% for AGIs $50k-75k, 3.2% for AGIs $75k-100k, 17.8% for AGIs over 100k)
Profit/loss from business: +$10,054 (reported on 12.3% of returns)
Here:
+$10,054
State:
+$10,634
(% of AGI for various income ranges: 6.6% for AGIs below $10k, 5.5% for AGIs $10k-25k, 2.2% for AGIs $25k-50k, 1.6% for AGIs $50k-75k, 2.6% for AGIs $75k-100k, 4.1% for AGIs over 100k)
IRA payment deduction: $3,141 (reported on 2.0% of returns)
33905:
$3,141
Florida:
$3,082
(% of AGI for various income ranges: 0.1% for AGIs $10k-25k, 0.2% for AGIs $25k-50k, 0.2% for AGIs $50k-75k, 0.2% for AGIs $75k-100k, 0.2% for AGIs over 100k)
Self-employed pension: $10,750 (reported on 0.3% of returns)
Here:
$10,750
Florida:
$15,857
Total itemized deductions: $16,526 (22% of AGI, reported on 22.8% of returns)
Here:
$16,526
State:
$20,370
Here:
22.4% of AGI
State:
20.7% of AGI
(% of AGI for various income ranges: 10.7% for AGIs below $10k, 7.7% for AGIs $10k-25k, 10.4% for AGIs $25k-50k, 11.5% for AGIs $50k-75k, 11.8% for AGIs $75k-100k, 8.7% for AGIs over 100k)
Charity contributions deductions: $3,175 (4% of AGI, reported on 17.7% of returns)
Here:
$3,175
State:
$4,064
Here:
3.9% of AGI
State:
3.8% of AGI
(% of AGI for various income ranges: 0.6% for AGIs below $10k, 0.6% for AGIs $10k-25k, 1.1% for AGIs $25k-50k, 1.6% for AGIs $50k-75k, 1.9% for AGIs $75k-100k, 2.1% for AGIs over 100k)
Total tax: $6,274 (reported on 67.1% of returns)
33905:
$6,274
State:
$9,431
(% of AGI for various income ranges: 2.9% for AGIs below $10k, 3.4% for AGIs $10k-25k, 6.2% for AGIs $25k-50k, 8.7% for AGIs $50k-75k, 11.0% for AGIs $75k-100k, 21.3% for AGIs over 100k)
Earned income credit: $1,920 (reported on 25.1% of returns)
Here:
$1,920
State:
$1,808
Percentage of individuals using paid preparers for their 2004 taxes: 60.6%
Here:
61%
State:
60%
(% for various income ranges: 56.0% for AGIs below $10k, 63.9% for AGIs $10k-25k, 59.0% for AGIs $25k-50k, 58.9% for AGIs $50k-75k, 61.4% for AGIs $75k-100k, 71.3% for AGIs over 100k)
Likely homosexual households (counted as self-reported same-sex unmarried-partner households)
Lesbian couples: 0.1% of all households
Gay men: 0.1% of all households
Household received Food Stamps/SNAP in the past 12 months: 1,366 Household did not receive Food Stamps/SNAP in the past 12 months: 13,513
Women who had a birth in the past 12 months: 506 (327 now married, 178 unmarried) Women who did not have a birth in the past 12 months: 7,649 (2,964 now married, 4,684 unmarried)
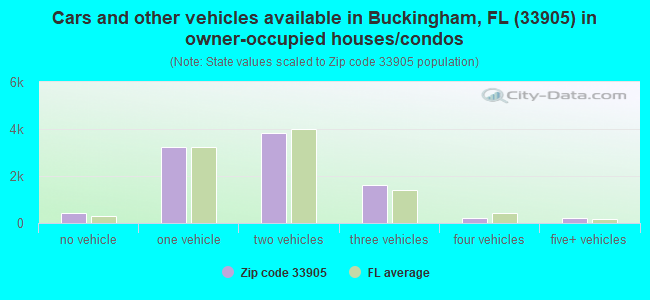
Housing units in zip code 33905 with a mortgage: 4,595 (237 second mortgage, 183 both second mortgage and home equity loan) Houses without a mortgage: 141
Median monthly owner costs for units with a mortgage: $1,437 Median monthly owner costs for units without a mortgage: $460
Residents with income below the poverty level in 2022:
This zip code:
11.7%
Whole state:
12.7%
Residents with income below 50% of the poverty level in 2022:
This zip code:
6.1%
Whole state:
6.6%
Median number of rooms in houses and condos:
Here:
5.7
State:
5.9
Median number of rooms in apartments:
Here:
4.4
State:
4.2
Notable locations in this zip code not listed on our city pages
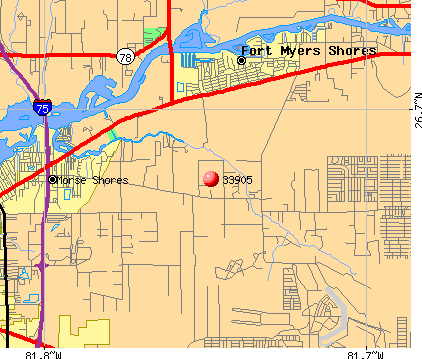
Notable locations in zip code 33905: Fort Myers Power Plant (A), Morse Shores (B), East Fort Myers (C), Fort Myers Shores Fire Department (D), Tice Fire Protection and Rescue District Station 1 (E), City of Fort Myers Fire and Rescue Station 4 (F), Lee County Emergency Medical Services Station 26 (G), Tice Fire Protection and Rescue District Station 2 (H), Caloosahatchee Forestry Center (I), Lee County Sheriff's Office (J), Lee County Sheriff's Office Stockade (K), Lee County Emergency Management Office (L), Lee County Sheriff's Office Community Programs Unit (M), Lee County Sheriff's Office Core Division (N), Olga Community Center (O), Lee County Public Library System Riverdale Branch Library (P). Display/hide their locations on the map
Churches in zip code 33905 include: Zion Hill Baptist Church (A), Tice United Methodist Church (B), Tabernacle Christian Church (C), Russell Park Baptist Church (D), Palm Beach Boulevard Church of the Nazarene (E), Olga and Fort Myers Shores United Methodist Church (F), Lighthouse Baptist Church (G), Iglesia De Dios Pentecostal Church (H), Crossroads Baptist Church (I). Display/hide their locations on the map
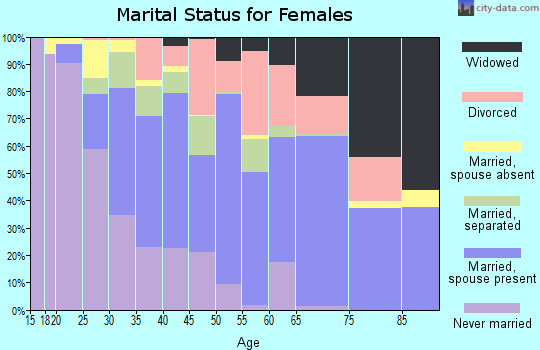
4,840 married couples with children.
2,177 single-parent households (641 men, 1,536 women).
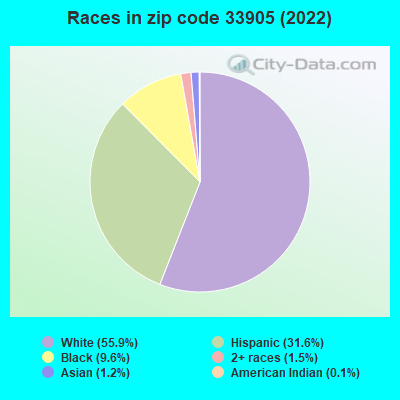
68.7% of residents of 33905 zip code speak English at home.
28.3% of residents speak Spanish at home (44% very well, 15% well, 20% not well, 21% not at all).
2.5% of residents speak other Indo-European language at home (83% very well, 14% well, 3% not well).
0.7% of residents speak Asian or Pacific Island language at home (63% very well, 8% well, 17% not well, 12% not at all).
0.4% of residents speak other language at home (98% very well, 1% well, 1% not well).
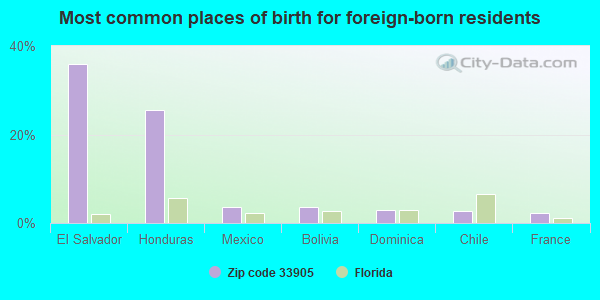
Foreign born population: 7,939 (19.7%) (29.6% of them are naturalized citizens)
This zip code:
19.7%
Whole state:
21.7%
36%El Salvador
26%Honduras
4%Mexico
4%Bolivia
3%Dominica
3%Chile
2%France
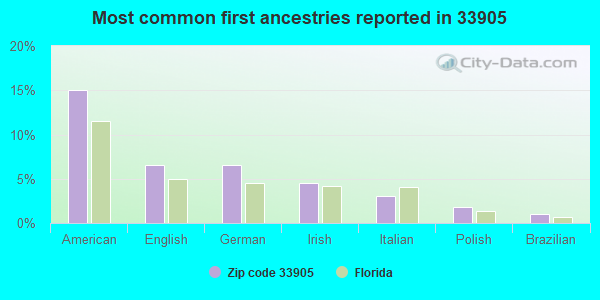
15%American
7%English
7%German
4%Irish
3%Italian
2%Polish
1%Brazilian
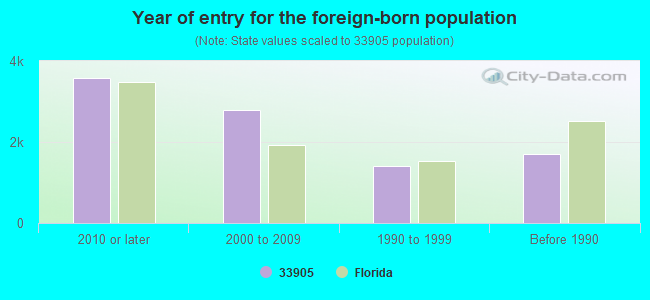
Year of entry for the foreign-born population
3,5882010 or later
2,7782000 to 2009
1,4081990 to 1999
1,699Before 1990
Major facilities with environmental interests located in this zip code:
LEE COUNTY DEPT. OF SOLID WASTE MGT. (10500 BUCKINGHAM ROAD in FORT MYERS, FL)
AIR MAJOR (AIRS/AFS) CRITERIA AND HAZARDOUS AIR POLLUTANT INVENTORY (Inventory of air pollution sources) National Pollutant Discharge Elimination System NON-MAJOR (Tracking pollutant discharge elimination systems) - permit National Pollutant Discharge Elimination System NON-MAJOR (Tracking pollutant discharge elimination systems) - permit National Pollutant Discharge Elimination System NON-MAJOR (Tracking pollutant discharge elimination systems) - permit AIR MAJOR ("Best Available" air pollution technologies tracking) (Resource Conservation and Recovery Act (tracking hazardous waste)) Business SIC classification: ELECTRIC SERVICES; ELECTRIC AND OTHER SERVICES COMBINED; REFUSE SYSTEMS Organizations: LINDSEY SAMPSON (CONTACT/OWNER)
, THOMAS ERIKSEN, MGR (CONTACT/OWNER)
Alternative names: LEE CO RESOURCE & RECOVERY, LEE COUNTY ENERGY RECOVERY FACILITY, LEE COUNTY RESOURCE RECOVERY, LEE COUNTY SOLID WASTE DEPT., LEE COUNTY SOLID WASTE RESOURC, LEE COUNTY SOLID WASTE RESOURCE RECOVERY, LEE COUNTY SOLID WASTE TRANSFE, LEE COUNTY WASTE-TO-ENERGY FACILITY, LEE COUNTY ENERGY RECOVERY FACILITY, LEE COUNTY WASTE-TO-ENERGY FACILITY, TREETOPS
RINKER MATERIALS - CONCRETE PI (2040 ORTIZ AVE in FORT MYERS, FL)
STATE MASTER (FDM) - WAFR-FLR05B246, NPDES STORMWATER PROGRAM, NPDES STORMWATER PERMIT National Pollutant Discharge Elimination System NON-MAJOR (Tracking pollutant discharge elimination systems) - permit (Resource Conservation and Recovery Act (tracking hazardous waste)) Business SIC classification: CONCRETE PRODUCTS, EXCEPT BLOCK AND BRICK Organizations: CSR AMERICA INC (CONTACT/APPLICANT)
, RINKER MATERIALS CORPORATION (CONTACT/APPLICANT)
, RONALD METZGER (CONTACT/OWNER)
, CSR AMERICA INC (CONTACT/OWNER)
, RINKER MATERIALS CORPORATION (CONTACT/PERMIT)
, CSR RINKER MATERIALS (CONTACT/PERMIT)
Alternative names: CSR HYDRO CONDUIT FT MYERS, HYDRO CONDUIT CORP, HYDROCONDUIT FT MYERS, RINKER MATERIALS - CONCRETE PIPE DIV - FT MYERS, RINKER MATERIALS - CONCRETE PIPE DIVISION - PLANT CITY
CON-WAY FREIGHT (1870 BENCHMARK AVE in FORT MYERS, FL)
STATE MASTER (FDM) - WAFR-FLR05C550, NPDES STORMWATER PROGRAM, NPDES STORMWATER PERMIT National Pollutant Discharge Elimination System NON-MAJOR (Tracking pollutant discharge elimination systems) - permit Business SIC classification: TRUCKING, EXCEPT LOCAL Organizations: CNF INC (CONTACT/APPLICANT)
, CON-WAY TRANSPORTATION SERVICES (CONTACT/APPLICANT)
, ROBERT CLARK (CONTACT/OWNER)
, CNF INC (CONTACT/PERMIT)
, CNF TRANSPORTATION (CONTACT/PERMIT)
Alternative names: CNF TRANSPORTATION, CON-WAY SOUTHERN EXPRESS
RUSSELLS CLUTCH & REPAIR INC (2030 ORTIZ AVE in FORT MYERS, FL)
STATE MASTER (FDM) - CHAZ-FLD081950214, HAZARDOUS WASTE REGULATION PROGRAM (Resource Conservation and Recovery Act (tracking hazardous waste)) Business SIC classification: GENERAL AUTOMOTIVE REPAIR SHOPS Business NAICS classification: GENERAL AUTOMOTIVE REPAIR. Organizations: HAROLD GOFF (CONTACT/OWNER)
Alternative names: FORT MYERS CLUTCH INC
GULF COAST CENTER (5820 BUCKINGHAM ROAD in FORT MYERS, FL)
(Resource Conservation and Recovery Act (tracking hazardous waste)) COMMUNITY WATER SYSTEM (SDWIS) - SDWIS-FL5360275 8001, WATER TREATMENT PLANT Organizations: TROY PIGOTT, MAINT SUPERVISOR (CONTACT/OWNER)
LEE MIDDLE SCHOOL (1333 MARSH AVENUE in FT MYERS, FL)
(Geographic Names Information System) (National Center for Education Statistics) - STATE ID-0271 Organizations: LEE COUNTY SCHOOL DISTRICT (SCHOOL DISTRICT)
RIVERDALE HIGH SCHOOL (2600 BUCKINGHAM ROAD in FT. MYERS, FL)
(Geographic Names Information System) (National Center for Education Statistics) - STATE ID-0591 Organizations: LEE COUNTY SCHOOL DISTRICT (SCHOOL DISTRICT)
HORSE CREEK (12251 ORANGE RIVER BLVD in FORT MYERS, FL)
National Pollutant Discharge Elimination System NON-MAJOR (Tracking pollutant discharge elimination systems) - permit National Pollutant Discharge Elimination System NON-MAJOR (Tracking pollutant discharge elimination systems) - permit Organizations: RONALO FELTS (CONTACT/OWNER)
, DAN DODRILL (CONTACT/OWNER)
ORANGE RIVER ELEMENTARY SCHOOL (4501 UNDERWOOD DRIVE in FT MYERS, FL)
(National Center for Education Statistics) - STATE ID-0321 Organizations: LEE COUNTY SCHOOL DISTRICT (SCHOOL DISTRICT)
DAMRON-LKQ AUTO PARTS INC (5001 STATE RD 82 in FORT MYERS, FL)
National Pollutant Discharge Elimination System NON-MAJOR (Tracking pollutant discharge elimination systems) - permit (Resource Conservation and Recovery Act (tracking hazardous waste)) Business SIC classification: MOTOR VEHICLE SUPPLIES AND NEW PARTS Organizations: JOHN CILENTLO (CONTACT/OWNER)
, LKQ CORP (CONTACT/OWNER)
Alternative names: DAMRON AUTO PARTS, LKQ CORP
MICHIGAN MONTESSORI INTERNATIONAL ACADEMY (FORMERL (4312 MICHIGAN AVENUE in FT MYERS, FL)
(National Center for Education Statistics) - STATE ID-0411 Organizations: LEE COUNTY SCHOOL DISTRICT (SCHOOL DISTRICT)
HEADSTART (4312 MICHIGAN AVENUE in FT MYERS, FL)
(National Center for Education Statistics) - STATE ID-9123 Organizations: LEE COUNTY SCHOOL DISTRICT (SCHOOL DISTRICT)
HJ HEINZ LP (5521 DIVISION DRIVE in FORT MYERS, FL)
National Pollutant Discharge Elimination System NON-MAJOR (Tracking pollutant discharge elimination systems) - permit (Resource Conservation and Recovery Act (tracking hazardous waste)) Business SIC classification: FROZEN SPECIALTIES Business NAICS classification: FLOUR MILLING. Organizations: THOMAS BRAHLER (CONTACT/OWNER)
, H J HEINZ COMPANY (CONTACT/OWNER)
Alternative names: HEINZ FROZEN FOOD CO, HEINZ FROZEN FOODS
Housing units lacking complete plumbing facilities: 0.8% Housing units lacking complete kitchen facilities: 1.0%
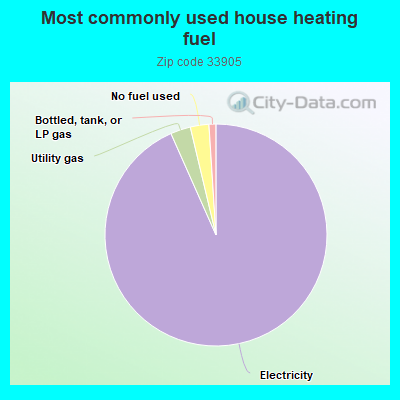
92.8%Electricity
2.9%Utility gas
2.7%No fuel used
1.0%Bottled, tank, or LP gas
Population in 1990: 25,029. Population change in the 1990s: +862 (+3.4%).
Place of birth for U.S.-born residents:
This state: 14,199
Northeast: 4,923
Midwest: 6,379
South: 4,322
West: 1,028
55% of the 33905 zip code residents lived in the same house 5 years ago. Out of people who lived in different houses, 64% lived in this county. Out of people who lived in different counties, 50% lived in Florida.
86% of the 33905 zip code residents lived in the same house 1 year ago. Out of people who lived in different houses, 39% moved from this county. Out of people who lived in different houses, 21% moved from different county within same state. Out of people who lived in different houses, 34% moved from different state. Out of people who lived in different houses, 7% moved from abroad.
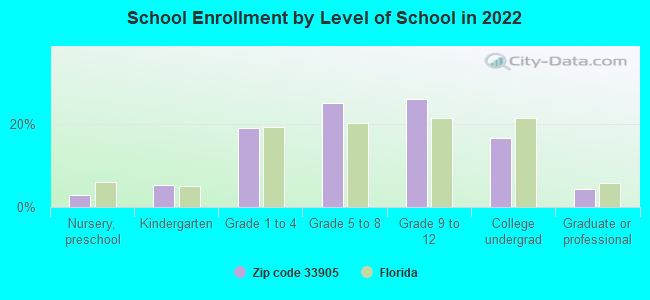
Private vs. public school enrollment:
Students in private schools in grades 1 to 8 (elementary and middle school): 473
Here:
12.5%
Florida:
15.8%
Students in private schools in grades 9 to 12 (high school): 187
Here:
8.4%
Florida:
12.9%
Students in private undergraduate colleges: 264
Here:
18.5%
Florida:
23.6%
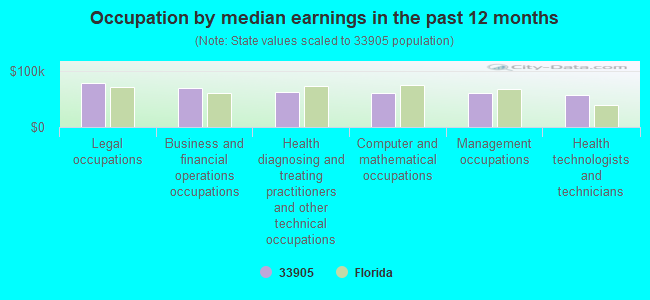
Occupation by median earnings in the past 12 months ($)
78,189Legal occupations
69,756Business and financial operations occupations
62,109Health diagnosing and treating practitioners and other technical occupations
60,868Computer and mathematical occupations
59,703Management occupations
56,066Health technologists and technicians
Companies with federal contracts located in this zip code:
TROPIC TRAILER ( in FT MYERS, FL; small business)
$4,577 with U.S. Fish and Wildlife Service for Trailers. Signed on 2005-08-31. Completion date: 2005-08-31.
MICRO CONTROL SYSTEM INC (5877 ENTERPRISE PKWY in FORT MYERS, FL; small business)
$2,600 with Army for ADP Input/Output and Storage Devices. Signed on 2005-03-29. Completion date: 2005-04-12.
ASHTON CONSTRUCTION AND ROOFIN (290 GRANADA BLVD in FORT MYERS, FL; small business) : -$9,115 in 2 contractsin 1999
$0 with Navy for Maintenance, Repair or Alteration of Real Property -- Water Supply Facilities. Signed on 1999-12-29. Completion date: 1996-08-07.
-$9,115, same as above.Signed on 1999-12-29. Completion date: 1996-08-07.
Top industries in this zip code by the number of employees in 2005:
2002 - 2018 National Fire Incident Reporting System (NFIRS) incidents
According to the data from the years 2002 - 2018 the average number of fire incidents per year is 180. The highest number of fires - 284 took place in 2006, and the least - 40 in 2002. The data has a growing trend.
When looking into fire subcategories, the most incidents belonged to: Outside Fires (53.8%), and Structure Fires (21.2%).
Fire incident types reported to NFIRS in Zip Code 33905


 Nearest zip codes: 33971, 33973, 33916, 33966, 33976, 33917.
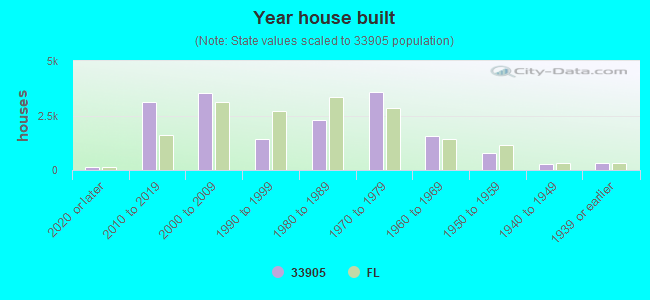


 According to the data from the years 2002 - 2018 the average number of fire incidents per year is 180. The highest number of fires - 284 took place in 2006, and the least - 40 in 2002. The data has a growing trend.
 When looking into fire subcategories, the most incidents belonged to: Outside Fires (53.8%), and Structure Fires (21.2%).