Estimated zip code population in 2022: 17,106
Zip code population in 2010: 13,954
Zip code population in 2000: 10,960
Houses and condos: 8,947
Renter-occupied apartments: 1,406
% of renters here:
18%State:
33%
March 2022 cost of living index in zip code 33983: 91.3
(less than average, U.S. average is 100)
Land area: 10.7
sq. mi.
Water area: 1.1
sq. mi.
Population density: 1,606 people per square mile (low).
OSM Map
General Map
Google Map
MSN Map
OSM Map
General Map
Google Map
MSN Map
OSM Map
General Map
Google Map
MSN Map
OSM Map
General Map
Google Map
MSN Map
Please wait while loading the map...
Real estate property taxes paid for housing units in 2022:
This zip code:
0.8% ($2,786)Florida:
0.7% ($2,529)
Median real estate property taxes paid for housing units with mortgages in 2022: $2,853 (0.8%)
Median real estate property taxes paid for housing units with no mortgage in 2022: $2,694 (0.8%)
Profiles of local businesses
Business Search - 14 Million verified businesses
Males: 8,187 Females: 8,918
For population 25 years and over in 33983:
High school or higher: 93.3%Bachelor's degree or higher: 25.0%Graduate or professional degree: 8.4%Unemployed: 6.5%Mean travel time to work (commute): 27.4 minutes
For population 15 years and over in 33983:
Never married: 21.2%Now married: 57.9%Separated: 1.3%Widowed: 9.6%Divorced: 10.0%
Zip code 33983 compared to state average:
Hispanic race population percentage significantly below state average. Median age significantly above state average. Foreign-born population percentage below state average. Renting percentage below state average. Length of stay since moving in significantly above state average. House age below state average. 13,374 78.2% White 1,796 10.5% Black 1,338 7.8% Hispanic or Latino 334 2.0% Two or more races 253 1.5% Asian 8 0.05% American Indian
Data:
Median household income ($)
Median household income (% change since 2000)
Household income diversity
Ratio of average income to average house value (%)
Ratio of average income to average rent
Median household income ($) - White
Median household income ($) - Black or African American
Median household income ($) - Asian
Median household income ($) - Hispanic or Latino
Median household income ($) - American Indian and Alaska Native
Median household income ($) - Multirace
Median household income ($) - Other Race
Median household income for houses/condos with a mortgage ($)
Median household income for apartments without a mortgage ($)
Races - White alone (%)
Races - White alone (% change since 2000)
Races - Black alone (%)
Races - Black alone (% change since 2000)
Races - American Indian alone (%)
Races - American Indian alone (% change since 2000)
Races - Asian alone (%)
Races - Asian alone (% change since 2000)
Races - Hispanic (%)
Races - Hispanic (% change since 2000)
Races - Native Hawaiian and Other Pacific Islander alone (%)
Races - Native Hawaiian and Other Pacific Islander alone (% change since 2000)
Races - Two or more races (%)
Races - Two or more races (% change since 2000)
Races - Other race alone (%)
Races - Other race alone (% change since 2000)
Racial diversity
Unemployment (%)
Unemployment (% change since 2000)
Unemployment (%) - White
Unemployment (%) - Black or African American
Unemployment (%) - Asian
Unemployment (%) - Hispanic or Latino
Unemployment (%) - American Indian and Alaska Native
Unemployment (%) - Multirace
Unemployment (%) - Other Race
Population density (people per square mile)
Population - Males (%)
Population - Females (%)
Population - Males (%) - White
Population - Males (%) - Black or African American
Population - Males (%) - Asian
Population - Males (%) - Hispanic or Latino
Population - Males (%) - American Indian and Alaska Native
Population - Males (%) - Multirace
Population - Males (%) - Other Race
Population - Females (%) - White
Population - Females (%) - Black or African American
Population - Females (%) - Asian
Population - Females (%) - Hispanic or Latino
Population - Females (%) - American Indian and Alaska Native
Population - Females (%) - Multirace
Population - Females (%) - Other Race
Coronavirus confirmed cases (Apr 27, 2024)
Deaths caused by coronavirus (Apr 27, 2024)
Coronavirus confirmed cases (per 100k population) (Apr 27, 2024)
Deaths caused by coronavirus (per 100k population) (Apr 27, 2024)
Daily increase in number of cases (Apr 27, 2024)
Weekly increase in number of cases (Apr 27, 2024)
Cases doubled (in days) (Apr 27, 2024)
Hospitalized patients (Apr 18, 2022)
Negative test results (Apr 18, 2022)
Total test results (Apr 18, 2022)
COVID Vaccine doses distributed (per 100k population) (Sep 19, 2023)
COVID Vaccine doses administered (per 100k population) (Sep 19, 2023)
COVID Vaccine doses distributed (Sep 19, 2023)
COVID Vaccine doses administered (Sep 19, 2023)
Likely homosexual households (%)
Likely homosexual households (% change since 2000)
Likely homosexual households - Lesbian couples (%)
Likely homosexual households - Lesbian couples (% change since 2000)
Likely homosexual households - Gay men (%)
Likely homosexual households - Gay men (% change since 2000)
Cost of living index
Median gross rent ($)
Median contract rent ($)
Median monthly housing costs ($)
Median house or condo value ($)
Median house or condo value ($ change since 2000)
Mean house or condo value by units in structure - 1, detached ($)
Mean house or condo value by units in structure - 1, attached ($)
Mean house or condo value by units in structure - 2 ($)
Mean house or condo value by units in structure by units in structure - 3 or 4 ($)
Mean house or condo value by units in structure - 5 or more ($)
Mean house or condo value by units in structure - Boat, RV, van, etc. ($)
Mean house or condo value by units in structure - Mobile home ($)
Median house or condo value ($) - White
Median house or condo value ($) - Black or African American
Median house or condo value ($) - Asian
Median house or condo value ($) - Hispanic or Latino
Median house or condo value ($) - American Indian and Alaska Native
Median house or condo value ($) - Multirace
Median house or condo value ($) - Other Race
Median resident age
Resident age diversity
Median resident age - Males
Median resident age - Females
Median resident age - White
Median resident age - Black or African American
Median resident age - Asian
Median resident age - Hispanic or Latino
Median resident age - American Indian and Alaska Native
Median resident age - Multirace
Median resident age - Other Race
Median resident age - Males - White
Median resident age - Males - Black or African American
Median resident age - Males - Asian
Median resident age - Males - Hispanic or Latino
Median resident age - Males - American Indian and Alaska Native
Median resident age - Males - Multirace
Median resident age - Males - Other Race
Median resident age - Females - White
Median resident age - Females - Black or African American
Median resident age - Females - Asian
Median resident age - Females - Hispanic or Latino
Median resident age - Females - American Indian and Alaska Native
Median resident age - Females - Multirace
Median resident age - Females - Other Race
Commute - mean travel time to work (minutes)
Travel time to work - Less than 5 minutes (%)
Travel time to work - Less than 5 minutes (% change since 2000)
Travel time to work - 5 to 9 minutes (%)
Travel time to work - 5 to 9 minutes (% change since 2000)
Travel time to work - 10 to 19 minutes (%)
Travel time to work - 10 to 19 minutes (% change since 2000)
Travel time to work - 20 to 29 minutes (%)
Travel time to work - 20 to 29 minutes (% change since 2000)
Travel time to work - 30 to 39 minutes (%)
Travel time to work - 30 to 39 minutes (% change since 2000)
Travel time to work - 40 to 59 minutes (%)
Travel time to work - 40 to 59 minutes (% change since 2000)
Travel time to work - 60 to 89 minutes (%)
Travel time to work - 60 to 89 minutes (% change since 2000)
Travel time to work - 90 or more minutes (%)
Travel time to work - 90 or more minutes (% change since 2000)
Marital status - Never married (%)
Marital status - Now married (%)
Marital status - Separated (%)
Marital status - Widowed (%)
Marital status - Divorced (%)
Median family income ($)
Median family income (% change since 2000)
Median non-family income ($)
Median non-family income (% change since 2000)
Median per capita income ($)
Median per capita income (% change since 2000)
Median family income ($) - White
Median family income ($) - Black or African American
Median family income ($) - Asian
Median family income ($) - Hispanic or Latino
Median family income ($) - American Indian and Alaska Native
Median family income ($) - Multirace
Median family income ($) - Other Race
Median year house/condo built
Median year apartment built
Year house built - Built 2005 or later (%)
Year house built - Built 2000 to 2004 (%)
Year house built - Built 1990 to 1999 (%)
Year house built - Built 1980 to 1989 (%)
Year house built - Built 1970 to 1979 (%)
Year house built - Built 1960 to 1969 (%)
Year house built - Built 1950 to 1959 (%)
Year house built - Built 1940 to 1949 (%)
Year house built - Built 1939 or earlier (%)
Average household size
Household density (households per square mile)
Average household size - White
Average household size - Black or African American
Average household size - Asian
Average household size - Hispanic or Latino
Average household size - American Indian and Alaska Native
Average household size - Multirace
Average household size - Other Race
Occupied housing units (%)
Vacant housing units (%)
Owner occupied housing units (%)
Renter occupied housing units (%)
Vacancy status - For rent (%)
Vacancy status - For sale only (%)
Vacancy status - Rented or sold, not occupied (%)
Vacancy status - For seasonal, recreational, or occasional use (%)
Vacancy status - For migrant workers (%)
Vacancy status - Other vacant (%)
Residents with income below the poverty level (%)
Residents with income below 50% of the poverty level (%)
Children below poverty level (%)
Poor families by family type - Married-couple family (%)
Poor families by family type - Male, no wife present (%)
Poor families by family type - Female, no husband present (%)
Poverty status for native-born residents (%)
Poverty status for foreign-born residents (%)
Poverty among high school graduates not in families (%)
Poverty among people who did not graduate high school not in families (%)
Residents with income below the poverty level (%) - White
Residents with income below the poverty level (%) - Black or African American
Residents with income below the poverty level (%) - Asian
Residents with income below the poverty level (%) - Hispanic or Latino
Residents with income below the poverty level (%) - American Indian and Alaska Native
Residents with income below the poverty level (%) - Multirace
Residents with income below the poverty level (%) - Other Race
Air pollution - Air Quality Index (AQI)
Air pollution - CO
Air pollution - NO2
Air pollution - SO2
Air pollution - Ozone
Air pollution - PM10
Air pollution - PM25
Air pollution - Pb
Crime - Murders per 100,000 population
Crime - Rapes per 100,000 population
Crime - Robberies per 100,000 population
Crime - Assaults per 100,000 population
Crime - Burglaries per 100,000 population
Crime - Thefts per 100,000 population
Crime - Auto thefts per 100,000 population
Crime - Arson per 100,000 population
Crime - City-data.com crime index
Crime - Violent crime index
Crime - Property crime index
Crime - Murders per 100,000 population (5 year average)
Crime - Rapes per 100,000 population (5 year average)
Crime - Robberies per 100,000 population (5 year average)
Crime - Assaults per 100,000 population (5 year average)
Crime - Burglaries per 100,000 population (5 year average)
Crime - Thefts per 100,000 population (5 year average)
Crime - Auto thefts per 100,000 population (5 year average)
Crime - Arson per 100,000 population (5 year average)
Crime - City-data.com crime index (5 year average)
Crime - Violent crime index (5 year average)
Crime - Property crime index (5 year average)
1996 Presidential Elections Results (%) - Democratic Party (Clinton)
1996 Presidential Elections Results (%) - Republican Party (Dole)
1996 Presidential Elections Results (%) - Other
2000 Presidential Elections Results (%) - Democratic Party (Gore)
2000 Presidential Elections Results (%) - Republican Party (Bush)
2000 Presidential Elections Results (%) - Other
2004 Presidential Elections Results (%) - Democratic Party (Kerry)
2004 Presidential Elections Results (%) - Republican Party (Bush)
2004 Presidential Elections Results (%) - Other
2008 Presidential Elections Results (%) - Democratic Party (Obama)
2008 Presidential Elections Results (%) - Republican Party (McCain)
2008 Presidential Elections Results (%) - Other
2012 Presidential Elections Results (%) - Democratic Party (Obama)
2012 Presidential Elections Results (%) - Republican Party (Romney)
2012 Presidential Elections Results (%) - Other
2016 Presidential Elections Results (%) - Democratic Party (Clinton)
2016 Presidential Elections Results (%) - Republican Party (Trump)
2016 Presidential Elections Results (%) - Other
2020 Presidential Elections Results (%) - Democratic Party (Biden)
2020 Presidential Elections Results (%) - Republican Party (Trump)
2020 Presidential Elections Results (%) - Other
Ancestries Reported - Arab (%)
Ancestries Reported - Czech (%)
Ancestries Reported - Danish (%)
Ancestries Reported - Dutch (%)
Ancestries Reported - English (%)
Ancestries Reported - French (%)
Ancestries Reported - French Canadian (%)
Ancestries Reported - German (%)
Ancestries Reported - Greek (%)
Ancestries Reported - Hungarian (%)
Ancestries Reported - Irish (%)
Ancestries Reported - Italian (%)
Ancestries Reported - Lithuanian (%)
Ancestries Reported - Norwegian (%)
Ancestries Reported - Polish (%)
Ancestries Reported - Portuguese (%)
Ancestries Reported - Russian (%)
Ancestries Reported - Scotch-Irish (%)
Ancestries Reported - Scottish (%)
Ancestries Reported - Slovak (%)
Ancestries Reported - Subsaharan African (%)
Ancestries Reported - Swedish (%)
Ancestries Reported - Swiss (%)
Ancestries Reported - Ukrainian (%)
Ancestries Reported - United States (%)
Ancestries Reported - Welsh (%)
Ancestries Reported - West Indian (%)
Ancestries Reported - Other (%)
Educational Attainment - No schooling completed (%)
Educational Attainment - Less than high school (%)
Educational Attainment - High school or equivalent (%)
Educational Attainment - Less than 1 year of college (%)
Educational Attainment - 1 or more years of college (%)
Educational Attainment - Associate degree (%)
Educational Attainment - Bachelor's degree (%)
Educational Attainment - Master's degree (%)
Educational Attainment - Professional school degree (%)
Educational Attainment - Doctorate degree (%)
School Enrollment - Nursery, preschool (%)
School Enrollment - Kindergarten (%)
School Enrollment - Grade 1 to 4 (%)
School Enrollment - Grade 5 to 8 (%)
School Enrollment - Grade 9 to 12 (%)
School Enrollment - College undergrad (%)
School Enrollment - Graduate or professional (%)
School Enrollment - Not enrolled in school (%)
School enrollment - Public schools (%)
School enrollment - Private schools (%)
School enrollment - Not enrolled (%)
Median number of rooms in houses and condos
Median number of rooms in apartments
Housing units lacking complete plumbing facilities (%)
Housing units lacking complete kitchen facilities (%)
Density of houses
Urban houses (%)
Rural houses (%)
Households with people 60 years and over (%)
Households with people 65 years and over (%)
Households with people 75 years and over (%)
Households with one or more nonrelatives (%)
Households with no nonrelatives (%)
Population in households (%)
Family households (%)
Nonfamily households (%)
Population in families (%)
Family households with own children (%)
Median number of bedrooms in owner occupied houses
Mean number of bedrooms in owner occupied houses
Median number of bedrooms in renter occupied houses
Mean number of bedrooms in renter occupied houses
Median number of vehichles in owner occupied houses
Mean number of vehichles in owner occupied houses
Median number of vehichles in renter occupied houses
Mean number of vehichles in renter occupied houses
Mortgage status - with mortgage (%)
Mortgage status - with second mortgage (%)
Mortgage status - with home equity loan (%)
Mortgage status - with both second mortgage and home equity loan (%)
Mortgage status - without a mortgage (%)
Average family size
Average family size - White
Average family size - Black or African American
Average family size - Asian
Average family size - Hispanic or Latino
Average family size - American Indian and Alaska Native
Average family size - Multirace
Average family size - Other Race
Geographical mobility - Same house 1 year ago (%)
Geographical mobility - Moved within same county (%)
Geographical mobility - Moved from different county within same state (%)
Geographical mobility - Moved from different state (%)
Geographical mobility - Moved from abroad (%)
Place of birth - Born in state of residence (%)
Place of birth - Born in other state (%)
Place of birth - Native, outside of US (%)
Place of birth - Foreign born (%)
Housing units in structures - 1, detached (%)
Housing units in structures - 1, attached (%)
Housing units in structures - 2 (%)
Housing units in structures - 3 or 4 (%)
Housing units in structures - 5 to 9 (%)
Housing units in structures - 10 to 19 (%)
Housing units in structures - 20 to 49 (%)
Housing units in structures - 50 or more (%)
Housing units in structures - Mobile home (%)
Housing units in structures - Boat, RV, van, etc. (%)
House/condo owner moved in on average (years ago)
Renter moved in on average (years ago)
Year householder moved into unit - Moved in 1999 to March 2000 (%)
Year householder moved into unit - Moved in 1995 to 1998 (%)
Year householder moved into unit - Moved in 1990 to 1994 (%)
Year householder moved into unit - Moved in 1980 to 1989 (%)
Year householder moved into unit - Moved in 1970 to 1979 (%)
Year householder moved into unit - Moved in 1969 or earlier (%)
Means of transportation to work - Drove car alone (%)
Means of transportation to work - Carpooled (%)
Means of transportation to work - Public transportation (%)
Means of transportation to work - Bus or trolley bus (%)
Means of transportation to work - Streetcar or trolley car (%)
Means of transportation to work - Subway or elevated (%)
Means of transportation to work - Railroad (%)
Means of transportation to work - Ferryboat (%)
Means of transportation to work - Taxicab (%)
Means of transportation to work - Motorcycle (%)
Means of transportation to work - Bicycle (%)
Means of transportation to work - Walked (%)
Means of transportation to work - Other means (%)
Working at home (%)
Industry diversity
Most Common Industries - Agriculture, forestry, fishing and hunting, and mining (%)
Most Common Industries - Agriculture, forestry, fishing and hunting (%)
Most Common Industries - Mining, quarrying, and oil and gas extraction (%)
Most Common Industries - Construction (%)
Most Common Industries - Manufacturing (%)
Most Common Industries - Wholesale trade (%)
Most Common Industries - Retail trade (%)
Most Common Industries - Transportation and warehousing, and utilities (%)
Most Common Industries - Transportation and warehousing (%)
Most Common Industries - Utilities (%)
Most Common Industries - Information (%)
Most Common Industries - Finance and insurance, and real estate and rental and leasing (%)
Most Common Industries - Finance and insurance (%)
Most Common Industries - Real estate and rental and leasing (%)
Most Common Industries - Professional, scientific, and management, and administrative and waste management services (%)
Most Common Industries - Professional, scientific, and technical services (%)
Most Common Industries - Management of companies and enterprises (%)
Most Common Industries - Administrative and support and waste management services (%)
Most Common Industries - Educational services, and health care and social assistance (%)
Most Common Industries - Educational services (%)
Most Common Industries - Health care and social assistance (%)
Most Common Industries - Arts, entertainment, and recreation, and accommodation and food services (%)
Most Common Industries - Arts, entertainment, and recreation (%)
Most Common Industries - Accommodation and food services (%)
Most Common Industries - Other services, except public administration (%)
Most Common Industries - Public administration (%)
Occupation diversity
Most Common Occupations - Management, business, science, and arts occupations (%)
Most Common Occupations - Management, business, and financial occupations (%)
Most Common Occupations - Management occupations (%)
Most Common Occupations - Business and financial operations occupations (%)
Most Common Occupations - Computer, engineering, and science occupations (%)
Most Common Occupations - Computer and mathematical occupations (%)
Most Common Occupations - Architecture and engineering occupations (%)
Most Common Occupations - Life, physical, and social science occupations (%)
Most Common Occupations - Education, legal, community service, arts, and media occupations (%)
Most Common Occupations - Community and social service occupations (%)
Most Common Occupations - Legal occupations (%)
Most Common Occupations - Education, training, and library occupations (%)
Most Common Occupations - Arts, design, entertainment, sports, and media occupations (%)
Most Common Occupations - Healthcare practitioners and technical occupations (%)
Most Common Occupations - Health diagnosing and treating practitioners and other technical occupations (%)
Most Common Occupations - Health technologists and technicians (%)
Most Common Occupations - Service occupations (%)
Most Common Occupations - Healthcare support occupations (%)
Most Common Occupations - Protective service occupations (%)
Most Common Occupations - Fire fighting and prevention, and other protective service workers including supervisors (%)
Most Common Occupations - Law enforcement workers including supervisors (%)
Most Common Occupations - Food preparation and serving related occupations (%)
Most Common Occupations - Building and grounds cleaning and maintenance occupations (%)
Most Common Occupations - Personal care and service occupations (%)
Most Common Occupations - Sales and office occupations (%)
Most Common Occupations - Sales and related occupations (%)
Most Common Occupations - Office and administrative support occupations (%)
Most Common Occupations - Natural resources, construction, and maintenance occupations (%)
Most Common Occupations - Farming, fishing, and forestry occupations (%)
Most Common Occupations - Construction and extraction occupations (%)
Most Common Occupations - Installation, maintenance, and repair occupations (%)
Most Common Occupations - Production, transportation, and material moving occupations (%)
Most Common Occupations - Production occupations (%)
Most Common Occupations - Transportation occupations (%)
Most Common Occupations - Material moving occupations (%)
People in Group quarters - Institutionalized population (%)
People in Group quarters - Correctional institutions (%)
People in Group quarters - Federal prisons and detention centers (%)
People in Group quarters - Halfway houses (%)
People in Group quarters - Local jails and other confinement facilities (including police lockups) (%)
People in Group quarters - Military disciplinary barracks (%)
People in Group quarters - State prisons (%)
People in Group quarters - Other types of correctional institutions (%)
People in Group quarters - Nursing homes (%)
People in Group quarters - Hospitals/wards, hospices, and schools for the handicapped (%)
People in Group quarters - Hospitals/wards and hospices for chronically ill (%)
People in Group quarters - Hospices or homes for chronically ill (%)
People in Group quarters - Military hospitals or wards for chronically ill (%)
People in Group quarters - Other hospitals or wards for chronically ill (%)
People in Group quarters - Hospitals or wards for drug/alcohol abuse (%)
People in Group quarters - Mental (Psychiatric) hospitals or wards (%)
People in Group quarters - Schools, hospitals, or wards for the mentally retarded (%)
People in Group quarters - Schools, hospitals, or wards for the physically handicapped (%)
People in Group quarters - Institutions for the deaf (%)
People in Group quarters - Institutions for the blind (%)
People in Group quarters - Orthopedic wards and institutions for the physically handicapped (%)
People in Group quarters - Wards in general hospitals for patients who have no usual home elsewhere (%)
People in Group quarters - Wards in military hospitals for patients who have no usual home elsewhere (%)
People in Group quarters - Juvenile institutions (%)
People in Group quarters - Long-term care (%)
People in Group quarters - Homes for abused, dependent, and neglected children (%)
People in Group quarters - Residential treatment centers for emotionally disturbed children (%)
People in Group quarters - Training schools for juvenile delinquents (%)
People in Group quarters - Short-term care, detention or diagnostic centers for delinquent children (%)
People in Group quarters - Type of juvenile institution unknown (%)
People in Group quarters - Noninstitutionalized population (%)
People in Group quarters - College dormitories (includes college quarters off campus) (%)
People in Group quarters - Military quarters (%)
People in Group quarters - On base (%)
People in Group quarters - Barracks, unaccompanied personnel housing (UPH), (Enlisted/Officer), ;and similar group living quarters for military personnel (%)
People in Group quarters - Transient quarters for temporary residents (%)
People in Group quarters - Military ships (%)
People in Group quarters - Group homes (%)
People in Group quarters - Homes or halfway houses for drug/alcohol abuse (%)
People in Group quarters - Homes for the mentally ill (%)
People in Group quarters - Homes for the mentally retarded (%)
People in Group quarters - Homes for the physically handicapped (%)
People in Group quarters - Other group homes (%)
People in Group quarters - Religious group quarters (%)
People in Group quarters - Dormitories (%)
People in Group quarters - Agriculture workers' dormitories on farms (%)
People in Group quarters - Job Corps and vocational training facilities (%)
People in Group quarters - Other workers' dormitories (%)
People in Group quarters - Crews of maritime vessels (%)
People in Group quarters - Other nonhousehold living situations (%)
People in Group quarters - Other noninstitutional group quarters (%)
Residents speaking English at home (%)
Residents speaking English at home - Born in the United States (%)
Residents speaking English at home - Native, born elsewhere (%)
Residents speaking English at home - Foreign born (%)
Residents speaking Spanish at home (%)
Residents speaking Spanish at home - Born in the United States (%)
Residents speaking Spanish at home - Native, born elsewhere (%)
Residents speaking Spanish at home - Foreign born (%)
Residents speaking other language at home (%)
Residents speaking other language at home - Born in the United States (%)
Residents speaking other language at home - Native, born elsewhere (%)
Residents speaking other language at home - Foreign born (%)
Class of Workers - Employee of private company (%)
Class of Workers - Self-employed in own incorporated business (%)
Class of Workers - Private not-for-profit wage and salary workers (%)
Class of Workers - Local government workers (%)
Class of Workers - State government workers (%)
Class of Workers - Federal government workers (%)
Class of Workers - Self-employed workers in own not incorporated business and Unpaid family workers (%)
House heating fuel used in houses and condos - Utility gas (%)
House heating fuel used in houses and condos - Bottled, tank, or LP gas (%)
House heating fuel used in houses and condos - Electricity (%)
House heating fuel used in houses and condos - Fuel oil, kerosene, etc. (%)
House heating fuel used in houses and condos - Coal or coke (%)
House heating fuel used in houses and condos - Wood (%)
House heating fuel used in houses and condos - Solar energy (%)
House heating fuel used in houses and condos - Other fuel (%)
House heating fuel used in houses and condos - No fuel used (%)
House heating fuel used in apartments - Utility gas (%)
House heating fuel used in apartments - Bottled, tank, or LP gas (%)
House heating fuel used in apartments - Electricity (%)
House heating fuel used in apartments - Fuel oil, kerosene, etc. (%)
House heating fuel used in apartments - Coal or coke (%)
House heating fuel used in apartments - Wood (%)
House heating fuel used in apartments - Solar energy (%)
House heating fuel used in apartments - Other fuel (%)
House heating fuel used in apartments - No fuel used (%)
Armed forces status - In Armed Forces (%)
Armed forces status - Civilian (%)
Armed forces status - Civilian - Veteran (%)
Armed forces status - Civilian - Nonveteran (%)
Fatal accidents locations in years 2005-2021
Fatal accidents locations in 2005
Fatal accidents locations in 2006
Fatal accidents locations in 2007
Fatal accidents locations in 2008
Fatal accidents locations in 2009
Fatal accidents locations in 2010
Fatal accidents locations in 2011
Fatal accidents locations in 2012
Fatal accidents locations in 2013
Fatal accidents locations in 2014
Fatal accidents locations in 2015
Fatal accidents locations in 2016
Fatal accidents locations in 2017
Fatal accidents locations in 2018
Fatal accidents locations in 2019
Fatal accidents locations in 2020
Fatal accidents locations in 2021
Alcohol use - People drinking some alcohol every month (%)
Alcohol use - People not drinking at all (%)
Alcohol use - Average days/month drinking alcohol
Alcohol use - Average drinks/week
Alcohol use - Average days/year people drink much
Audiometry - Average condition of hearing (%)
Audiometry - People that can hear a whisper from across a quiet room (%)
Audiometry - People that can hear normal voice from across a quiet room (%)
Audiometry - Ears ringing, roaring, buzzing (%)
Audiometry - Had a job exposure to loud noise (%)
Audiometry - Had off-work exposure to loud noise (%)
Blood Pressure & Cholesterol - Has high blood pressure (%)
Blood Pressure & Cholesterol - Checking blood pressure at home (%)
Blood Pressure & Cholesterol - Frequently checking blood cholesterol (%)
Blood Pressure & Cholesterol - Has high cholesterol level (%)
Consumer Behavior - Money monthly spent on food at supermarket/grocery store
Consumer Behavior - Money monthly spent on food at other stores
Consumer Behavior - Money monthly spent on eating out
Consumer Behavior - Money monthly spent on carryout/delivered foods
Consumer Behavior - Income spent on food at supermarket/grocery store (%)
Consumer Behavior - Income spent on food at other stores (%)
Consumer Behavior - Income spent on eating out (%)
Consumer Behavior - Income spent on carryout/delivered foods (%)
Current Health Status - General health condition (%)
Current Health Status - Blood donors (%)
Current Health Status - Has blood ever tested for HIV virus (%)
Current Health Status - Left-handed people (%)
Dermatology - People using sunscreen (%)
Diabetes - Diabetics (%)
Diabetes - Had a blood test for high blood sugar (%)
Diabetes - People taking insulin (%)
Diet Behavior & Nutrition - Diet health (%)
Diet Behavior & Nutrition - Milk product consumption (# of products/month)
Diet Behavior & Nutrition - Meals not home prepared (#/week)
Diet Behavior & Nutrition - Meals from fast food or pizza place (#/week)
Diet Behavior & Nutrition - Ready-to-eat foods (#/month)
Diet Behavior & Nutrition - Frozen meals/pizza (#/month)
Drug Use - People that ever used marijuana or hashish (%)
Drug Use - Ever used hard drugs (%)
Drug Use - Ever used any form of cocaine (%)
Drug Use - Ever used heroin (%)
Drug Use - Ever used methamphetamine (%)
Health Insurance - People covered by health insurance (%)
Kidney Conditions-Urology - Avg. # of times urinating at night
Medical Conditions - People with asthma (%)
Medical Conditions - People with anemia (%)
Medical Conditions - People with psoriasis (%)
Medical Conditions - People with overweight (%)
Medical Conditions - Elderly people having difficulties in thinking or remembering (%)
Medical Conditions - People who ever received blood transfusion (%)
Medical Conditions - People having trouble seeing even with glass/contacts (%)
Medical Conditions - People with arthritis (%)
Medical Conditions - People with gout (%)
Medical Conditions - People with congestive heart failure (%)
Medical Conditions - People with coronary heart disease (%)
Medical Conditions - People with angina pectoris (%)
Medical Conditions - People who ever had heart attack (%)
Medical Conditions - People who ever had stroke (%)
Medical Conditions - People with emphysema (%)
Medical Conditions - People with thyroid problem (%)
Medical Conditions - People with chronic bronchitis (%)
Medical Conditions - People with any liver condition (%)
Medical Conditions - People who ever had cancer or malignancy (%)
Mental Health - People who have little interest in doing things (%)
Mental Health - People feeling down, depressed, or hopeless (%)
Mental Health - People who have trouble sleeping or sleeping too much (%)
Mental Health - People feeling tired or having little energy (%)
Mental Health - People with poor appetite or overeating (%)
Mental Health - People feeling bad about themself (%)
Mental Health - People who have trouble concentrating on things (%)
Mental Health - People moving or speaking slowly or too fast (%)
Mental Health - People having thoughts they would be better off dead (%)
Oral Health - Average years since last visit a dentist
Oral Health - People embarrassed because of mouth (%)
Oral Health - People with gum disease (%)
Oral Health - General health of teeth and gums (%)
Oral Health - Average days a week using dental floss/device
Oral Health - Average days a week using mouthwash for dental problem
Oral Health - Average number of teeth
Pesticide Use - Households using pesticides to control insects (%)
Pesticide Use - Households using pesticides to kill weeds (%)
Physical Activity - People doing vigorous-intensity work activities (%)
Physical Activity - People doing moderate-intensity work activities (%)
Physical Activity - People walking or bicycling (%)
Physical Activity - People doing vigorous-intensity recreational activities (%)
Physical Activity - People doing moderate-intensity recreational activities (%)
Physical Activity - Average hours a day doing sedentary activities
Physical Activity - Average hours a day watching TV or videos
Physical Activity - Average hours a day using computer
Physical Functioning - People having limitations keeping them from working (%)
Physical Functioning - People limited in amount of work they can do (%)
Physical Functioning - People that need special equipment to walk (%)
Physical Functioning - People experiencing confusion/memory problems (%)
Physical Functioning - People requiring special healthcare equipment (%)
Prescription Medications - Average number of prescription medicines taking
Preventive Aspirin Use - Adults 40+ taking low-dose aspirin (%)
Reproductive Health - Vaginal deliveries (%)
Reproductive Health - Cesarean deliveries (%)
Reproductive Health - Deliveries resulted in a live birth (%)
Reproductive Health - Pregnancies resulted in a delivery (%)
Reproductive Health - Women breastfeeding newborns (%)
Reproductive Health - Women that had a hysterectomy (%)
Reproductive Health - Women that had both ovaries removed (%)
Reproductive Health - Women that have ever taken birth control pills (%)
Reproductive Health - Women taking birth control pills (%)
Reproductive Health - Women that have ever used Depo-Provera or injectables (%)
Reproductive Health - Women that have ever used female hormones (%)
Sexual Behavior - People 18+ that ever had sex (vaginal, anal, or oral) (%)
Sexual Behavior - Males 18+ that ever had vaginal sex with a woman (%)
Sexual Behavior - Males 18+ that ever performed oral sex on a woman (%)
Sexual Behavior - Males 18+ that ever had anal sex with a woman (%)
Sexual Behavior - Males 18+ that ever had any sex with a man (%)
Sexual Behavior - Females 18+ that ever had vaginal sex with a man (%)
Sexual Behavior - Females 18+ that ever performed oral sex on a man (%)
Sexual Behavior - Females 18+ that ever had anal sex with a man (%)
Sexual Behavior - Females 18+ that ever had any kind of sex with a woman (%)
Sexual Behavior - Average age people first had sex
Sexual Behavior - Average number of female sex partners in lifetime (males 18+)
Sexual Behavior - Average number of female vaginal sex partners in lifetime (males 18+)
Sexual Behavior - Average age people first performed oral sex on a woman (18+)
Sexual Behavior - Average number of woman performed oral sex on in lifetime (18+)
Sexual Behavior - Average number of male sex partners in lifetime (males 18+)
Sexual Behavior - Average number of male anal sex partners in lifetime (males 18+)
Sexual Behavior - Average age people first performed oral sex on a man (18+)
Sexual Behavior - Average number of male oral sex partners in lifetime (18+)
Sexual Behavior - People using protection when performing oral sex (%)
Sexual Behavior - Average number of times people have vaginal or anal sex a year
Sexual Behavior - People having sex without condom (%)
Sexual Behavior - Average number of male sex partners in lifetime (females 18+)
Sexual Behavior - Average number of male vaginal sex partners in lifetime (females 18+)
Sexual Behavior - Average number of female sex partners in lifetime (females 18+)
Sexual Behavior - Circumcised males 18+ (%)
Sleep Disorders - Average hours sleeping at night
Sleep Disorders - People that has trouble sleeping (%)
Smoking-Cigarette Use - People smoking cigarettes (%)
Taste & Smell - People 40+ having problems with smell (%)
Taste & Smell - People 40+ having problems with taste (%)
Taste & Smell - People 40+ that ever had wisdom teeth removed (%)
Taste & Smell - People 40+ that ever had tonsils teeth removed (%)
Taste & Smell - People 40+ that ever had a loss of consciousness because of a head injury (%)
Taste & Smell - People 40+ that ever had a broken nose or other serious injury to face or skull (%)
Taste & Smell - People 40+ that ever had two or more sinus infections (%)
Weight - Average height (inches)
Weight - Average weight (pounds)
Weight - Average BMI
Weight - People that are obese (%)
Weight - People that ever were obese (%)
Weight - People trying to lose weight (%)
100%
urban population.
Estimated median house/condo value in 2022: $353,009
33983:
$353,009Florida:
$354,100
According to our research of Florida and other state lists, there were 17 registered sex offenders living in 33983 zip code as of April 27, 2024 . The ratio of all residents to sex offenders in zip code 33983 is 908 to 1.The ratio of registered sex offenders to all residents in this zip code is lower than the state average.
Median resident age: This zip code:
57.3 yearsFlorida median age:
42.7 years
Average household size: This zip code:
2.2 peopleFlorida:
2.5 people
Averages for the 2020 tax year for zip code 33983, filed in 2021:
Average Adjusted Gross Income (AGI) in 2020: $62,291 (Individual Income Tax Returns) Here:
$62,291State:
$82,200
Salary/wage: $50,714 (reported on 68.1% of returns )Here:
$50,714State:
$58,347
(% of AGI for various income ranges: 1065.5% for AGIs below $25k , 3055.4% for AGIs $25k-50k , 5103.1% for AGIs $50k-75k , 7215.9% for AGIs $75k-100k , 13377.5% for AGIs $100k-200k , 65015.7% for AGIs over 200k ) Taxable interest for individuals: $1,621 (reported on 35.7% of returns )This zip code:
$1,621Florida:
$4,272
(% of AGI for various income ranges: 29.8% for AGIs below $25k , 39.2% for AGIs $25k-50k , 72.9% for AGIs $50k-75k , 135.7% for AGIs $75k-100k , 159.6% for AGIs $100k-200k , 1732.9% for AGIs over 200k ) Ordinary dividends: $4,679 (reported on 25.4% of returns )(% of AGI for various income ranges: 54.6% for AGIs below $25k , 73.2% for AGIs $25k-50k , 148.6% for AGIs $50k-75k , 232.9% for AGIs $75k-100k , 434.2% for AGIs $100k-200k , 3151.4% for AGIs over 200k ) Net capital gain/loss in AGI: +$14,491 (reported on 22.4% of returns )Here:
+$14,491State:
+$62,983
(% of AGI for various income ranges: 21.0% for AGIs below $25k , 63.2% for AGIs $25k-50k , 100.5% for AGIs $50k-75k , 261.2% for AGIs $75k-100k , 912.0% for AGIs $100k-200k , 24395.7% for AGIs over 200k ) Profit/loss from business: +$8,424 (reported on 13.5% of returns )Here:
+$8,424State:
+$9,719
(% of AGI for various income ranges: 108.6% for AGIs below $25k , 123.8% for AGIs $25k-50k , 184.4% for AGIs $50k-75k , 242.7% for AGIs $75k-100k , 324.8% for AGIs $100k-200k , 607.1% for AGIs over 200k ) Taxable individual retirement arrangement distribution: $19,754 (reported on 18.9% of returns )33983:
$19,754Florida:
$24,823
(% of AGI for various income ranges: 141.1% for AGIs below $25k , 237.2% for AGIs $25k-50k , 552.9% for AGIs $50k-75k , 946.9% for AGIs $75k-100k , 1488.7% for AGIs $100k-200k , 6748.6% for AGIs over 200k ) Total itemized deductions: $30,490 (reported on 5.7% of returns )Here:
$30,490State:
$45,393
(% of AGI for various income ranges: 68.5% for AGIs below $25k , 148.1% for AGIs $25k-50k , 246.2% for AGIs $50k-75k , 307.3% for AGIs $75k-100k , 581.3% for AGIs $100k-200k , 4615.7% for AGIs over 200k ) Charity contributions: $7,782 (reported on 4.7% of returns )(% of AGI for various income ranges: 8.3% for AGIs below $25k , 25.8% for AGIs $25k-50k , 37.8% for AGIs $50k-75k , 53.9% for AGIs $75k-100k , 132.5% for AGIs $100k-200k , 1341.4% for AGIs over 200k ) Taxes paid: $5,811 (reported on 5.6% of returns )(% of AGI for various income ranges: 11.7% for AGIs below $25k , 25.4% for AGIs $25k-50k , 46.0% for AGIs $50k-75k , 60.4% for AGIs $75k-100k , 123.5% for AGIs $100k-200k , 762.9% for AGIs over 200k ) Earned income credit: $2,176 (reported on 13.3% of returns )(% of AGI for various income ranges: 80.3% for AGIs below $25k , 59.4% for AGIs $25k-50k ) Percentage of individuals using paid preparers for their 2020 taxes: 92.6%(% for various income ranges: 91.1% for AGIs below $25k , 93.5% for AGIs $25k-50k , 92.6% for AGIs $50k-75k , 92.5% for AGIs $75k-100k , 94.4% for AGIs $100k-200k , 92.0% for AGIs over 200k )
Averages for the 2012 tax year for zip code 33983, filed in 2013:
Average Adjusted Gross Income (AGI) in 2012: $48,280 (Individual Income Tax Returns) Here:
$48,280State:
$60,316
Salary/wage: $38,803 (reported on 69.8% of returns )Here:
$38,803State:
$45,277
(% of AGI for various income ranges: 60.2% for AGIs below $25k , 60.9% for AGIs $25k-50k , 53.7% for AGIs $50k-75k , 61.1% for AGIs $75k-100k , 56.9% for AGIs $100k-200k , 40.4% for AGIs over 200k ) Taxable interest for individuals: $1,675 (reported on 39.3% of returns )This zip code:
$1,675Florida:
$3,587
(% of AGI for various income ranges: 2.1% for AGIs below $25k , 1.1% for AGIs $25k-50k , 1.4% for AGIs $50k-75k , 1.0% for AGIs $75k-100k , 1.0% for AGIs $100k-200k , 2.3% for AGIs over 200k ) Ordinary dividends: $4,576 (reported on 27.4% of returns )(% of AGI for various income ranges: 3.5% for AGIs below $25k , 2.1% for AGIs $25k-50k , 2.4% for AGIs $50k-75k , 1.7% for AGIs $75k-100k , 2.4% for AGIs $100k-200k , 4.7% for AGIs over 200k ) Net capital gain/loss in AGI: +$7,225 (reported on 22.3% of returns )Here:
+$7,225State:
+$33,493
(% of AGI for various income ranges: 0.5% for AGIs $50k-75k , 0.8% for AGIs $75k-100k , 2.1% for AGIs $100k-200k , 22.7% for AGIs over 200k ) Profit/loss from business: +$11,114 (reported on 12.7% of returns )Here:
+$11,114State:
+$10,012
(% of AGI for various income ranges: 5.7% for AGIs below $25k , 2.2% for AGIs $25k-50k , 2.2% for AGIs $50k-75k , 2.1% for AGIs $75k-100k , 3.3% for AGIs $100k-200k , 3.3% for AGIs over 200k ) Taxable individual retirement arrangement distribution: $13,803 (reported on 20.3% of returns )33983:
$13,803Florida:
$21,544
(% of AGI for various income ranges: 7.2% for AGIs below $25k , 5.9% for AGIs $25k-50k , 5.8% for AGIs $50k-75k , 5.3% for AGIs $75k-100k , 8.5% for AGIs $100k-200k ) Self-employment retirement plans: $26,750 (reported on 0.3% of returns )33983:
$26,750Florida:
$20,611
Total itemized deductions: $18,772 (24% of AGI, reported on 27.6% of returns )Here:
$18,772State:
$25,533
Here:
24.0% of AGIState:
18.0% of AGI
(% of AGI for various income ranges: 13.8% for AGIs below $25k , 11.8% for AGIs $25k-50k , 10.9% for AGIs $50k-75k , 9.9% for AGIs $75k-100k , 10.9% for AGIs $100k-200k , 6.9% for AGIs over 200k ) Charity contributions: $2,890 (reported on 22.3% of returns )(% of AGI for various income ranges: 1.1% for AGIs below $25k , 1.3% for AGIs $25k-50k , 1.2% for AGIs $50k-75k , 1.3% for AGIs $75k-100k , 1.6% for AGIs $100k-200k , 1.2% for AGIs over 200k ) Taxes paid: $4,172 (reported on 26.8% of returns )(% of AGI for various income ranges: 2.4% for AGIs below $25k , 2.1% for AGIs $25k-50k , 2.3% for AGIs $50k-75k , 2.1% for AGIs $75k-100k , 2.8% for AGIs $100k-200k , 2.0% for AGIs over 200k ) Earned income credit: $2,149 (reported on 16.5% of returns )(% of AGI for various income ranges: 5.4% for AGIs below $25k , 0.9% for AGIs $25k-50k ) Percentage of individuals using paid preparers for their 2012 taxes: 51.1%(% for various income ranges: 46.2% for AGIs below $25k , 51.2% for AGIs $25k-50k , 52.9% for AGIs $50k-75k , 55.0% for AGIs $75k-100k , 61.1% for AGIs $100k-200k , 80.0% for AGIs over 200k )
Averages for the 2004 tax year for zip code 33983, filed in 2005:
Average Adjusted Gross Income (AGI) in 2004: $45,915 (Individual Income Tax Returns) Here:
$45,915State:
$50,523
Salary/wage: $36,879 (reported on 70.7% of returns )Here:
$36,879State:
$39,563
(% of AGI for various income ranges: 122.1% for AGIs below $10k , 52.6% for AGIs $10k-25k , 54.5% for AGIs $25k-50k , 59.6% for AGIs $50k-75k , 64.2% for AGIs $75k-100k , 51.1% for AGIs over 100k ) Taxable interest for individuals: $1,914 (reported on 60.3% of returns )This zip code:
$1,914Florida:
$3,211
(% of AGI for various income ranges: 10.3% for AGIs below $10k , 5.2% for AGIs $10k-25k , 3.0% for AGIs $25k-50k , 2.2% for AGIs $50k-75k , 1.7% for AGIs $75k-100k , 1.7% for AGIs over 100k ) Taxable dividends: $2,825 (reported on 34.6% of returns )(% of AGI for various income ranges: 9.5% for AGIs below $10k , 3.6% for AGIs $10k-25k , 2.3% for AGIs $25k-50k , 1.6% for AGIs $50k-75k , 1.7% for AGIs $75k-100k , 1.9% for AGIs over 100k ) Net capital gain/loss: +$11,240 (reported on 29.5% of returns )Here:
+$11,240State:
+$27,205
(% of AGI for various income ranges: -4.6% for AGIs below $10k , 0.9% for AGIs $10k-25k , 1.6% for AGIs $25k-50k , 2.3% for AGIs $50k-75k , 3.4% for AGIs $75k-100k , 18.8% for AGIs over 100k ) Profit/loss from business: +$12,005 (reported on 13.8% of returns )Here:
+$12,005State:
+$10,634
(% of AGI for various income ranges: -5.8% for AGIs below $10k , 5.0% for AGIs $10k-25k , 4.3% for AGIs $25k-50k , 2.5% for AGIs $50k-75k , 2.6% for AGIs $75k-100k , 4.4% for AGIs over 100k ) IRA payment deduction: $3,277 (reported on 3.3% of returns )33983:
$3,277Florida:
$3,082
(% of AGI for various income ranges: 0.2% for AGIs $10k-25k , 0.3% for AGIs $25k-50k , 0.3% for AGIs $50k-75k , 0.3% for AGIs $75k-100k , 0.1% for AGIs over 100k ) Self-employed pension: $11,895 (reported on 0.7% of returns )Here:
$11,895Florida:
$15,857
Total itemized deductions: $19,540 (29% of AGI, reported on 40.3% of returns )Here:
$19,540State:
$20,370
Here:
29.2% of AGIState:
20.7% of AGI
(% of AGI for various income ranges: 40.7% for AGIs below $10k , 20.8% for AGIs $10k-25k , 20.1% for AGIs $25k-50k , 20.6% for AGIs $50k-75k , 16.9% for AGIs $75k-100k , 10.9% for AGIs over 100k ) Charity contributions deductions: $2,374 (3% of AGI, reported on 34.1% of returns )Here:
3.4% of AGIState:
3.8% of AGI
(% of AGI for various income ranges: 2.1% for AGIs below $10k , 1.5% for AGIs $10k-25k , 1.7% for AGIs $25k-50k , 1.8% for AGIs $50k-75k , 1.7% for AGIs $75k-100k , 1.9% for AGIs over 100k ) Total tax: $6,366 (reported on 75.4% of returns )(% of AGI for various income ranges: 2.9% for AGIs below $10k , 3.5% for AGIs $10k-25k , 6.5% for AGIs $25k-50k , 8.3% for AGIs $50k-75k , 10.1% for AGIs $75k-100k , 17.2% for AGIs over 100k ) Earned income credit: $1,645 (reported on 9.8% of returns )Percentage of individuals using paid preparers for their 2004 taxes: 61.1%(% for various income ranges: 53.3% for AGIs below $10k , 61.9% for AGIs $10k-25k , 64.8% for AGIs $25k-50k , 59.1% for AGIs $50k-75k , 59.4% for AGIs $75k-100k , 69.4% for AGIs over 100k )
Estimated median household income in 2022: This zip code:
$64,503Florida:
$69,303
Nearest zip codes: 33980 ,
34269 ,
33952 ,
34288 ,
33954 ,
33950 .
Percentage of family households: This zip code:
33.8%Florida:
41.2%
Percentage of households with unmarried partners: This zip code:
3.3%Florida:
46.7%
Likely homosexual households (counted as self-reported same-sex unmarried-partner households)
Lesbian couples: 0.2% of all households Gay men: 0.0% of all households
Household received Food Stamps/SNAP in the past 12 months: 470Household did not receive Food Stamps/SNAP in the past 12 months: 7,169
Women who had a birth in the past 12 months: 188 (113 now married , 74 unmarried) Women who did not have a birth in the past 12 months: 2,543 (1,181 now married , 1,362 unmarried)
Housing units in zip code 33983 with a mortgage: 3,308 (247
second mortgage , 207
both second mortgage and home equity loan )
Houses without a mortgage: 8
Median monthly owner costs for units with a mortgage: $1,683
Median monthly owner costs for units without a mortgage: $626
Residents with income below the poverty level in 2022:
This zip code:
7.3%Whole state:
12.7%
Residents with income below 50% of the poverty level in 2022:
This zip code:
4.3%Whole state:
6.6%
Median number of rooms in houses and condos: Median number of rooms in apartments:
Year house built (houses)
38 2020 or later737 2010 to 20192,578 2000 to 20091,544 1990 to 19993,151 1980 to 1989461 1970 to 1979145 1960 to 1969116 1950 to 19598 1940 to 19490 1939 or earlier
Zip code 33983 household income distribution in 2022 222 Less than $10,000160 $10,000 to $14,999216 $15,000 to $19,999313 $20,000 to $24,999336 $25,000 to $29,999416 $30,000 to $34,999457 $35,000 to $39,999451 $40,000 to $44,999481 $45,000 to $49,999504 $50,000 to $59,999861 $60,000 to $74,9991,145 $75,000 to $99,999819 $100,000 to $124,999392 $125,000 to $149,999364 $150,000 to $199,999407 $200,000 or moreEstimate of home value of owner-occupied houses/condos in 2022 in zip code 33983 81 Less than $10,0007 $10,000 to $14,9999 $15,000 to $19,99916 $25,000 to $29,99933 $30,000 to $34,99918 $35,000 to $39,99916 $70,000 to $79,9995 $80,000 to $89,99956 $90,000 to $99,999130 $100,000 to $124,99988 $125,000 to $149,999155 $150,000 to $174,99983 $175,000 to $199,999570 $200,000 to $249,9991,311 $250,000 to $299,9991,966 $300,000 to $399,999740 $400,000 to $499,999613 $500,000 to $749,99946 $750,000 to $999,99919 $1,000,000 to $1,499,999Rent paid by renters in 2022 in zip code 33983 69 Less than $10015 $350 to $3996 $450 to $49932 $500 to $54919 $550 to $59999 $600 to $6493 $650 to $69936 $700 to $74990 $750 to $79987 $800 to $899126 $900 to $999288 $1,000 to $1,249149 $1,250 to $1,499235 $1,500 to $1,99937 $2,000 to $2,49915 No cash rent
Median gross rent in 2022: $1,257.
Median price asked for vacant for-sale houses and condos in 2022: $301,485.
Estimated median house (or condo) value in 2022 for: White Non-Hispanic householders: $366,526Black or African American householders: $380,671American Indian or Alaska Native householders: $117,879Asian householders: $381,614Some other race householders: $353,638Two or more races householders: $405,190Hispanic or Latino householders: $392,931Estimated median house or condo value in 2022: $353,009
33983:
$353,009Florida:
$354,100
Lower value quartile - upper value quartile: $288,141 - $440,394
Mean price in 2022: Detached houses: $381,753Here:
$381,753State:
$500,941
Townhouses or other attached units: $243,722Here:
$243,722State:
$370,869
In 3-to-4-unit structures: $179,030Here:
$179,030State:
$309,944
In 5-or-more-unit structures: $146,813Here:
$146,813State:
$447,145
Housing units in structures:
One, detached: 6,292One, attached: 444Two: 2123 or 4: 4825 to 9: 50110 to 19: 41720 to 49: 40050 or more: 109Mobile homes: 46Unemployment : 6.5%
Means of transportation to work in zip code 33983 71.6% 4,634 Drove a car alone11.8% 765 Carpooled0.2% 11 Bus or trolley bus0.2% 14 Ferryboat0.6% 42 Taxi0.3% 17 Motorcycle0.1% 4 Bicycle1.2% 75 Other means12.9% 836 Worked at homeTravel time to work (commute) in zip code 33983 71 Less than 5 minutes183 5 to 9 minutes607 10 to 14 minutes1,492 15 to 19 minutes1,218 20 to 24 minutes144 25 to 29 minutes720 30 to 34 minutes80 35 to 39 minutes118 40 to 44 minutes314 45 to 59 minutes459 60 to 89 minutes152 90 or more minutes
Percentage of zip code residents living and working in this county: 74.7%
Household type by relationship:
Households: 17,106
Male householders: 3,705 (624 living alone ), Female householders: 3,904 (1,312 living alone )4,326 spouses (4,261 opposite-sex spouses ), 403 unmarried partners , (392 opposite-sex unmarried partners ), 3,943 children (3,507 natural , 77 adopted , 347 stepchildren ), 273 grandchildren , 11 brothers or sisters , 135 parents , 17 foster children , 89 other relatives , 207 non-relatives In group quarters: 244 (-1 institutionalized population )
Size of family households: 3,082 2-persons , 1,125 3-persons , 817 4-persons , 112 5-persons , 53 6-persons
Size of nonfamily households: 1,938 1-person , 463 2-persons
1,480 married couples with children. single-parent households (255 men , 446 women ).
91.7% of residents of 33983 zip code speak English at home. of residents speak Spanish at home (80% very well, 11% well, 6% not well, 3% not at all ).of residents speak other Indo-European language at home (78% very well, 18% well, 4% not well ).of residents speak Asian or Pacific Island language at home (100% very well ).
Foreign born population: 2,131 (12.5%)
(67.5%
of them are naturalized citizens )
This zip code:
12.5%Whole state:
21.7%
25% Haiti 11% Serbia 6% France 6% Grenada 6% Sweden 5% Brazil 5% St. Vincent and the Grenadines 17% American 11% German 10% English 8% Irish 7% Italian 5% Jamaican 3% European
Year of entry for the foreign-born population
791 2010 or later 304 2000 to 2009 191 1990 to 1999 871 Before 1990
Facilities with environmental interests located in this zip code:
DEEP CREEK ELEMENTARY SCHOOL (26900 HARBORVIEW ROAD in PUNTA GORDA, FL)
(National Center for Education Statistics) - STATE ID-0251 Organizations: CHARLOTTE COUNTY SCHOOL DISTRICT (SCHOOL DISTRICT)
LAKE'S EDGE AT DEEP CREEK (1501 SAN CRISTOBAL in PORT CHARLOTTE, FL)
National Pollutant Discharge Elimination System NON-MAJOR (Tracking pollutant discharge elimination systems) - permit Organizations: JACK WISE (CONTACT/OWNER)
LAKEFRONT AT DEEP CREEK (26369 NADIR RD in PORT CHARLOTTE, FL)
National Pollutant Discharge Elimination System NON-MAJOR (Tracking pollutant discharge elimination systems) - permit Organizations: JACK WISE (CONTACT/OWNER)
HARBOUR HEIGHTS AUTO REPAIR (27070 SUNNYBROOK RD in PUNTA GORDA, FL)
(Resource Conservation and Recovery Act (tracking hazardous waste)) Business NAICS classification: GENERAL AUTOMOTIVE REPAIR.Organizations: WAYNE T. GUTZLER (CONTACT/OWNER)
HERITAGE LAKE PARK (25365 RAMPART BLVD in PUNTA GORDA, FL)
National Pollutant Discharge Elimination System NON-MAJOR (Tracking pollutant discharge elimination systems) - permit Organizations: TONY INABNITT (CONTACT/OWNER)
MARKETING ARM INTERNATIONAL (2156 ONONDAGA LANE in PUNTA GORDA, FL)
COMPLIANCE ACTIVITY (Tracking inspections of insecticide, fungicide, and rodenticide, and toxic substances)
SAN REMO (26374 RAMPART BLVD in PUNTA GORDA, FL)
National Pollutant Discharge Elimination System NON-MAJOR (Tracking pollutant discharge elimination systems) - permit Organizations: ALBERT FONDOUS (CONTACT/OWNER)
Housing units lacking complete kitchen facilities: 1.7%
96.2% Electricity 1.6% Utility gas 1.2% Bottled, tank, or LP gas 0.6% No fuel used
Population in 1990: 7,319. Population change in the 1990s: +3,641 (+49.7%).
Place of birth for U.S.-born residents:
This state: 3,771Northeast: 5,450Midwest: 3,899South: 1,479West: 342
51% of the 33983 zip code residents lived in the same house 5 years ago.
Out of people who lived in different houses, 38% lived in this county.
Out of people who lived in different counties, 50% lived in Florida.
89% of the 33983 zip code residents lived in the same house 1 year ago.
Out of people who lived in different houses, 31% moved from this county.
Out of people who lived in different houses, 26% moved from different county within same state.
Out of people who lived in different houses, 43% moved from different state.
Out of people who lived in different houses, 4% moved from abroad.
Private vs. public school enrollment:
Students in private schools in grades 1 to 8 (elementary and middle school): 256
Students in private schools in grades 9 to 12 (high school):
Students in private undergraduate colleges: 57
Occupation by median earnings in the past 12 months ($)
152,341 Architecture and engineering occupations 91,665 Arts, design, entertainment, sports, and media occupations 83,112 Health diagnosing and treating practitioners and other technical occupations 82,571 Law enforcement workers including supervisors 69,858 Computer and mathematical occupations 64,865 Management occupations
Companies with federal contracts located in this zip code:
HIGH-TECH DIVING & SAFETY INC (27074 SUNNYBROOK RD in PUNTA GORDA, FL; small business) in 3 contracts from 2003 to 2004
$14,732 with Navy for Individual Equipment. Signed on 2004-06-11. Completion date: 2004-07-18.
with Army for Marine Lifesaving and Diving Equipment. Signed on 2003-10-15. Completion date: 2003-10-30.
with Navy for Individual Equipment. Signed on 2004-07-06. Completion date: 2004-07-18.
HYDE, LINDA (27056 SAFE HAVENLANE in PUNTA GORDA, AL; small business)
$6,175 with U.S. Army Corps of Engineers - civil program financing only for Recreation Site Maintenance Services (non-construction). Taking place in MS. Signed on 2003-03-21. Completion date: 2003-09-30.
Top industries in this zip code by the number of employees in 2005:
Health Care and Social Assistance: Home Health Care Services (100-249 employees: 1 establishment, 5-9 employees: 1 establishment, 1-4 employees: 1 establishment)Health Care and Social Assistance: Nursing Care Facilities (100-249: 1)Construction: All Other Specialty Trade Contractors (50-99: 1, 1-4: 2)Construction: Plumbing, Heating, and Air-Conditioning Contractors (20-49: 1, 10-19: 1, 5-9: 1)Accommodation and Food Services: Hotels (except Casino Hotels) and Motels (20-49: 1, 10-19: 1, 1-4: 1)Construction: Electrical Contractors (10-19: 2, 5-9: 2, 1-4: 2)Real Estate and Rental and Leasing: Offices of Real Estate Agents and Brokers (1-4: 11)Other Services (except Public Administration): Religious Organizations (10-19: 1, 1-4: 2)Health Care and Social Assistance: Homes for the Elderly (5-9: 2, 1-4: 2)
People in group quarters in 2010:
106 people in nursing facilities/skilled-nursing facilities
19 people in workers' group living quarters and job corps centers
11 people in group homes intended for adults
People in group quarters in 2000:
111 people in nursing homes
Fatal accident statistics in 2014:
Fatal accident count: 2Vehicles involved in fatal accidents: 3Fatal accidents caused by drunken drivers: 0Fatalities: 2Persons involved in fatal accidents: 4Pedestrians involved in fatal accidents: 0
Fatal accident statistics in 2013:
Fatal accident count: 2Vehicles involved in fatal accidents: 2Fatal accidents caused by drunken drivers: 1Fatalities: 2Persons involved in fatal accidents: 5Pedestrians involved in fatal accidents: 1
Home Mortgage Disclosure Act Aggregated Statistics For Year 2009(Based on 8 partial tracts) A) FHA, FSA/RHS & VA B) Conventional C) Refinancings D) Home Improvement Loans F) Non-occupant Loans on G) Loans On Manufactured Number Average Value Number Average Value Number Average Value Number Average Value Number Average Value Number Average Value
LOANS ORIGINATED 84 $136,451 172 $104,853 251 $130,231 4 $45,832 115 $103,885 2 $63,365 APPLICATIONS APPROVED, NOT ACCEPTED 3 $142,103 14 $121,454 27 $140,966 5 $11,034 12 $113,665 0 $0 APPLICATIONS DENIED 31 $144,840 43 $95,663 188 $153,559 17 $24,810 50 $109,493 9 $68,231 APPLICATIONS WITHDRAWN 12 $131,367 25 $114,157 97 $152,432 0 $0 20 $114,655 0 $0 FILES CLOSED FOR INCOMPLETENESS 5 $129,342 8 $111,384 21 $108,037 0 $0 7 $75,309 0 $0
Aggregated Statistics For Year 2008(Based on 8 partial tracts) A) FHA, FSA/RHS & VA B) Conventional C) Refinancings D) Home Improvement Loans E) Loans on Dwellings For 5+ Families F) Non-occupant Loans on G) Loans On Manufactured Number Average Value Number Average Value Number Average Value Number Average Value Number Average Value Number Average Value Number Average Value
LOANS ORIGINATED 55 $162,103 273 $131,634 232 $139,144 18 $68,041 8 $550,649 164 $129,320 4 $51,618 APPLICATIONS APPROVED, NOT ACCEPTED 7 $147,791 22 $154,333 68 $129,914 9 $42,859 0 $0 27 $151,500 6 $90,103 APPLICATIONS DENIED 9 $167,007 63 $196,976 213 $159,428 18 $72,793 0 $0 81 $175,827 1 $35,480 APPLICATIONS WITHDRAWN 6 $184,763 17 $163,456 85 $168,997 8 $97,141 0 $0 25 $151,050 2 $56,840 FILES CLOSED FOR INCOMPLETENESS 0 $0 10 $194,496 23 $207,123 2 $41,795 2 $147,955 5 $245,086 0 $0
Aggregated Statistics For Year 2007(Based on 8 partial tracts) A) FHA, FSA/RHS & VA B) Conventional C) Refinancings D) Home Improvement Loans E) Loans on Dwellings For 5+ Families F) Non-occupant Loans on G) Loans On Manufactured Number Average Value Number Average Value Number Average Value Number Average Value Number Average Value Number Average Value Number Average Value
LOANS ORIGINATED 52 $189,510 600 $152,541 492 $164,401 32 $101,244 0 $0 250 $146,590 12 $73,809 APPLICATIONS APPROVED, NOT ACCEPTED 3 $185,013 83 $140,064 163 $178,204 21 $59,183 0 $0 68 $160,770 5 $68,618 APPLICATIONS DENIED 21 $196,914 135 $173,877 460 $206,295 53 $101,706 0 $0 125 $162,739 16 $99,527 APPLICATIONS WITHDRAWN 2 $213,590 81 $179,831 195 $194,408 8 $137,389 2 $417,950 50 $195,495 0 $0 FILES CLOSED FOR INCOMPLETENESS 0 $0 35 $148,258 64 $195,318 4 $138,320 0 $0 16 $172,526 2 $85,260
Aggregated Statistics For Year 2006(Based on 8 partial tracts) A) FHA, FSA/RHS & VA B) Conventional C) Refinancings D) Home Improvement Loans E) Loans on Dwellings For 5+ Families F) Non-occupant Loans on G) Loans On Manufactured Number Average Value Number Average Value Number Average Value Number Average Value Number Average Value Number Average Value Number Average Value
LOANS ORIGINATED 21 $183,092 1,302 $160,549 795 $173,141 85 $87,295 1 $2,148,200 725 $156,831 17 $68,899 APPLICATIONS APPROVED, NOT ACCEPTED 0 $0 170 $156,006 140 $177,477 27 $64,601 0 $0 111 $156,470 11 $61,617 APPLICATIONS DENIED 3 $184,800 272 $178,861 352 $199,965 64 $90,769 0 $0 175 $178,636 8 $79,476 APPLICATIONS WITHDRAWN 4 $193,925 225 $184,738 254 $190,833 11 $69,318 0 $0 120 $175,147 4 $56,768 FILES CLOSED FOR INCOMPLETENESS 2 $156,315 21 $188,041 119 $186,760 3 $19,503 0 $0 27 $193,769 0 $0
Aggregated Statistics For Year 2005(Based on 8 partial tracts) A) FHA, FSA/RHS & VA B) Conventional C) Refinancings D) Home Improvement Loans E) Loans on Dwellings For 5+ Families F) Non-occupant Loans on G) Loans On Manufactured Number Average Value Number Average Value Number Average Value Number Average Value Number Average Value Number Average Value Number Average Value
LOANS ORIGINATED 15 $192,531 1,381 $155,051 723 $161,673 77 $86,303 2 $334,360 653 $142,419 33 $53,244 APPLICATIONS APPROVED, NOT ACCEPTED 2 $132,435 177 $139,325 113 $147,728 16 $48,228 0 $0 83 $139,334 27 $53,974 APPLICATIONS DENIED 2 $125,385 278 $152,763 243 $166,577 43 $70,954 0 $0 103 $141,944 33 $71,363 APPLICATIONS WITHDRAWN 0 $0 211 $179,403 269 $177,509 28 $101,428 0 $0 90 $154,868 1 $36,940 FILES CLOSED FOR INCOMPLETENESS 0 $0 48 $157,322 148 $178,669 2 $49,190 0 $0 22 $177,473 0 $0
Aggregated Statistics For Year 2004(Based on 8 partial tracts) A) FHA, FSA/RHS & VA B) Conventional C) Refinancings D) Home Improvement Loans E) Loans on Dwellings For 5+ Families F) Non-occupant Loans on G) Loans On Manufactured Number Average Value Number Average Value Number Average Value Number Average Value Number Average Value Number Average Value Number Average Value
LOANS ORIGINATED 35 $146,515 1,005 $124,791 529 $123,520 75 $64,503 2 $52,760 467 $117,171 16 $56,712 APPLICATIONS APPROVED, NOT ACCEPTED 7 $143,774 156 $128,420 100 $116,387 25 $54,570 0 $0 72 $124,379 16 $48,379 APPLICATIONS DENIED 8 $166,344 137 $130,531 275 $130,917 68 $55,902 0 $0 81 $125,419 17 $53,349 APPLICATIONS WITHDRAWN 7 $125,810 125 $165,656 188 $136,159 15 $68,504 0 $0 66 $134,953 0 $0 FILES CLOSED FOR INCOMPLETENESS 2 $109,505 29 $108,951 107 $142,667 7 $23,271 0 $0 18 $118,170 0 $0
Aggregated Statistics For Year 2003(Based on 8 partial tracts) A) FHA, FSA/RHS & VA B) Conventional C) Refinancings D) Home Improvement Loans F) Non-occupant Loans on Number Average Value Number Average Value Number Average Value Number Average Value Number Average Value
LOANS ORIGINATED 47 $135,127 834 $110,980 1,263 $107,874 42 $41,704 398 $95,981 APPLICATIONS APPROVED, NOT ACCEPTED 5 $145,452 83 $115,786 187 $100,044 20 $31,018 32 $113,358 APPLICATIONS DENIED 14 $132,149 75 $111,090 425 $114,929 51 $43,671 48 $90,805 APPLICATIONS WITHDRAWN 5 $170,190 86 $119,803 155 $115,160 4 $13,500 42 $91,432 FILES CLOSED FOR INCOMPLETENESS 0 $0 14 $133,112 40 $135,248 2 $83,590 4 $97,158
Aggregated Statistics For Year 2002(Based on 8 partial tracts) A) FHA, FSA/RHS & VA B) Conventional C) Refinancings D) Home Improvement Loans E) Loans on Dwellings For 5+ Families F) Non-occupant Loans on Number Average Value Number Average Value Number Average Value Number Average Value Number Average Value Number Average Value
LOANS ORIGINATED 36 $103,214 789 $100,917 720 $100,698 53 $32,703 3 $51,330 253 $90,139 APPLICATIONS APPROVED, NOT ACCEPTED 0 $0 53 $85,894 111 $107,989 16 $40,558 0 $0 20 $54,009 APPLICATIONS DENIED 5 $74,940 60 $122,370 245 $92,668 50 $31,395 0 $0 48 $57,204 APPLICATIONS WITHDRAWN 2 $74,010 67 $97,351 104 $87,265 5 $59,884 0 $0 14 $79,199 FILES CLOSED FOR INCOMPLETENESS 0 $0 18 $89,418 48 $106,709 0 $0 0 $0 6 $116,265
Aggregated Statistics For Year 2001(Based on 8 partial tracts) A) FHA, FSA/RHS & VA B) Conventional C) Refinancings D) Home Improvement Loans F) Non-occupant Loans on Number Average Value Number Average Value Number Average Value Number Average Value Number Average Value
LOANS ORIGINATED 74 $116,458 610 $95,569 529 $91,664 73 $28,466 210 $81,186 APPLICATIONS APPROVED, NOT ACCEPTED 0 $0 43 $100,120 86 $84,914 16 $20,789 22 $80,424 APPLICATIONS DENIED 13 $117,892 50 $107,656 230 $88,511 71 $24,438 22 $54,891 APPLICATIONS WITHDRAWN 5 $90,160 37 $115,739 171 $94,667 8 $17,182 19 $86,836 FILES CLOSED FOR INCOMPLETENESS 0 $0 11 $60,383 27 $99,553 2 $10,185 4 $47,662
Aggregated Statistics For Year 2000(Based on 8 partial tracts) A) FHA, FSA/RHS & VA B) Conventional C) Refinancings D) Home Improvement Loans E) Loans on Dwellings For 5+ Families F) Non-occupant Loans on Number Average Value Number Average Value Number Average Value Number Average Value Number Average Value Number Average Value
LOANS ORIGINATED 72 $101,863 522 $90,639 132 $74,329 49 $19,758 2 $328,510 83 $112,360 APPLICATIONS APPROVED, NOT ACCEPTED 2 $80,000 31 $86,165 43 $74,322 9 $24,522 0 $0 6 $71,048 APPLICATIONS DENIED 2 $106,605 78 $85,473 122 $55,008 32 $23,868 0 $0 11 $84,655 APPLICATIONS WITHDRAWN 0 $0 30 $107,352 87 $64,568 6 $20,905 0 $0 10 $82,443 FILES CLOSED FOR INCOMPLETENESS 3 $116,683 8 $87,329 24 $96,533 0 $0 0 $0 10 $108,243
Aggregated Statistics For Year 1999(Based on 4 partial tracts) A) FHA, FSA/RHS & VA B) Conventional C) Refinancings D) Home Improvement Loans F) Non-occupant Loans on Number Average Value Number Average Value Number Average Value Number Average Value Number Average Value
LOANS ORIGINATED 40 $94,526 236 $84,146 139 $80,566 12 $29,458 61 $83,860 APPLICATIONS APPROVED, NOT ACCEPTED 1 $71,530 17 $82,079 37 $73,068 10 $33,022 8 $81,736 APPLICATIONS DENIED 4 $89,498 34 $81,243 83 $69,601 19 $26,899 4 $79,472 APPLICATIONS WITHDRAWN 1 $90,230 18 $84,531 60 $82,968 6 $30,697 5 $92,488 FILES CLOSED FOR INCOMPLETENESS 1 $70,690 6 $120,930 7 $98,764 0 $0 0 $0
Detailed HMDA statistics for the following Tracts:
0102.00
,
0201.00 ,
0210.00
Private Mortgage Insurance Companies Aggregated Statistics For Year 2009(Based on 8 partial tracts) A) Conventional B) Refinancings C) Non-occupant Loans on Number Average Value Number Average Value Number Average Value
LOANS ORIGINATED 2 $94,455 5 $152,024 0 $0 APPLICATIONS APPROVED, NOT ACCEPTED 11 $215,416 2 $110,340 8 $243,665 APPLICATIONS DENIED 1 $217,640 0 $0 0 $0 APPLICATIONS WITHDRAWN 1 $237,430 0 $0 1 $84,640 FILES CLOSED FOR INCOMPLETENESS 0 $0 0 $0 0 $0
Aggregated Statistics For Year 2008(Based on 8 partial tracts) A) Conventional B) Refinancings C) Non-occupant Loans on Number Average Value Number Average Value Number Average Value
LOANS ORIGINATED 51 $171,419 15 $190,561 23 $165,480 APPLICATIONS APPROVED, NOT ACCEPTED 17 $231,368 27 $216,529 21 $216,929 APPLICATIONS DENIED 10 $182,793 2 $102,815 8 $156,314 APPLICATIONS WITHDRAWN 5 $178,548 2 $142,665 2 $173,865 FILES CLOSED FOR INCOMPLETENESS 2 $139,595 2 $102,815 0 $0
Aggregated Statistics For Year 2007(Based on 8 partial tracts) A) Conventional B) Refinancings C) Non-occupant Loans on Number Average Value Number Average Value Number Average Value
LOANS ORIGINATED 143 $206,974 39 $245,013 35 $218,763 APPLICATIONS APPROVED, NOT ACCEPTED 67 $221,385 13 $243,152 46 $199,365 APPLICATIONS DENIED 2 $257,335 5 $219,438 4 $237,752 APPLICATIONS WITHDRAWN 22 $243,621 3 $269,953 9 $300,910 FILES CLOSED FOR INCOMPLETENESS 0 $0 0 $0 0 $0
Aggregated Statistics For Year 2006(Based on 8 partial tracts) A) Conventional B) Refinancings C) Non-occupant Loans on Number Average Value Number Average Value Number Average Value
LOANS ORIGINATED 124 $219,641 47 $267,425 57 $195,824 APPLICATIONS APPROVED, NOT ACCEPTED 30 $256,267 12 $251,479 18 $241,787 APPLICATIONS DENIED 15 $216,316 3 $290,893 12 $213,572 APPLICATIONS WITHDRAWN 4 $387,482 3 $302,040 3 $331,017 FILES CLOSED FOR INCOMPLETENESS 2 $231,395 0 $0 0 $0
Aggregated Statistics For Year 2005(Based on 8 partial tracts) A) Conventional B) Refinancings C) Non-occupant Loans on Number Average Value Number Average Value Number Average Value
LOANS ORIGINATED 204 $187,089 20 $216,034 94 $167,397 APPLICATIONS APPROVED, NOT ACCEPTED 37 $200,276 7 $166,463 15 $188,815 APPLICATIONS DENIED 5 $261,710 0 $0 2 $268,090 APPLICATIONS WITHDRAWN 5 $179,280 3 $216,220 5 $177,430 FILES CLOSED FOR INCOMPLETENESS 2 $463,090 0 $0 0 $0
Aggregated Statistics For Year 2004(Based on 8 partial tracts) A) Conventional B) Refinancings C) Non-occupant Loans on Number Average Value Number Average Value Number Average Value
LOANS ORIGINATED 184 $153,252 39 $179,672 87 $135,822 APPLICATIONS APPROVED, NOT ACCEPTED 48 $179,264 13 $147,432 12 $152,701 APPLICATIONS DENIED 2 $180,555 2 $116,190 3 $197,830 APPLICATIONS WITHDRAWN 15 $177,213 0 $0 5 $166,182 FILES CLOSED FOR INCOMPLETENESS 0 $0 0 $0 0 $0
Aggregated Statistics For Year 2003(Based on 8 partial tracts) A) Conventional B) Refinancings C) Non-occupant Loans on Number Average Value Number Average Value Number Average Value
LOANS ORIGINATED 175 $130,794 48 $134,077 67 $124,361 APPLICATIONS APPROVED, NOT ACCEPTED 40 $144,406 34 $133,770 18 $136,185 APPLICATIONS DENIED 7 $162,314 0 $0 2 $135,105 APPLICATIONS WITHDRAWN 7 $180,554 3 $211,943 2 $111,175 FILES CLOSED FOR INCOMPLETENESS 0 $0 0 $0 0 $0
Aggregated Statistics For Year 2002(Based on 8 partial tracts) A) Conventional B) Refinancings C) Non-occupant Loans on Number Average Value Number Average Value Number Average Value
LOANS ORIGINATED 154 $115,956 52 $129,813 53 $107,751 APPLICATIONS APPROVED, NOT ACCEPTED 59 $125,129 24 $132,535 15 $130,496 APPLICATIONS DENIED 7 $116,070 3 $128,730 3 $135,973 APPLICATIONS WITHDRAWN 12 $124,167 7 $111,056 2 $93,130 FILES CLOSED FOR INCOMPLETENESS 0 $0 3 $141,547 2 $127,055
Aggregated Statistics For Year 2001(Based on 8 partial tracts) A) Conventional B) Refinancings C) Non-occupant Loans on Number Average Value Number Average Value Number Average Value
LOANS ORIGINATED 119 $112,429 40 $134,396 33 $99,552 APPLICATIONS APPROVED, NOT ACCEPTED 24 $142,162 16 $146,191 11 $134,175 APPLICATIONS DENIED 2 $127,355 2 $142,420 2 $112,010 APPLICATIONS WITHDRAWN 5 $109,670 4 $144,078 3 $155,477 FILES CLOSED FOR INCOMPLETENESS 0 $0 0 $0 0 $0
Aggregated Statistics For Year 2000(Based on 8 partial tracts) A) Conventional B) Refinancings C) Non-occupant Loans on Number Average Value Number Average Value Number Average Value
LOANS ORIGINATED 117 $102,359 10 $122,069 11 $82,022 APPLICATIONS APPROVED, NOT ACCEPTED 11 $96,735 0 $0 0 $0 APPLICATIONS DENIED 2 $128,890 0 $0 2 $95,295 APPLICATIONS WITHDRAWN 2 $65,200 0 $0 0 $0 FILES CLOSED FOR INCOMPLETENESS 0 $0 0 $0 0 $0
Aggregated Statistics For Year 1999(Based on 4 partial tracts) A) Conventional B) Refinancings C) Non-occupant Loans on Number Average Value Number Average Value Number Average Value
LOANS ORIGINATED 43 $102,050 6 $101,347 13 $91,678 APPLICATIONS APPROVED, NOT ACCEPTED 2 $152,200 0 $0 1 $120,600 APPLICATIONS DENIED 3 $100,533 1 $69,030 1 $48,240 APPLICATIONS WITHDRAWN 1 $72,470 0 $0 0 $0 FILES CLOSED FOR INCOMPLETENESS 0 $0 0 $0 0 $0
Detailed PMIC statistics for the following Tracts:
0102.00
,
0201.00 ,
0210.00
2002 - 2018 National Fire Incident Reporting System (NFIRS) incidents See full 2006 National Fire Incident Reporting System statistics for zip code 33983, Florida
Most common first names in zip code 33983 among deceased individuals Name Count Lived (average)
John 90 76.2 years Robert 60 73.4 years William 59 77.3 years Mary 47 80.3 years James 41 74.8 years Joseph 37 76.9 years Edward 30 79.5 years Richard 29 77.9 years Charles 28 77.3 years Dorothy 28 79.6 years
Most common last names in zip code 33983 among deceased individuals Last name Count Lived (average)
Smith 22 84.4 years Miller 14 78.7 years Brown 12 75.3 years Anderson 10 80.4 years Thompson 10 80.0 years Johnson 10 79.3 years Williams 9 88.8 years Jones 7 75.9 years Davis 6 72.8 years Lee 6 83.3 years
Businesses in zip code 33983
Name Count Name Count
7-Eleven 1 Penske 1 Applebee's 1 Subway 1 FedEx 2 T-Mobile 1 Hilton 1 UPS 1 Holiday Inn 1 Walmart 1
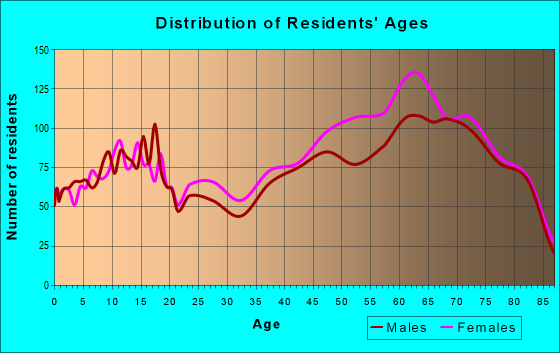
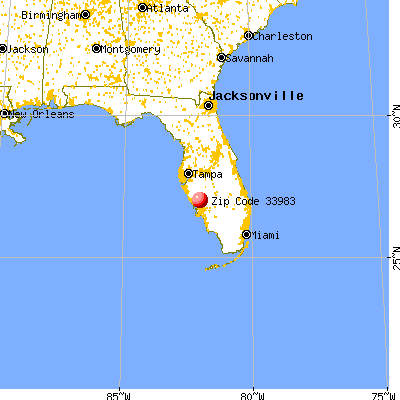


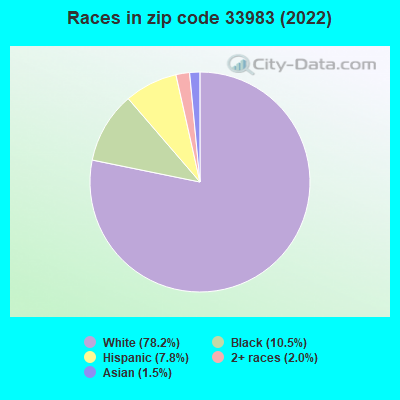


 Nearest zip codes: 33980, 34269, 33952, 34288, 33954, 33950.
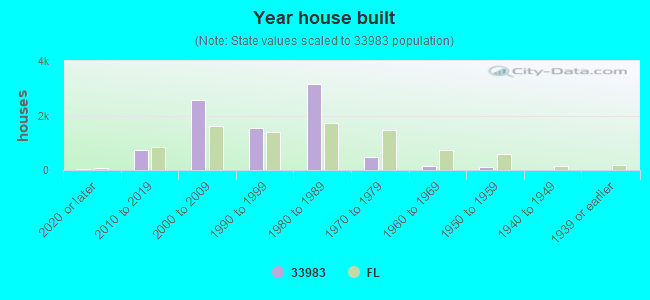

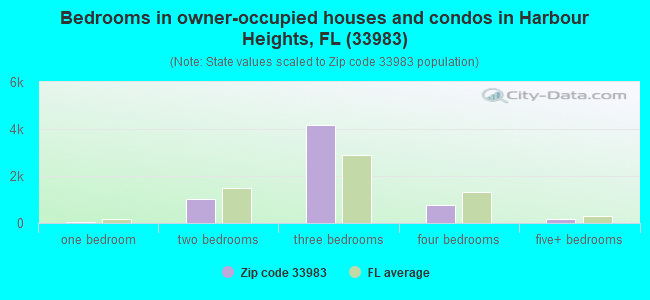
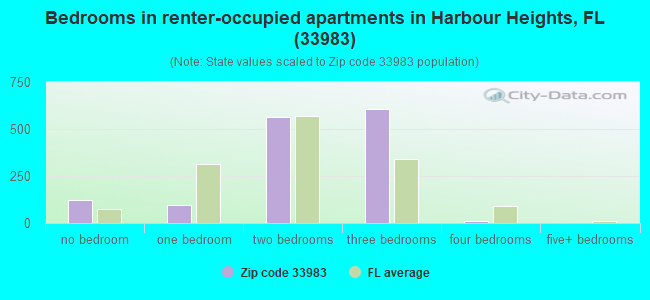
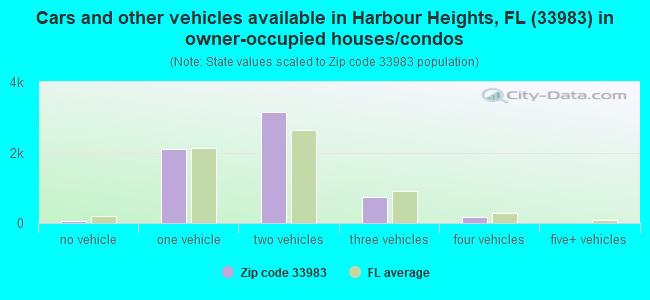
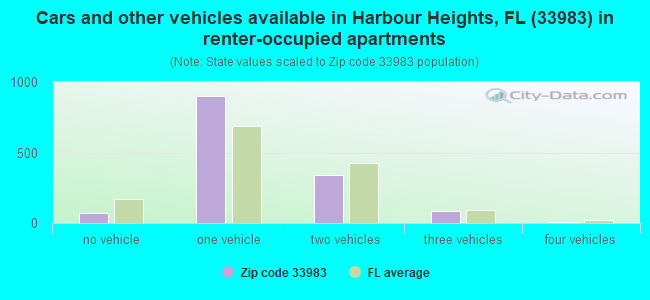


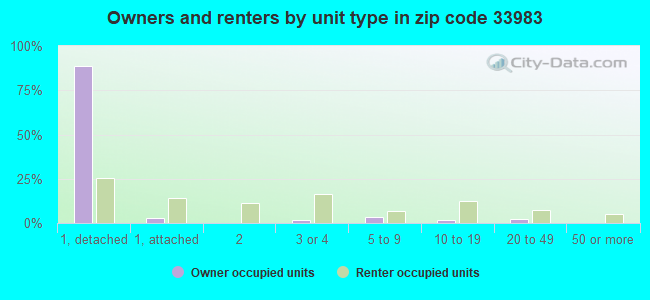
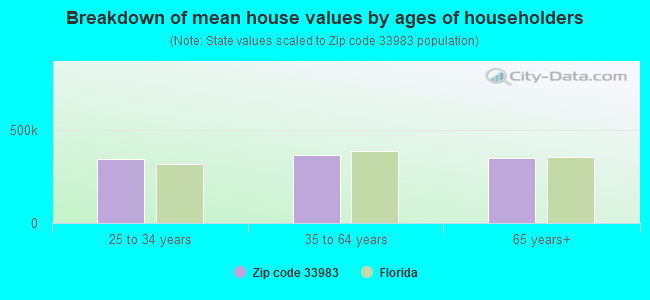


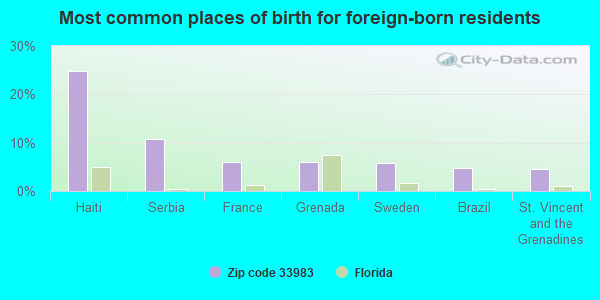
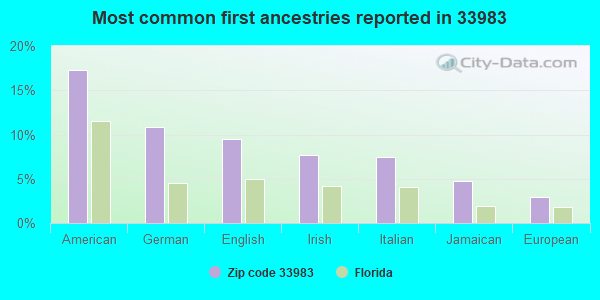
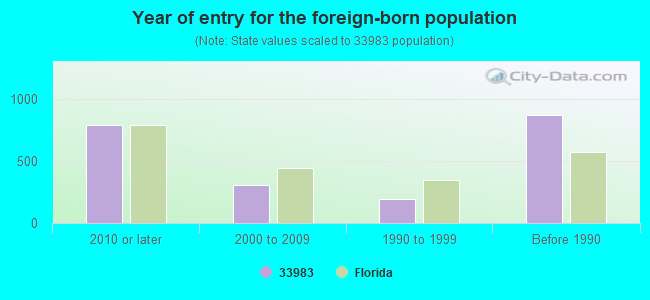


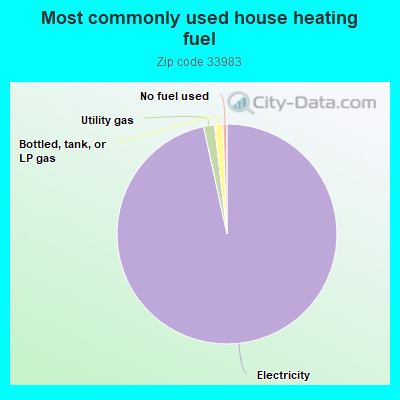
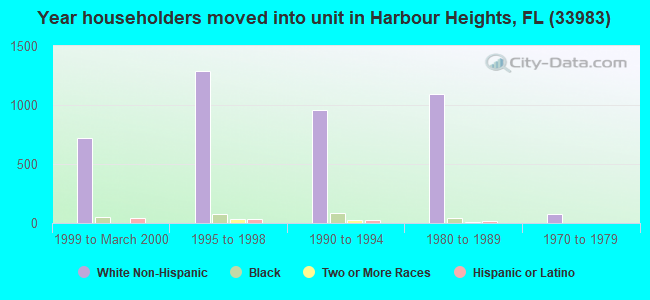
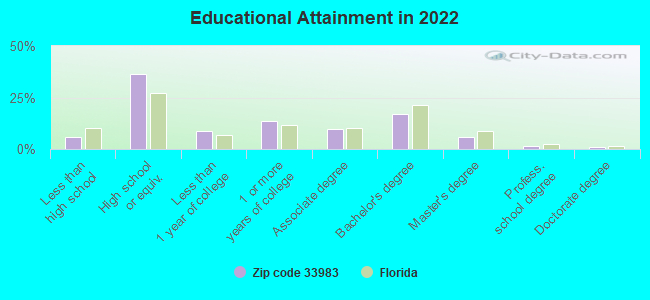
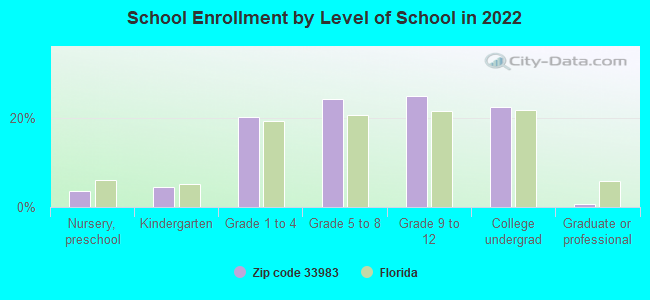
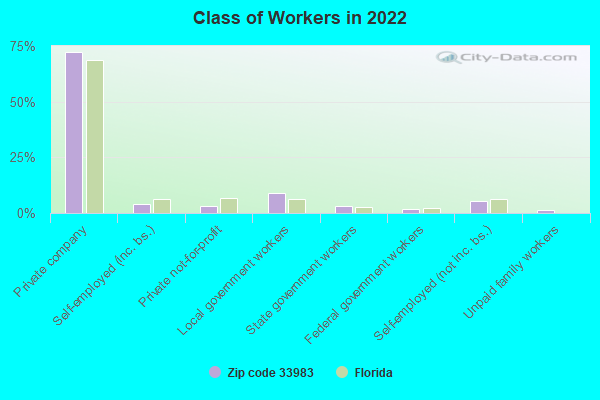
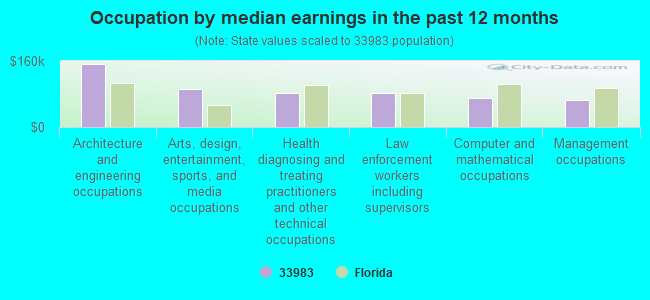
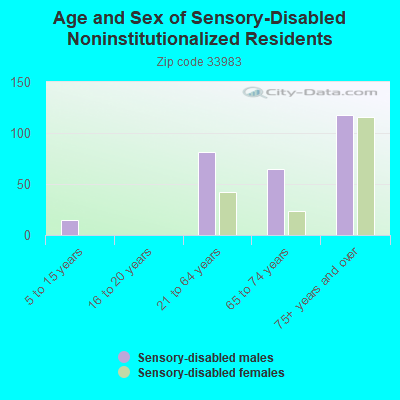
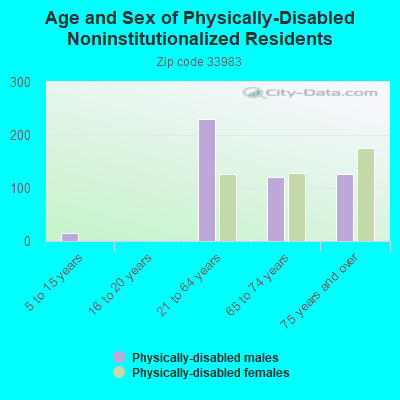
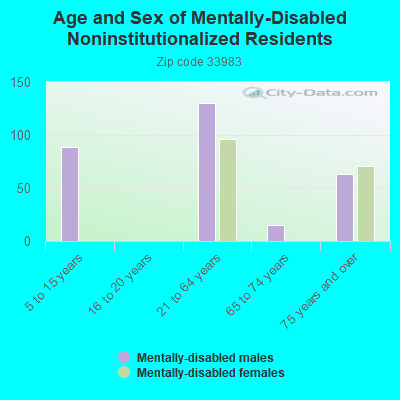
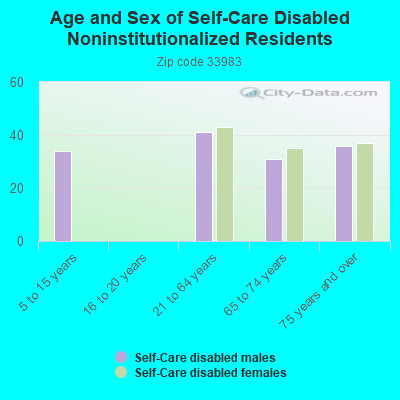
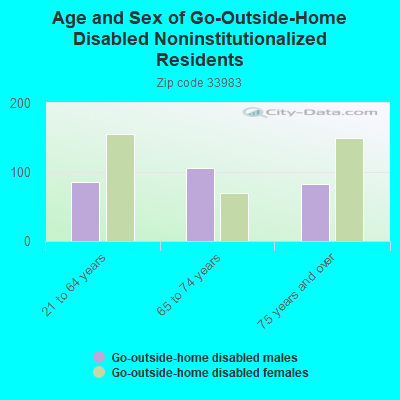
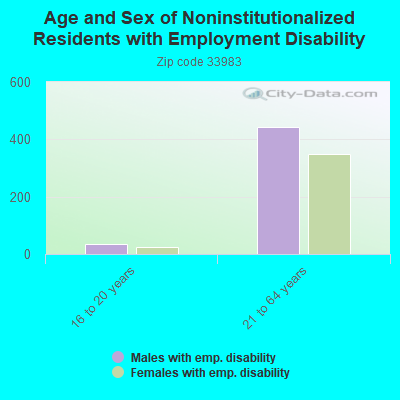
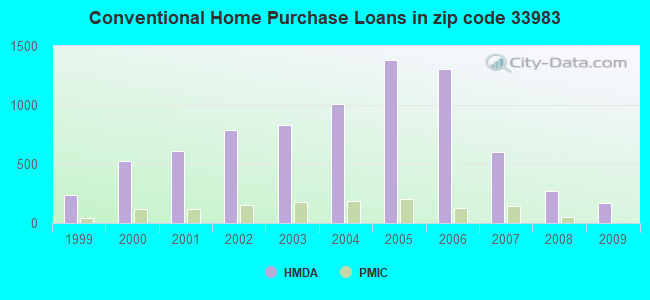
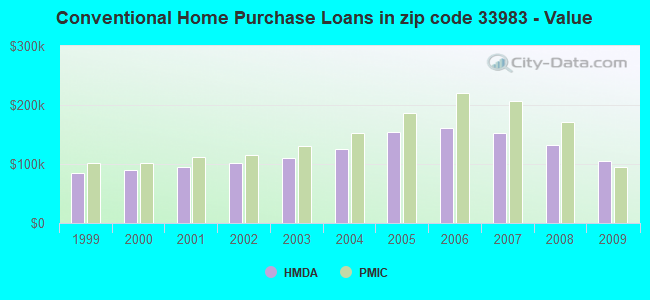
 According to the data from the years 2002 - 2018 the average number of fire incidents per year is 27. The highest number of fire incidents - 55 took place in 2009, and the least - 0 in 2003. The data has a rising trend.
 When looking into fire subcategories, the most incidents belonged to: Outside Fires (52.9%), and Structure Fires (26.8%).