Estimated zip code population in 2022: 16,863 Zip code population in 2010: 16,874 Zip code population in 2000: 16,649
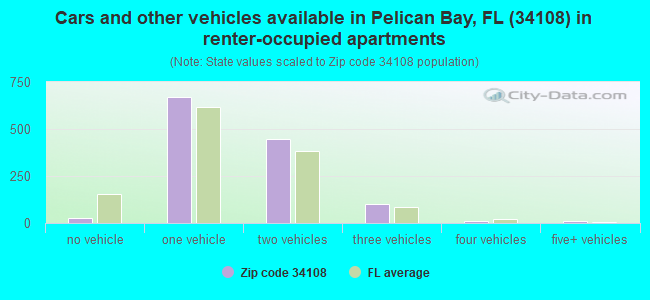
Houses and condos: 15,547 Renter-occupied apartments: 1,270
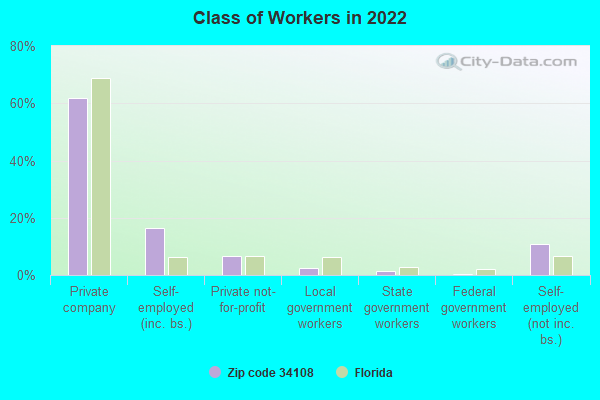
% of renters here:
14%
State:
33%
March 2022 cost of living index in zip code 34108: 100.1 (near average, U.S. average is 100)
Land area: 7.8 sq. mi. Water area: 1.5 sq. mi.
Population density: 2,172 people per square mile
(low).
OSM Map
General Map
Google Map
MSN Map
OSM Map
General Map
Google Map
MSN Map
OSM Map
General Map
Google Map
MSN Map
OSM Map
General Map
Google Map
MSN Map
Please wait while loading the map...
Real estate property taxes paid for housing units in 2022:
This zip code:
0.6% ($7,084)
Florida:
0.7% ($2,529)
Median real estate property taxes paid for housing units with mortgages in 2022: $5,669 (0.6%) Median real estate property taxes paid for housing units with no mortgage in 2022: $7,875 (0.6%)
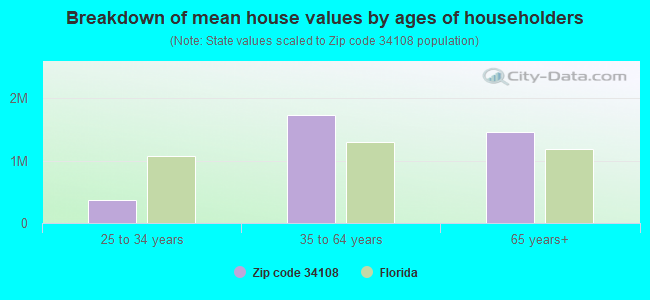
Estimated median house/condo value in 2022: $1,094,414
34108:
$1,094,414
Florida:
$354,100
According to our research of Florida and other state lists, there were 7 registered sex offenders living in 34108 zip code as of April 27, 2024. The ratio of all residents to sex offenders in zip code 34108 is 2,405 to 1. The ratio of registered sex offenders to all residents in this zip code is much lower than the state average.
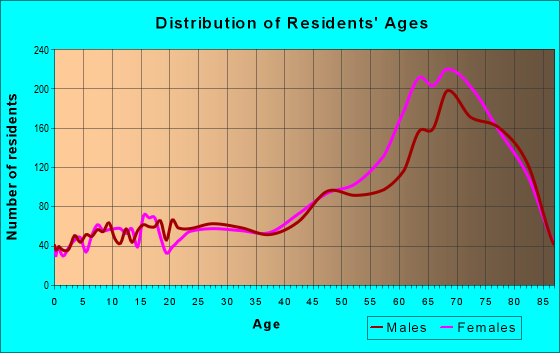
Median resident age:
This zip code:
67.6 years
Florida median age:
42.7 years
Average household size:
This zip code:
1.9 people
Florida:
2.5 people
Averages for the 2020 tax year for zip code 34108, filed in 2021:
Average Adjusted Gross Income (AGI) in 2020: $529,206 (Individual Income Tax Returns)
Here:
$529,206
State:
$82,200
Salary/wage: $207,427 (reported on 54.0% of returns)
Here:
$207,427
State:
$58,347
(% of AGI for various income ranges: 1191.4% for AGIs below $25k, 3680.8% for AGIs $25k-50k, 6093.0% for AGIs $50k-75k, 7602.1% for AGIs $75k-100k, 11648.0% for AGIs $100k-200k, 214238.0% for AGIs over 200k)
Taxable interest for individuals: $23,535 (reported on 62.5% of returns)
This zip code:
$23,535
Florida:
$4,272
(% of AGI for various income ranges: 71.2% for AGIs below $25k, 114.6% for AGIs $25k-50k, 272.4% for AGIs $50k-75k, 626.9% for AGIs $75k-100k, 1448.4% for AGIs $100k-200k, 30089.5% for AGIs over 200k)
Ordinary dividends: $100,259 (reported on 59.0% of returns)
Here:
$100,259
State:
$15,863
(% of AGI for various income ranges: 178.3% for AGIs below $25k, 423.1% for AGIs $25k-50k, 936.8% for AGIs $50k-75k, 2127.9% for AGIs $75k-100k, 6372.7% for AGIs $100k-200k, 121212.9% for AGIs over 200k)
Net capital gain/loss in AGI: +$349,134 (reported on 57.1% of returns)
Here:
+$349,134
State:
+$62,983
(% of AGI for various income ranges: 45.4% for AGIs below $25k, 202.7% for AGIs $25k-50k, 492.4% for AGIs $50k-75k, 948.6% for AGIs $75k-100k, 4771.6% for AGIs $100k-200k, 439561.0% for AGIs over 200k)
Profit/loss from business: +$66,317 (reported on 20.7% of returns)
Here:
+$66,317
State:
+$9,719
(% of AGI for various income ranges: 264.9% for AGIs below $25k, 311.7% for AGIs $25k-50k, 436.0% for AGIs $50k-75k, 504.5% for AGIs $75k-100k, 1359.8% for AGIs $100k-200k, 26927.8% for AGIs over 200k)
Taxable individual retirement arrangement distribution: $70,372 (reported on 25.1% of returns)
34108:
$70,372
Florida:
$24,823
(% of AGI for various income ranges: 149.0% for AGIs below $25k, 331.7% for AGIs $25k-50k, 785.6% for AGIs $50k-75k, 1944.8% for AGIs $75k-100k, 5745.1% for AGIs $100k-200k, 29402.2% for AGIs over 200k)
Self-employed (Keogh) retirement plans: $40,234 (reported on 3.2% of returns)
34108:
$40,234
Florida:
$29,694
(% of AGI for various income ranges: 19.0% for AGIs $25k-50k, 159.2% for AGIs $100k-200k, 2616.6% for AGIs over 200k)
Total itemized deductions: $124,706 (reported on 30.2% of returns)
Here:
$124,706
State:
$45,393
(% of AGI for various income ranges: 341.5% for AGIs below $25k, 492.6% for AGIs $25k-50k, 952.8% for AGIs $50k-75k, 1938.6% for AGIs $75k-100k, 4515.5% for AGIs $100k-200k, 74776.8% for AGIs over 200k)
Charity contributions: $91,852 (reported on 27.4% of returns)
Here:
$91,852
State:
$20,178
(% of AGI for various income ranges: 15.3% for AGIs below $25k, 50.2% for AGIs $25k-50k, 121.0% for AGIs $50k-75k, 296.9% for AGIs $75k-100k, 906.7% for AGIs $100k-200k, 54873.4% for AGIs over 200k)
Taxes paid: $8,827 (reported on 30.0% of returns)
34108:
$8,827
State:
$6,967
(% of AGI for various income ranges: 49.7% for AGIs below $25k, 92.1% for AGIs $25k-50k, 188.8% for AGIs $50k-75k, 466.9% for AGIs $75k-100k, 902.7% for AGIs $100k-200k, 3991.5% for AGIs over 200k)
Earned income credit: $1,595 (reported on 6.4% of returns)
Here:
$1,595
State:
$2,306
(% of AGI for various income ranges: 62.9% for AGIs below $25k, 36.4% for AGIs $25k-50k)
Percentage of individuals using paid preparers for their 2020 taxes: 90.3%
Here:
90%
State:
92%
(% for various income ranges: 87.4% for AGIs below $25k, 89.7% for AGIs $25k-50k, 89.2% for AGIs $50k-75k, 90.9% for AGIs $75k-100k, 89.8% for AGIs $100k-200k, 93.0% for AGIs over 200k)
Averages for the 2012 tax year for zip code 34108, filed in 2013:
Average Adjusted Gross Income (AGI) in 2012: $335,705 (Individual Income Tax Returns)
Here:
$335,705
State:
$60,316
Salary/wage: $122,822 (reported on 59.2% of returns)
Here:
$122,822
State:
$45,277
(% of AGI for various income ranges: 65.8% for AGIs below $25k, 67.8% for AGIs $25k-50k, 51.4% for AGIs $50k-75k, 36.7% for AGIs $75k-100k, 23.1% for AGIs $100k-200k, 18.9% for AGIs over 200k)
Taxable interest for individuals: $20,364 (reported on 56.1% of returns)
This zip code:
$20,364
Florida:
$3,587
(% of AGI for various income ranges: 3.7% for AGIs below $25k, 2.2% for AGIs $25k-50k, 3.4% for AGIs $50k-75k, 4.3% for AGIs $75k-100k, 4.0% for AGIs $100k-200k, 3.4% for AGIs over 200k)
Ordinary dividends: $82,935 (reported on 50.2% of returns)
Here:
$82,935
State:
$12,831
(% of AGI for various income ranges: 7.8% for AGIs below $25k, 5.8% for AGIs $25k-50k, 6.7% for AGIs $50k-75k, 10.2% for AGIs $75k-100k, 11.8% for AGIs $100k-200k, 12.8% for AGIs over 200k)
Net capital gain/loss in AGI: +$192,805 (reported on 45.8% of returns)
Here:
+$192,805
State:
+$33,493
(% of AGI for various income ranges: 1.2% for AGIs $25k-50k, 1.9% for AGIs $50k-75k, 2.5% for AGIs $75k-100k, 5.9% for AGIs $100k-200k, 29.8% for AGIs over 200k)
Profit/loss from business: +$53,983 (reported on 18.7% of returns)
Here:
+$53,983
State:
+$10,012
(% of AGI for various income ranges: 9.5% for AGIs below $25k, 4.9% for AGIs $25k-50k, 3.2% for AGIs $50k-75k, 3.0% for AGIs $75k-100k, 3.9% for AGIs $100k-200k, 2.8% for AGIs over 200k)
Taxable individual retirement arrangement distribution: $81,662 (reported on 29.9% of returns)
34108:
$81,662
Florida:
$21,544
(% of AGI for various income ranges: 6.9% for AGIs below $25k, 4.8% for AGIs $25k-50k, 8.3% for AGIs $50k-75k, 12.1% for AGIs $75k-100k, 19.2% for AGIs $100k-200k, 6.3% for AGIs over 200k)
Self-employment retirement plans: $36,742 (reported on 2.0% of returns)
34108:
$36,742
Florida:
$20,611
(% of AGI for various income ranges: 0.5% for AGIs $25k-50k, 0.3% for AGIs $100k-200k, 0.2% for AGIs over 200k)
Total itemized deductions: $81,330 (13% of AGI, reported on 50.4% of returns)
Here:
$81,330
State:
$25,533
Here:
13.1% of AGI
State:
18.0% of AGI
(% of AGI for various income ranges: 27.3% for AGIs below $25k, 16.3% for AGIs $25k-50k, 17.8% for AGIs $50k-75k, 20.8% for AGIs $75k-100k, 22.7% for AGIs $100k-200k, 10.9% for AGIs over 200k)
Charity contributions: $26,361 (reported on 44.8% of returns)
Here:
$26,361
State:
$5,698
(% of AGI for various income ranges: 1.5% for AGIs below $25k, 1.1% for AGIs $25k-50k, 1.9% for AGIs $50k-75k, 2.6% for AGIs $75k-100k, 3.2% for AGIs $100k-200k, 3.7% for AGIs over 200k)
Taxes paid: $27,075 (reported on 49.8% of returns)
34108:
$27,075
State:
$6,203
(% of AGI for various income ranges: 6.1% for AGIs below $25k, 3.5% for AGIs $25k-50k, 4.7% for AGIs $50k-75k, 6.4% for AGIs $75k-100k, 7.7% for AGIs $100k-200k, 3.7% for AGIs over 200k)
Earned income credit: $1,727 (reported on 8.8% of returns)
Here:
$1,727
State:
$2,372
(% of AGI for various income ranges: 3.6% for AGIs below $25k, 0.5% for AGIs $25k-50k)
Percentage of individuals using paid preparers for their 2012 taxes: 67.5%
Here:
67%
State:
54%
(% for various income ranges: 55.6% for AGIs below $25k, 56.1% for AGIs $25k-50k, 61.7% for AGIs $50k-75k, 72.0% for AGIs $75k-100k, 75.9% for AGIs $100k-200k, 89.7% for AGIs over 200k)
Averages for the 2004 tax year for zip code 34108, filed in 2005:
Average Adjusted Gross Income (AGI) in 2004: $235,938 (Individual Income Tax Returns)
Here:
$235,938
State:
$50,523
Salary/wage: $132,661 (reported on 62.1% of returns)
Here:
$132,661
State:
$39,563
(% of AGI for various income ranges: 65.4% for AGIs $10k-25k, 67.1% for AGIs $25k-50k, 48.2% for AGIs $50k-75k, 35.8% for AGIs $75k-100k, 32.0% for AGIs over 100k)
Taxable interest for individuals: $19,029 (reported on 64.8% of returns)
This zip code:
$19,029
Florida:
$3,211
(% of AGI for various income ranges: 6.2% for AGIs $10k-25k, 3.9% for AGIs $25k-50k, 5.2% for AGIs $50k-75k, 5.9% for AGIs $75k-100k, 5.0% for AGIs over 100k)
Taxable dividends: $34,370 (reported on 53.4% of returns)
Here:
$34,370
State:
$6,129
(% of AGI for various income ranges: 6.1% for AGIs $10k-25k, 5.0% for AGIs $25k-50k, 6.7% for AGIs $50k-75k, 8.3% for AGIs $75k-100k, 7.7% for AGIs over 100k)
Net capital gain/loss: +$172,289 (reported on 49.2% of returns)
Here:
+$172,289
State:
+$27,205
(% of AGI for various income ranges: 0.4% for AGIs $10k-25k, 1.1% for AGIs $25k-50k, 3.3% for AGIs $50k-75k, 4.3% for AGIs $75k-100k, 38.5% for AGIs over 100k)
Profit/loss from business: +$36,344 (reported on 19.1% of returns)
Here:
+$36,344
State:
+$10,634
(% of AGI for various income ranges: 7.6% for AGIs $10k-25k, 4.5% for AGIs $25k-50k, 4.6% for AGIs $50k-75k, 3.4% for AGIs $75k-100k, 2.7% for AGIs over 100k)
IRA payment deduction: $3,943 (reported on 3.4% of returns)
34108:
$3,943
Florida:
$3,082
(% of AGI for various income ranges: 0.4% for AGIs $10k-25k, 0.3% for AGIs $25k-50k, 0.3% for AGIs $50k-75k, 0.2% for AGIs $75k-100k, 0.0% for AGIs over 100k)
Self-employed pension: $24,321 (reported on 2.3% of returns)
Here:
$24,321
Florida:
$15,857
(% of AGI for various income ranges: 0.1% for AGIs $25k-50k, 0.3% for AGIs $50k-75k, 0.4% for AGIs $75k-100k, 0.2% for AGIs over 100k)
Total itemized deductions: $49,098 (12% of AGI, reported on 52.2% of returns)
Here:
$49,098
State:
$20,370
Here:
12.3% of AGI
State:
20.7% of AGI
(% of AGI for various income ranges: 25.2% for AGIs $10k-25k, 20.4% for AGIs $25k-50k, 22.3% for AGIs $50k-75k, 22.3% for AGIs $75k-100k, 9.4% for AGIs over 100k)
Charity contributions deductions: $19,065 (4% of AGI, reported on 46.8% of returns)
Here:
$19,065
State:
$4,064
Here:
4.5% of AGI
State:
3.8% of AGI
(% of AGI for various income ranges: 1.8% for AGIs $10k-25k, 1.7% for AGIs $25k-50k, 2.5% for AGIs $50k-75k, 3.1% for AGIs $75k-100k, 3.9% for AGIs over 100k)
Total tax: $65,826 (reported on 81.5% of returns)
34108:
$65,826
State:
$9,431
(% of AGI for various income ranges: 4.6% for AGIs $10k-25k, 7.3% for AGIs $25k-50k, 9.6% for AGIs $50k-75k, 10.8% for AGIs $75k-100k, 24.0% for AGIs over 100k)
Earned income credit: $1,359 (reported on 7.0% of returns)
Here:
$1,359
State:
$1,808
Percentage of individuals using paid preparers for their 2004 taxes: 70.0%
Here:
70%
State:
60%
(% for various income ranges: 62.7% for AGIs below $10k, 61.3% for AGIs $10k-25k, 61.7% for AGIs $25k-50k, 66.7% for AGIs $50k-75k, 70.6% for AGIs $75k-100k, 86.0% for AGIs over 100k)
Likely homosexual households (counted as self-reported same-sex unmarried-partner households)
Lesbian couples: 0.0% of all households
Gay men: 0.0% of all households
Household received Food Stamps/SNAP in the past 12 months: 159 Household did not receive Food Stamps/SNAP in the past 12 months: 8,791
Women who had a birth in the past 12 months: 53 (27 now married, 24 unmarried) Women who did not have a birth in the past 12 months: 1,227 (512 now married, 715 unmarried)
Housing units in zip code 34108 with a mortgage: 2,458 (280 second mortgage, 20 home equity loan, 244 both second mortgage and home equity loan) Houses without a mortgage: 53
Median monthly owner costs for units with a mortgage: $3,180 Median monthly owner costs for units without a mortgage: $1,523
Residents with income below the poverty level in 2022:
This zip code:
5.8%
Whole state:
12.7%
Residents with income below 50% of the poverty level in 2022:
This zip code:
1.2%
Whole state:
6.6%
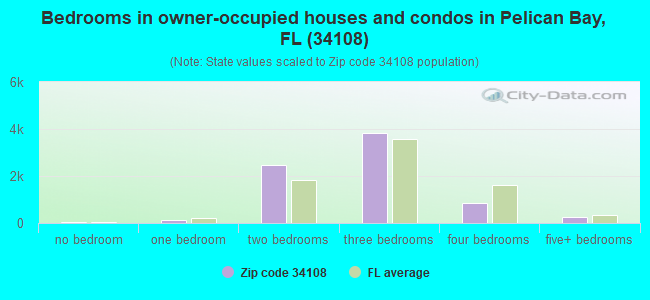
Median number of rooms in houses and condos:
Here:
5.7
State:
5.9
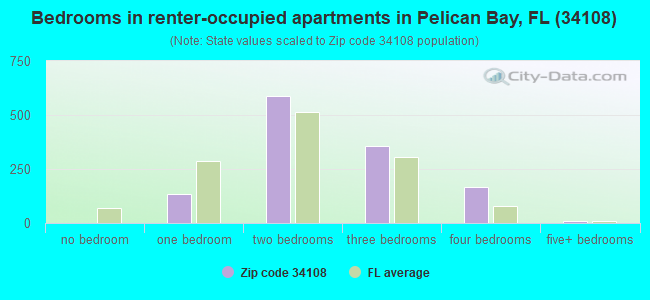
Median number of rooms in apartments:
Here:
4.5
State:
4.2
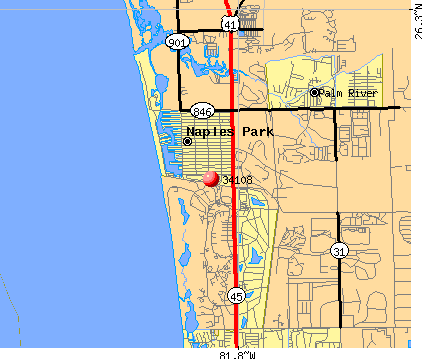
Notable locations in this zip code not listed on our city pages
Notable locations in zip code 34108: Miami Springs Golf and Country Club (A), Collier County Public Library Vanderbilt Beach Branch (B), North Naples Fire Control District Station 44 (C), Collier County Emergency Medical Services Station 44 (D), Collier County Sheriff's Office North Naples Substation District 1 (E). Display/hide their locations on the map
802 married couples with children.
196 single-parent households (99 men, 97 women).
86.5% of residents of 34108 zip code speak English at home.
6.1% of residents speak Spanish at home (62% very well, 26% well, 9% not well, 3% not at all).
6.8% of residents speak other Indo-European language at home (72% very well, 23% well, 6% not well).
1.3% of residents speak Asian or Pacific Island language at home (88% very well, 12% well).
0.2% of residents speak other language at home (53% very well, 11% well, 37% not well).
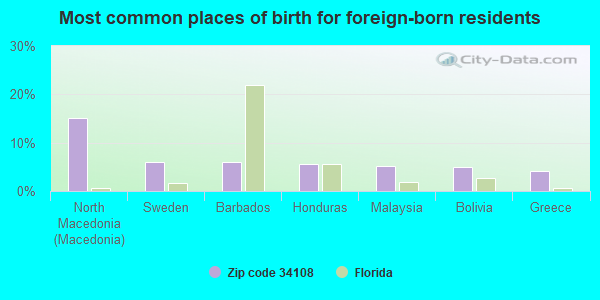
Foreign born population: 2,758 (16.4%) (58.8% of them are naturalized citizens)
This zip code:
16.4%
Whole state:
21.7%
15%North Macedonia (Macedonia)
6%Sweden
6%Barbados
6%Honduras
5%Malaysia
5%Bolivia
4%Greece
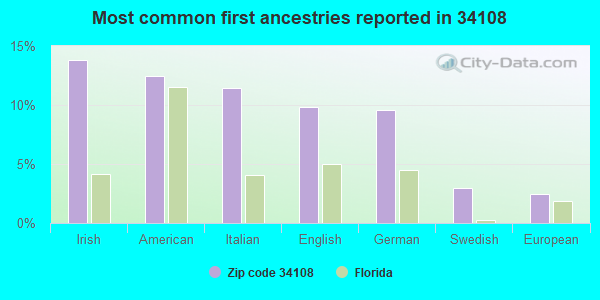
14%Irish
12%American
11%Italian
10%English
10%German
3%Swedish
2%European
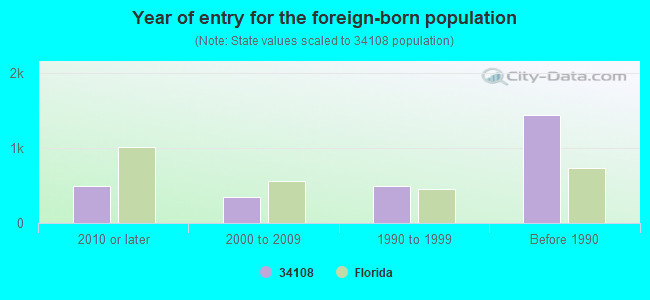
Year of entry for the foreign-born population
4932010 or later
3432000 to 2009
4911990 to 1999
1,439Before 1990
Major facilities with environmental interests located in this zip code:
PELICAN BAY SEWAGE TREAT PLANT (6200 WATERGATE WAY in NAPLES, FL)
STATE MASTER (FDM) - WAFR-FLA014133, DOMESTIC WASTEWATER PROGRAM, WAFR-FLR05C332, NPDES STORMWATER PROGRAM, NPDES STORMWATER PERMIT National Pollutant Discharge Elimination System NON-MAJOR (Tracking pollutant discharge elimination systems) - permit Business SIC classification: SEWERAGE SYSTEMS Organizations: COLLIEER COUNTY-OCPM, COLLIER COUNTY, COLLIER COUNTY PWD, GULF BAY DEVELOPMENT, WILSON, MILLER/ENGINEER., COLLIER COUNTY WATER SEWER DISTRICT (CONTACT/APPLICANT)
, COLLIER COUNTY BCC WASTEWATER DEPARTMENT (CONTACT/APPLICANT)
, COLLIER COUNTY SEWER DISTRICT (CONTACT/APPLICANT)
, COLLIER COUNTY (CONTACT/APPLICANT)
, JOE CHEATHAM (CONTACT/OWNER)
, COLLIER COUNTY WATER SEWER DISTRICT (CONTACT/PERMIT)
, COLLIER COUNTY BCC WASTEWATER DEPARTMENT (CONTACT/PERMIT)
, BOARD OF COUNTY COMMISSIONERS (CONTACT/PERMIT)
Alternative names: BOARD OF COUNTY COMMISSIONERS
7 - ELEVEN #25386 (5320 N. TAMIAMI TRAIL in NAPLES, FL)
STATE MASTER (FDM) - WAFR-FLG910327, INDUSTRIAL WASTEWATER PROGRAM, WAFR-FLG910745, WAFR-FLG911096, National Pollutant Discharge Elimination System NON-MAJOR (Tracking pollutant discharge elimination systems) - permit National Pollutant Discharge Elimination System NON-MAJOR (Tracking pollutant discharge elimination systems) - permit National Pollutant Discharge Elimination System NON-MAJOR (Tracking pollutant discharge elimination systems) - permit Business SIC classification: GASOLINE SERVICE STATIONS Organizations: PROFESSIONAL SERVICE INDUSTRIER, THE IT GROUP, 7-ELEVEN INC (CONTACT/APPLICANT)
, PROFESSIONAL SERVICE INDUSTRIER (CONTACT/APPLICANT)
Alternative names: 7-ELEVEN NO 25386, 7-11 STORE # 25386
NAPLES PARK ELEMENTARY SCHOOL (685 111TH AVE N in NAPLES, FL)
(Geographic Names Information System) (National Center for Education Statistics) - STATE ID-0241 Organizations: COLLIER COUNTY SCHOOL DISTRICT (SCHOOL DISTRICT)
MOBIL OIL CORP SS# HYL (10121 TAMIAMI TRAIL N in NAPLES, FL)
National Pollutant Discharge Elimination System NON-MAJOR (Tracking pollutant discharge elimination systems) - permit (Resource Conservation and Recovery Act (tracking hazardous waste)) Business NAICS classification: GENERAL AUTOMOTIVE REPAIR. Organizations: DAN HORTON (CONTACT/OWNER)
Alternative names: MOBILE NORTH
CREEKSIDE WEST UNITS 2 & 3 (GOODLETTE FRANK RD &IMMOKALEER in NAPLES, FL)
National Pollutant Discharge Elimination System NON-MAJOR (Tracking pollutant discharge elimination systems) - permit National Pollutant Discharge Elimination System NON-MAJOR (Tracking pollutant discharge elimination systems) - permit Alternative names: CREEKSIDE WEST INC
7-ELEVEN STORE #24259 (10795 NORTH TAMIAMI TRAIL in NAPLES, FL)
National Pollutant Discharge Elimination System NON-MAJOR (Tracking pollutant discharge elimination systems) - permit Organizations: WILLO SMITH (CONTACT/OWNER)
HELLERMANN TYTON CORP. (1250 CREEKSIDE PKWAY in NAPLES, FL)
ENFORCEMENT/COMPLIANCE ACTIVITY (Integrated Compliance Information System) (Resource Conservation and Recovery Act (tracking hazardous waste)) Business NAICS classification: ALL OTHER PLASTICS PRODUCT MANUFACTURING.
M&M DRY CLEANERS (1054 PINE RIDGE RD in NAPLES, FL)
AIR MINOR (AIRS/AFS) (Resource Conservation and Recovery Act (tracking hazardous waste)) Business SIC classification: DRYCLEANING PLANTS, EXCEPT RUG CLEANING Organizations: MARIO MENA (CONTACT/OWNER)
JAMES MIDDENDORF PROPERTY (191 SEABREEZE AVE in NAPLES, FL)
(Resource Conservation and Recovery Act (tracking hazardous waste)) Organizations: JAMES H MIDDENDORF (CONTACT/OWNER)
MATCHS AUTO BODY (1370 PINE RIDGE RD in NAPLES, FL)
(Resource Conservation and Recovery Act (tracking hazardous waste)) Organizations: SHEPARD & SON (CONTACT/OWNER)
ONE HOUR DRY CLEANERS (9853 TAMIAMI TR N in NAPLES, FL)
(Resource Conservation and Recovery Act (tracking hazardous waste)) Organizations: PAUL BREEHNE (CONTACT/OWNER)
CIRCLE K #8813 (155 VANDERBILT BEACH in NAPLES, FL)
(Resource Conservation and Recovery Act (tracking hazardous waste)) Organizations: STEVE BELIN, MGR (CONTACT/OWNER)
Housing units lacking complete plumbing facilities: 0.3% Housing units lacking complete kitchen facilities: 0.7%
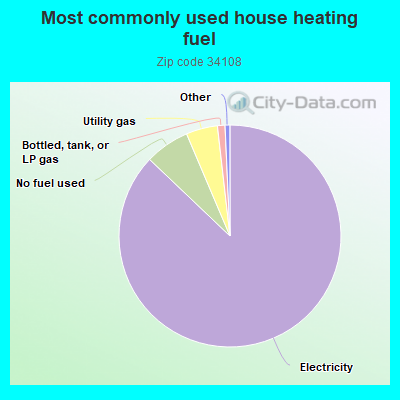
87.2%Electricity
6.5%No fuel used
4.6%Utility gas
1.1%Bottled, tank, or LP gas
Place of birth for U.S.-born residents:
This state: 1,645
Northeast: 5,138
Midwest: 5,218
South: 1,514
West: 485
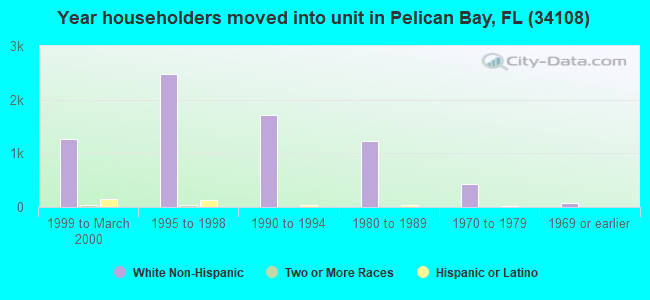
50% of the 34108 zip code residents lived in the same house 5 years ago. Out of people who lived in different houses, 40% lived in this county. Out of people who lived in different counties, 50% lived in Florida.
88% of the 34108 zip code residents lived in the same house 1 year ago. Out of people who lived in different houses, 35% moved from this county. Out of people who lived in different houses, 15% moved from different county within same state. Out of people who lived in different houses, 47% moved from different state. Out of people who lived in different houses, 7% moved from abroad.
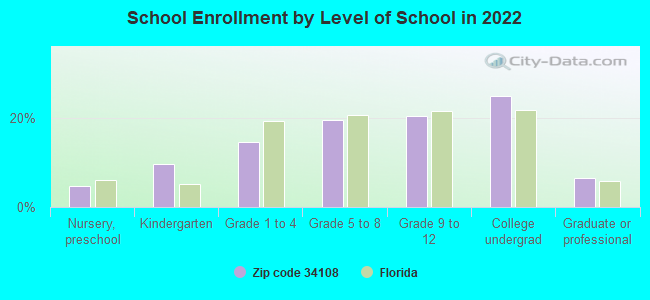
Private vs. public school enrollment:
Students in private schools in grades 1 to 8 (elementary and middle school): 80
Here:
16.6%
Florida:
15.8%
Students in private schools in grades 9 to 12 (high school): 49
Here:
17.0%
Florida:
12.9%
Students in private undergraduate colleges: 60
Here:
17.2%
Florida:
23.6%
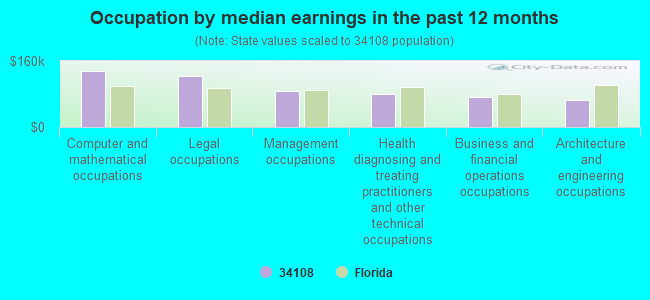
Occupation by median earnings in the past 12 months ($)
135,580Computer and mathematical occupations
124,494Legal occupations
87,077Management occupations
79,669Health diagnosing and treating practitioners and other technical occupations
72,832Business and financial operations occupations
66,236Architecture and engineering occupations
Companies with federal contracts located in this zip code:
LEE LUSTIG (6350 PELICAN BAY BLVD in NAPLES, FL; small business)
$6,038 with Department of State for Training/Curriculum Development. Taking place in SC. Signed on 2005-01-07. Completion date: 2005-01-28.
Top industries in this zip code by the number of employees in 2005:
Other Services (except Public Administration): Other Similar Organizations (except Business, Professional, Labor, and Political Organizations) (100-249: 1, 5-9: 5, 1-4: 26)
2002 - 2018 National Fire Incident Reporting System (NFIRS) incidents
Based on the data from the years 2002 - 2018 the average number of fire incidents per year is 35. The highest number of reported fire incidents - 52 took place in 2008, and the least - 25 in 2011. The data has a constant trend.
When looking into fire subcategories, the most reports belonged to: Outside Fires (46.5%), and Structure Fires (28.8%).
Fire incident types reported to NFIRS in Zip Code 34108


 Nearest zip codes: 34109, 34103, 34110, 34105, 34119, 34134.
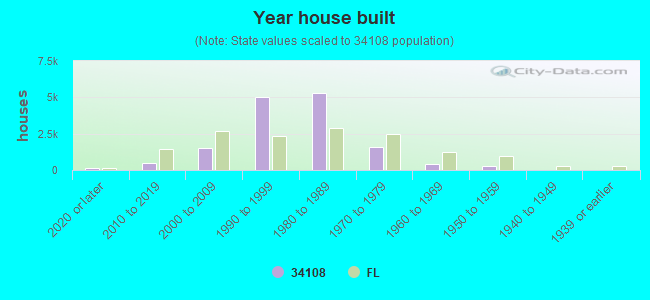


 Based on the data from the years 2002 - 2018 the average number of fire incidents per year is 35. The highest number of reported fire incidents - 52 took place in 2008, and the least - 25 in 2011. The data has a constant trend.
 When looking into fire subcategories, the most reports belonged to: Outside Fires (46.5%), and Structure Fires (28.8%).