Estimated zip code population in 2022: 15,693 Zip code population in 2010: 15,394 Zip code population in 2000: 14,984
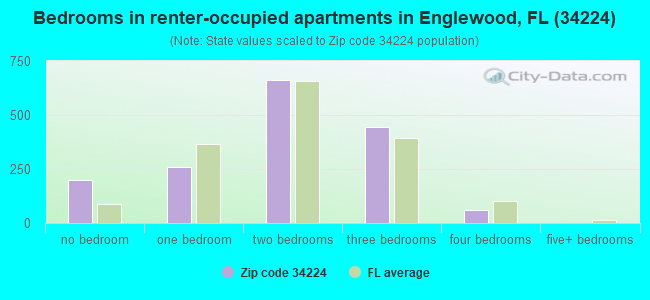
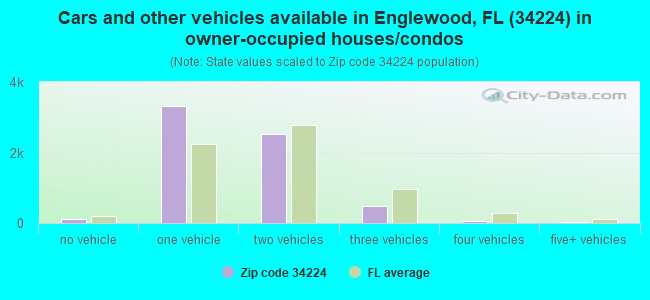
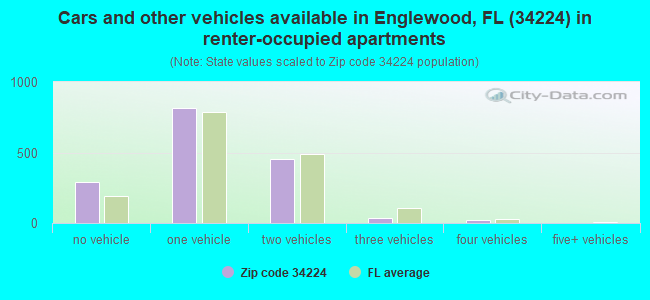
Houses and condos: 11,665 Renter-occupied apartments: 1,611
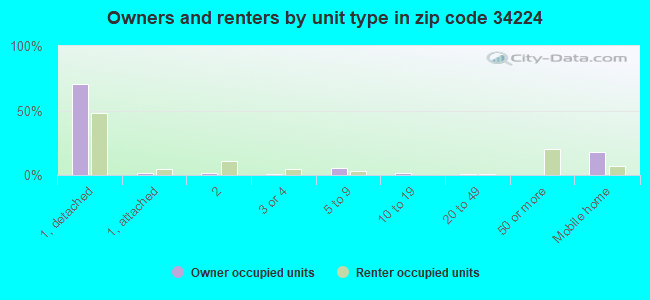
% of renters here:
20%
State:
33%
March 2022 cost of living index in zip code 34224: 91.0 (less than average, U.S. average is 100)
Land area: 13.0 sq. mi. Water area: 2.0 sq. mi.
Population density: 1,211 people per square mile
(low).
OSM Map
General Map
Google Map
MSN Map
OSM Map
General Map
Google Map
MSN Map
OSM Map
General Map
Google Map
MSN Map
OSM Map
General Map
Google Map
MSN Map
Please wait while loading the map...
Real estate property taxes paid for housing units in 2022:
This zip code:
0.6% ($1,796)
Florida:
0.7% ($2,529)
Median real estate property taxes paid for housing units with mortgages in 2022: $1,915 (0.7%) Median real estate property taxes paid for housing units with no mortgage in 2022: $1,675 (0.6%)
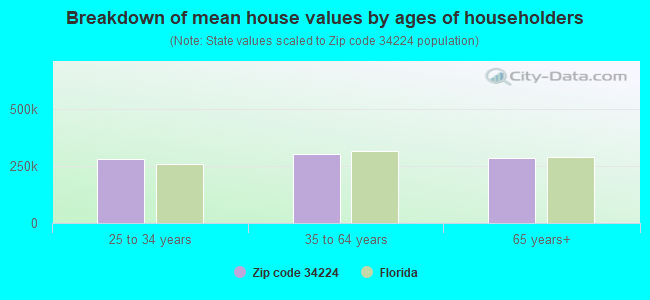
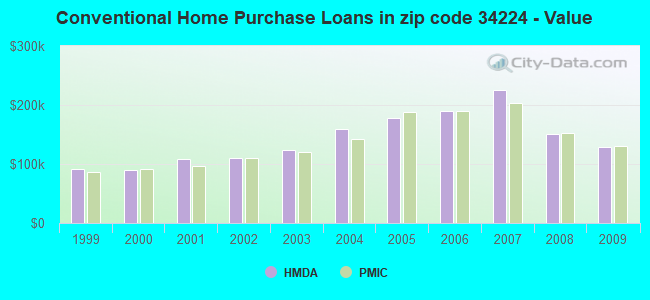
Estimated median house/condo value in 2022: $277,754
34224:
$277,754
Florida:
$354,100
According to our research of Florida and other state lists, there were 14 registered sex offenders living in 34224 zip code as of April 27, 2024. The ratio of all residents to sex offenders in zip code 34224 is 1,144 to 1. The ratio of registered sex offenders to all residents in this zip code is lower than the state average.
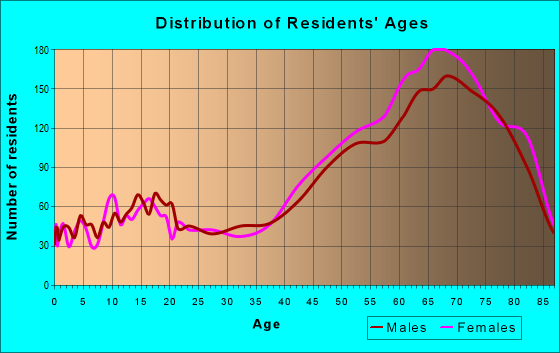
Median resident age:
This zip code:
64.5 years
Florida median age:
42.7 years
Average household size:
This zip code:
1.9 people
Florida:
2.5 people
Averages for the 2020 tax year for zip code 34224, filed in 2021:
Average Adjusted Gross Income (AGI) in 2020: $55,522 (Individual Income Tax Returns)
Here:
$55,522
State:
$82,200
Salary/wage: $41,485 (reported on 61.6% of returns)
Here:
$41,485
State:
$58,347
(% of AGI for various income ranges: 968.9% for AGIs below $25k, 2939.9% for AGIs $25k-50k, 5023.5% for AGIs $50k-75k, 6532.1% for AGIs $75k-100k, 11622.9% for AGIs $100k-200k, 52320.0% for AGIs over 200k)
Taxable interest for individuals: $1,758 (reported on 36.7% of returns)
This zip code:
$1,758
Florida:
$4,272
(% of AGI for various income ranges: 43.4% for AGIs below $25k, 51.5% for AGIs $25k-50k, 106.6% for AGIs $50k-75k, 151.4% for AGIs $75k-100k, 224.0% for AGIs $100k-200k, 2298.0% for AGIs over 200k)
Ordinary dividends: $6,226 (reported on 27.0% of returns)
Here:
$6,226
State:
$15,863
(% of AGI for various income ranges: 63.5% for AGIs below $25k, 106.2% for AGIs $25k-50k, 193.9% for AGIs $50k-75k, 342.8% for AGIs $75k-100k, 896.7% for AGIs $100k-200k, 7700.0% for AGIs over 200k)
Net capital gain/loss in AGI: +$15,073 (reported on 23.7% of returns)
Here:
+$15,073
State:
+$62,983
(% of AGI for various income ranges: 8.5% for AGIs below $25k, 66.6% for AGIs $25k-50k, 206.1% for AGIs $50k-75k, 640.2% for AGIs $75k-100k, 1563.3% for AGIs $100k-200k, 32914.0% for AGIs over 200k)
Profit/loss from business: +$11,796 (reported on 13.8% of returns)
Here:
+$11,796
State:
+$9,719
(% of AGI for various income ranges: 171.0% for AGIs below $25k, 157.9% for AGIs $25k-50k, 257.7% for AGIs $50k-75k, 315.6% for AGIs $75k-100k, 392.9% for AGIs $100k-200k, 4922.0% for AGIs over 200k)
Taxable individual retirement arrangement distribution: $18,879 (reported on 20.4% of returns)
34224:
$18,879
Florida:
$24,823
(% of AGI for various income ranges: 135.5% for AGIs below $25k, 292.7% for AGIs $25k-50k, 528.6% for AGIs $50k-75k, 1174.4% for AGIs $75k-100k, 2336.7% for AGIs $100k-200k, 9224.0% for AGIs over 200k)
Total itemized deductions: $30,781 (reported on 4.6% of returns)
Here:
$30,781
State:
$45,393
(% of AGI for various income ranges: 66.0% for AGIs below $25k, 87.7% for AGIs $25k-50k, 207.8% for AGIs $50k-75k, 365.6% for AGIs $75k-100k, 650.2% for AGIs $100k-200k, 5484.0% for AGIs over 200k)
Charity contributions: $8,297 (reported on 3.6% of returns)
Here:
$8,297
State:
$20,178
(% of AGI for various income ranges: 2.8% for AGIs below $25k, 8.4% for AGIs $25k-50k, 23.0% for AGIs $50k-75k, 36.7% for AGIs $75k-100k, 129.3% for AGIs $100k-200k, 2628.0% for AGIs over 200k)
Taxes paid: $6,111 (reported on 4.6% of returns)
34224:
$6,111
State:
$6,967
(% of AGI for various income ranges: 9.0% for AGIs below $25k, 14.8% for AGIs $25k-50k, 38.9% for AGIs $50k-75k, 91.4% for AGIs $75k-100k, 148.4% for AGIs $100k-200k, 1028.0% for AGIs over 200k)
Earned income credit: $1,758 (reported on 12.8% of returns)
Here:
$1,758
State:
$2,306
(% of AGI for various income ranges: 64.6% for AGIs below $25k, 37.7% for AGIs $25k-50k)
Percentage of individuals using paid preparers for their 2020 taxes: 92.3%
Here:
92%
State:
92%
(% for various income ranges: 91.7% for AGIs below $25k, 92.5% for AGIs $25k-50k, 91.5% for AGIs $50k-75k, 92.1% for AGIs $75k-100k, 94.6% for AGIs $100k-200k, 95.0% for AGIs over 200k)
Averages for the 2012 tax year for zip code 34224, filed in 2013:
Average Adjusted Gross Income (AGI) in 2012: $43,043 (Individual Income Tax Returns)
Here:
$43,043
State:
$60,316
Salary/wage: $31,160 (reported on 64.9% of returns)
Here:
$31,160
State:
$45,277
(% of AGI for various income ranges: 56.0% for AGIs below $25k, 57.3% for AGIs $25k-50k, 48.9% for AGIs $50k-75k, 40.3% for AGIs $75k-100k, 43.0% for AGIs $100k-200k, 28.7% for AGIs over 200k)
Taxable interest for individuals: $2,096 (reported on 40.0% of returns)
This zip code:
$2,096
Florida:
$3,587
(% of AGI for various income ranges: 2.4% for AGIs below $25k, 1.4% for AGIs $25k-50k, 1.7% for AGIs $50k-75k, 2.0% for AGIs $75k-100k, 2.1% for AGIs $100k-200k, 2.6% for AGIs over 200k)
Ordinary dividends: $5,764 (reported on 28.7% of returns)
Here:
$5,764
State:
$12,831
(% of AGI for various income ranges: 4.0% for AGIs below $25k, 2.3% for AGIs $25k-50k, 3.5% for AGIs $50k-75k, 3.0% for AGIs $75k-100k, 4.7% for AGIs $100k-200k, 7.0% for AGIs over 200k)
Net capital gain/loss in AGI: +$5,065 (reported on 23.3% of returns)
Here:
+$5,065
State:
+$33,493
(% of AGI for various income ranges: 1.0% for AGIs $25k-50k, 0.7% for AGIs $50k-75k, 2.4% for AGIs $75k-100k, 3.8% for AGIs $100k-200k, 12.6% for AGIs over 200k)
Profit/loss from business: +$8,766 (reported on 13.4% of returns)
Here:
+$8,766
State:
+$10,012
(% of AGI for various income ranges: 7.8% for AGIs below $25k, 2.5% for AGIs $25k-50k, 1.6% for AGIs $50k-75k, 1.9% for AGIs $75k-100k, 2.8% for AGIs $100k-200k)
Taxable individual retirement arrangement distribution: $14,870 (reported on 22.1% of returns)
34224:
$14,870
Florida:
$21,544
(% of AGI for various income ranges: 6.8% for AGIs below $25k, 5.4% for AGIs $25k-50k, 6.9% for AGIs $50k-75k, 10.6% for AGIs $75k-100k, 10.4% for AGIs $100k-200k, 5.3% for AGIs over 200k)
Total itemized deductions: $19,350 (26% of AGI, reported on 22.4% of returns)
Here:
$19,350
State:
$25,533
Here:
25.6% of AGI
State:
18.0% of AGI
(% of AGI for various income ranges: 11.6% for AGIs below $25k, 9.6% for AGIs $25k-50k, 9.3% for AGIs $50k-75k, 9.8% for AGIs $75k-100k, 11.6% for AGIs $100k-200k, 8.2% for AGIs over 200k)
Charity contributions: $2,904 (reported on 17.6% of returns)
Here:
$2,904
State:
$5,698
(% of AGI for various income ranges: 0.8% for AGIs below $25k, 0.8% for AGIs $25k-50k, 0.9% for AGIs $50k-75k, 1.5% for AGIs $75k-100k, 1.7% for AGIs $100k-200k, 1.7% for AGIs over 200k)
Taxes paid: $5,267 (reported on 22.2% of returns)
34224:
$5,267
State:
$6,203
(% of AGI for various income ranges: 2.3% for AGIs below $25k, 2.0% for AGIs $25k-50k, 2.1% for AGIs $50k-75k, 2.5% for AGIs $75k-100k, 3.8% for AGIs $100k-200k, 4.1% for AGIs over 200k)
Earned income credit: $1,903 (reported on 16.0% of returns)
Here:
$1,903
State:
$2,372
(% of AGI for various income ranges: 4.2% for AGIs below $25k, 0.7% for AGIs $25k-50k)
Percentage of individuals using paid preparers for their 2012 taxes: 56.1%
Here:
56%
State:
54%
(% for various income ranges: 51.5% for AGIs below $25k, 56.0% for AGIs $25k-50k, 60.7% for AGIs $50k-75k, 60.8% for AGIs $75k-100k, 68.2% for AGIs $100k-200k, 87.5% for AGIs over 200k)
Averages for the 2004 tax year for zip code 34224, filed in 2005:
Average Adjusted Gross Income (AGI) in 2004: $39,122 (Individual Income Tax Returns)
Here:
$39,122
State:
$50,523
Salary/wage: $28,960 (reported on 66.4% of returns)
Here:
$28,960
State:
$39,563
(% of AGI for various income ranges: 93.3% for AGIs below $10k, 53.1% for AGIs $10k-25k, 57.4% for AGIs $25k-50k, 55.0% for AGIs $50k-75k, 48.0% for AGIs $75k-100k, 33.2% for AGIs over 100k)
Taxable interest for individuals: $2,645 (reported on 52.9% of returns)
This zip code:
$2,645
Florida:
$3,211
(% of AGI for various income ranges: 12.3% for AGIs below $10k, 5.8% for AGIs $10k-25k, 3.4% for AGIs $25k-50k, 2.9% for AGIs $50k-75k, 3.1% for AGIs $75k-100k, 2.9% for AGIs over 100k)
Taxable dividends: $4,068 (reported on 34.4% of returns)
Here:
$4,068
State:
$6,129
(% of AGI for various income ranges: 10.3% for AGIs below $10k, 3.6% for AGIs $10k-25k, 2.6% for AGIs $25k-50k, 2.4% for AGIs $50k-75k, 3.4% for AGIs $75k-100k, 5.0% for AGIs over 100k)
Net capital gain/loss: +$11,932 (reported on 29.1% of returns)
Here:
+$11,932
State:
+$27,205
(% of AGI for various income ranges: -1.8% for AGIs below $10k, 0.5% for AGIs $10k-25k, 1.6% for AGIs $25k-50k, 2.7% for AGIs $50k-75k, 6.1% for AGIs $75k-100k, 26.2% for AGIs over 100k)
Profit/loss from business: +$10,324 (reported on 13.9% of returns)
Here:
+$10,324
State:
+$10,634
(% of AGI for various income ranges: 7.3% for AGIs below $10k, 5.0% for AGIs $10k-25k, 3.6% for AGIs $25k-50k, 2.9% for AGIs $50k-75k, 1.9% for AGIs $75k-100k, 4.3% for AGIs over 100k)
IRA payment deduction: $3,229 (reported on 3.3% of returns)
34224:
$3,229
Florida:
$3,082
(% of AGI for various income ranges: 0.6% for AGIs below $10k, 0.3% for AGIs $10k-25k, 0.4% for AGIs $25k-50k, 0.3% for AGIs $50k-75k, 0.3% for AGIs $75k-100k, 0.2% for AGIs over 100k)
Self-employed pension: $9,562 (reported on 0.2% of returns)
Here:
$9,562
Florida:
$15,857
Total itemized deductions: $16,022 (24% of AGI, reported on 26.3% of returns)
Here:
$16,022
State:
$20,370
Here:
24.2% of AGI
State:
20.7% of AGI
(% of AGI for various income ranges: 21.2% for AGIs below $10k, 11.7% for AGIs $10k-25k, 11.5% for AGIs $25k-50k, 11.0% for AGIs $50k-75k, 11.8% for AGIs $75k-100k, 8.4% for AGIs over 100k)
Charity contributions deductions: $2,260 (3% of AGI, reported on 21.3% of returns)
Here:
$2,260
State:
$4,064
Here:
3.2% of AGI
State:
3.8% of AGI
(% of AGI for various income ranges: 0.9% for AGIs below $10k, 1.0% for AGIs $10k-25k, 1.2% for AGIs $25k-50k, 1.2% for AGIs $50k-75k, 1.6% for AGIs $75k-100k, 1.3% for AGIs over 100k)
Total tax: $5,392 (reported on 75.2% of returns)
34224:
$5,392
State:
$9,431
(% of AGI for various income ranges: 3.9% for AGIs below $10k, 3.7% for AGIs $10k-25k, 6.8% for AGIs $25k-50k, 9.3% for AGIs $50k-75k, 10.9% for AGIs $75k-100k, 17.7% for AGIs over 100k)
Earned income credit: $1,559 (reported on 11.6% of returns)
Here:
$1,559
State:
$1,808
Percentage of individuals using paid preparers for their 2004 taxes: 61.5%
Here:
62%
State:
60%
(% for various income ranges: 54.3% for AGIs below $10k, 60.5% for AGIs $10k-25k, 61.9% for AGIs $25k-50k, 63.4% for AGIs $50k-75k, 66.8% for AGIs $75k-100k, 80.2% for AGIs over 100k)
Household received Food Stamps/SNAP in the past 12 months: 497 Household did not receive Food Stamps/SNAP in the past 12 months: 7,658
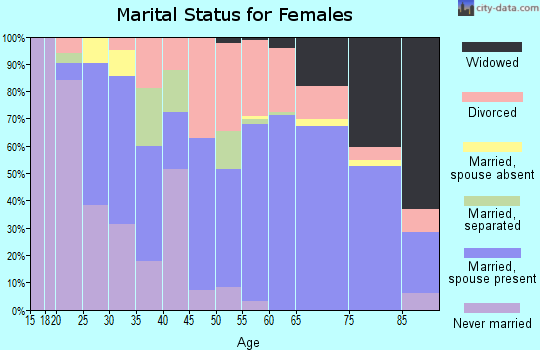
Women who had a birth in the past 12 months: 239 (71 now married, 156 unmarried) Women who did not have a birth in the past 12 months: 1,870 (645 now married, 1,224 unmarried)
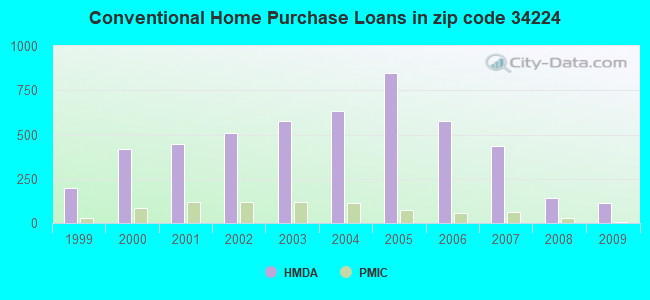
Housing units in zip code 34224 with a mortgage: 2,341 (261 second mortgage, 248 both second mortgage and home equity loan) Houses without a mortgage: 116
Median monthly owner costs for units with a mortgage: $1,358 Median monthly owner costs for units without a mortgage: $478
Residents with income below the poverty level in 2022:
This zip code:
12.7%
Whole state:
12.7%
Residents with income below 50% of the poverty level in 2022:
This zip code:
6.5%
Whole state:
6.6%
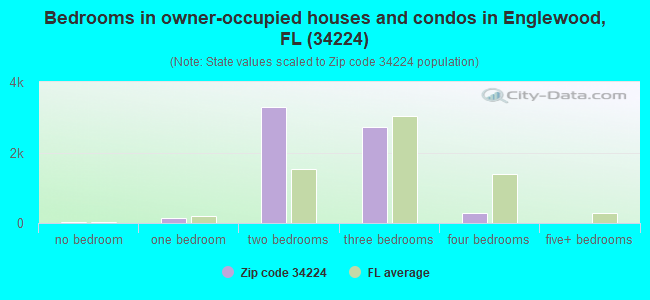
Median number of rooms in houses and condos:
Here:
5.1
State:
5.9
Median number of rooms in apartments:
Here:
4.1
State:
4.2
Notable locations in this zip code not listed on our city pages
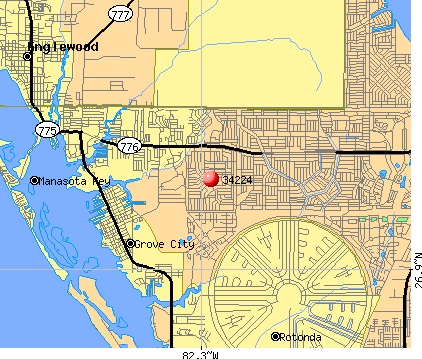
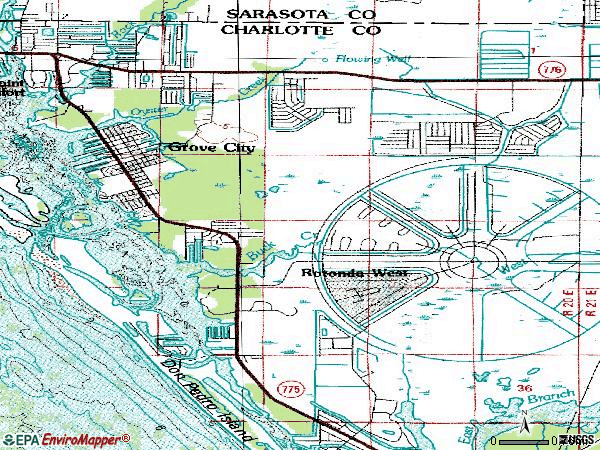
Notable locations in zip code 34224: Debary Golf and Country Club (A), Daytona Beach Golf and Country Club (B), Englewood Area Fire Control District Station 72 (C), Charlotte County Fire and Emergency Medical Services Station 13 (D), Englewood Area Fire Control District Station 75 (E), Charlotte County Sheriff's Office - District 1 (F), Charlotte County Emergency Management Office (G), Englewood Charlotte Public Library (H). Display/hide their locations on the map
Churches in zip code 34224 include: Rotonda West Community Church (A), Faith Lutheran Church (B), West Charlotte Baptist Church (C), Sunnybrook Alliance Church (D), Redeemer Lutheran Church of Englewood (E), Church of Christ of Englewood East (F), Placida Church (G). Display/hide their locations on the map
Lakes: Palm Lake (A), Lemon Lake (B), Lake Van (C), Lake Sunapee (D), Lake Sturgeon (E), Lake Breeze Wood (F), Bass Lake (G), Troy Lake (H). Display/hide their locations on the map
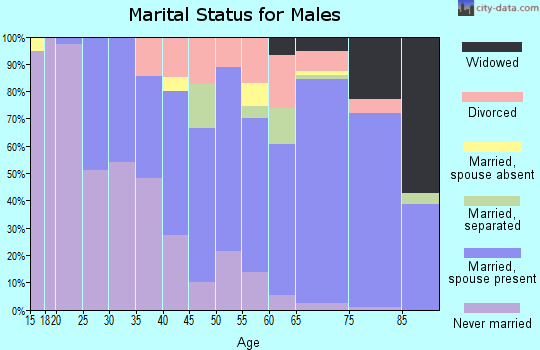
500 married couples with children.
158 single-parent households (26 men, 132 women).
94.6% of residents of 34224 zip code speak English at home.
2.3% of residents speak Spanish at home (80% very well, 8% well, 12% not well).
2.4% of residents speak other Indo-European language at home (78% very well, 18% well, 4% not well).
0.9% of residents speak Asian or Pacific Island language at home (83% very well, 17% well).
0.5% of residents speak other language at home (52% very well, 48% well).
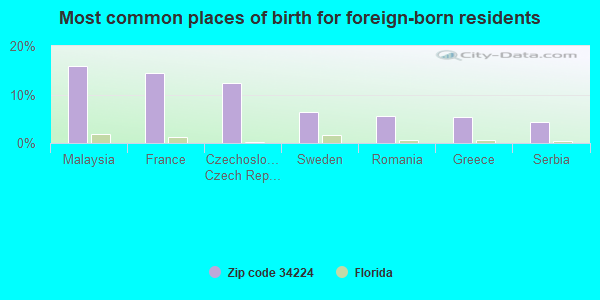
Foreign born population: 1,093 (7.0%) (70.4% of them are naturalized citizens)
This zip code:
7.0%
Whole state:
21.7%
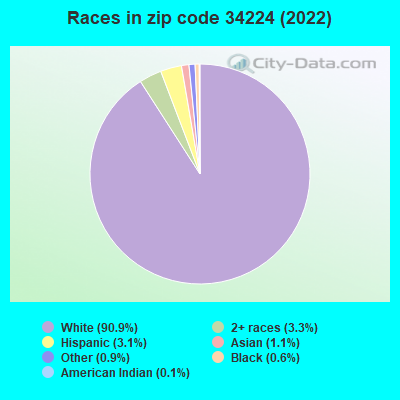
16%Malaysia
14%France
12%Czechoslovakia (includes Czech Republic and Slovakia)
6%Sweden
5%Romania
5%Greece
4%Serbia
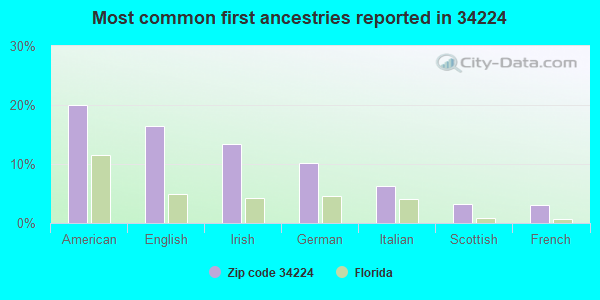
20%American
16%English
13%Irish
10%German
6%Italian
3%Scottish
3%French
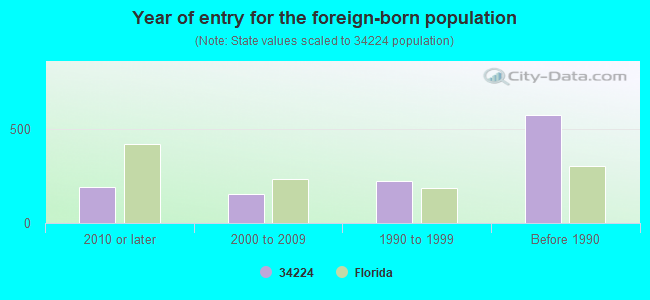
Year of entry for the foreign-born population
1912010 or later
1562000 to 2009
2221990 to 1999
575Before 1990
Major facilities with environmental interests located in this zip code:
LEMON BAY HIGH SCHOOL (2201 PLACIDA ROAD in ENGLEWOOD, FL)
(Geographic Names Information System) (National Center for Education Statistics) - STATE ID-0051 Organizations: CHARLOTTE COUNTY SCHOOL DISTRICT (SCHOOL DISTRICT)
AMSOUTH BANK, ENGLEWOOD (ENGLEWOOD RD. & PLACIDA RD. OU in ENGLEWOOD, FL)
National Pollutant Discharge Elimination System NON-MAJOR (Tracking pollutant discharge elimination systems) - permit Organizations: GREG HARRIS (CONTACT/OWNER)
MARINER LANDING (150 & 1520 NEW POINT COMFORT R in ENGLEWOOD, FL)
National Pollutant Discharge Elimination System NON-MAJOR (Tracking pollutant discharge elimination systems) - permit Organizations: PAUL SHERMA (CONTACT/OWNER)
Alternative names: HEAD & ENGQUIST EQ-SULPHUR
CUMBERLAND FARMS #1050 (2390 S MCCALL RD in ENGLEWOOD, FL)
National Pollutant Discharge Elimination System NON-MAJOR (Tracking pollutant discharge elimination systems) - permit Small Quantity Generators, between 100 kg and 1000 kg of hazardous waste/month (Resource Conservation and Recovery Act (tracking hazardous waste)) - notification Business SIC classification: GASOLINE SERVICE STATIONS Organizations: JOYCE SCHULTZ, DEALER (CONTACT/OWNER)
A-1 COLLISION & GLASS OF ENGLEWOOD (4990 PLACIDA RD in ENGLEWOOD, FL)
(Resource Conservation and Recovery Act (tracking hazardous waste)) Business NAICS classification: AUTOMOTIVE BODY, PAINT, AND INTERIOR REPAIR AND MAINTENANCE. Organizations: HOWARD STEINFATH (CONTACT/OWNER)
AMOCO OCEAN SPRAY (4363 S ACCESS RD in ENGLEWOOD, FL)
National Pollutant Discharge Elimination System NON-MAJOR (Tracking pollutant discharge elimination systems) - permit Organizations: WILLIAM HEIM (CONTACT/OWNER)
GULF COAST BUILDING MATERIALS (3045 HWY 776 in ENGLEWOOD, FL)
(Resource Conservation and Recovery Act (tracking hazardous waste)) Organizations: L & W SUPPLY (CONTACT/OWNER)
GULF COAST PRECISION ENTERPRISES (2780 IVY LN UNIT 6 in ENGLEWOOD, FL)
(Resource Conservation and Recovery Act (tracking hazardous waste)) Organizations: MARIO MASSA (CONTACT/OWNER)
(Resource Conservation and Recovery Act (tracking hazardous waste)) Business NAICS classification: ALL OTHER AUTOMOTIVE REPAIR AND MAINTENANCE. Organizations: GREG ROBERTS (CONTACT/OWNER)
GULLOTTA`S AUTO BODY OF ENGLEWOOD, INC (6506 SAN CASA DR in ENGLEWOOD, FL)
(Resource Conservation and Recovery Act (tracking hazardous waste)) Business NAICS classification: AUTOMOTIVE BODY, PAINT, AND INTERIOR REPAIR AND MAINTENANCE. Organizations: CHRISTINA MULLER (CONTACT/OWNER)
OYSTER CREEK REGIONAL PARK (6791 SAN CASA DR in ENGLEWOOD, FL)
National Pollutant Discharge Elimination System NON-MAJOR (Tracking pollutant discharge elimination systems) - permit Organizations: DAVID OLLERICH (CONTACT/OWNER)
PARK OF COMMERCE AT TRIPLE DIA (180, 184, 188 TRIPLE DIAMOND B in VENICE, FL)
National Pollutant Discharge Elimination System NON-MAJOR (Tracking pollutant discharge elimination systems) - permit Organizations: WILLIAM DOOLEY (CONTACT/OWNER)
Alternative names: MANDARIN GROVE
Housing units lacking complete plumbing facilities: 0.6% Housing units lacking complete kitchen facilities: 1.8%
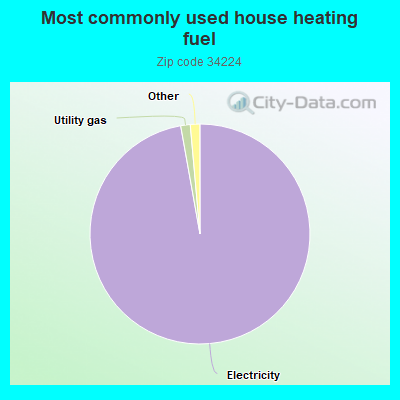
97.2%Electricity
1.4%Utility gas
Population in 1990: 5,110. Population change in the 1990s: +9,874 (+193.2%).
Place of birth for U.S.-born residents:
This state: 2,589
Northeast: 5,157
Midwest: 4,540
South: 1,850
West: 344
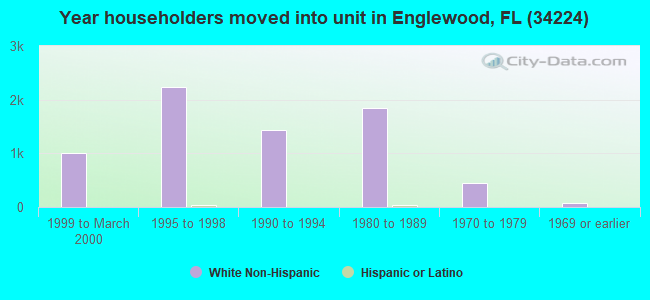
56% of the 34224 zip code residents lived in the same house 5 years ago. Out of people who lived in different houses, 32% lived in this county. Out of people who lived in different counties, 50% lived in Florida.
89% of the 34224 zip code residents lived in the same house 1 year ago. Out of people who lived in different houses, 21% moved from this county. Out of people who lived in different houses, 27% moved from different county within same state. Out of people who lived in different houses, 58% moved from different state.
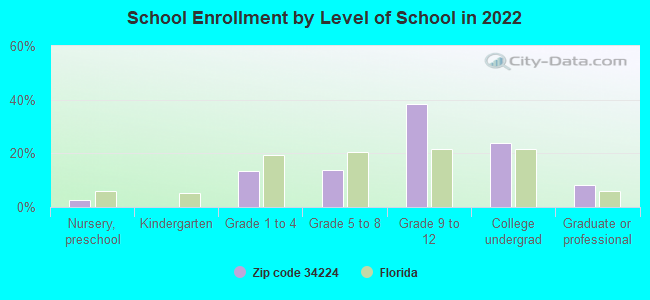
Private vs. public school enrollment:
Students in private schools in grades 1 to 8 (elementary and middle school): 72
Here:
17.1%
Florida:
15.8%
Students in private schools in grades 9 to 12 (high school): 75
Here:
12.6%
Florida:
12.9%
Students in private undergraduate colleges: 70
Here:
18.9%
Florida:
23.6%
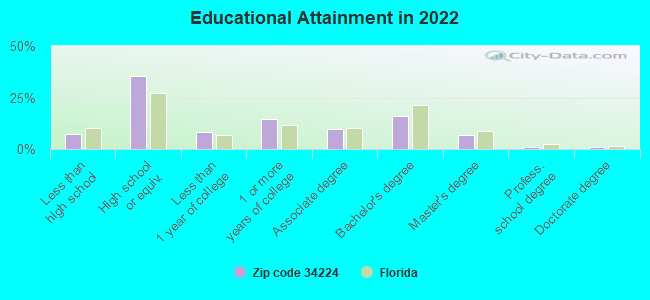
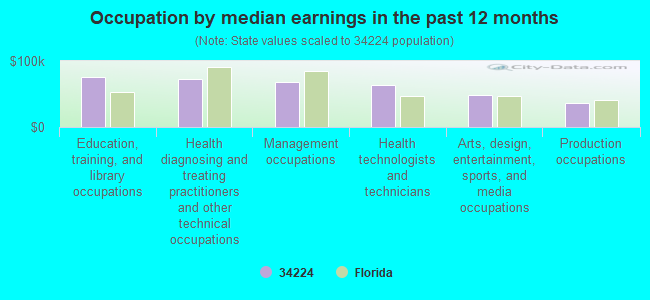
Occupation by median earnings in the past 12 months ($)
75,319Education, training, and library occupations
73,429Health diagnosing and treating practitioners and other technical occupations
68,031Management occupations
63,164Health technologists and technicians
48,454Arts, design, entertainment, sports, and media occupations
35,774Production occupations
Companies with federal contracts located in this zip code (ENGLEWOOD, FL):
QUALITY SOCKET SCREW CORPORATI (2790 WORTH AVE; small business) : $683,180 in 142 contractsfrom 2004 to 2006
Contracts for Screws, Nuts and Washers, Bolts, Studs, and moreby Defense Logistics Agency, Navy Signed by year:2000: $0; 2001: $0; 2002: $0; 2003: $0; 2004: $120,154; 2005: $354,436; 2006: $208,590.
Biggest contracts:
$20,250 with Defense Logistics Agency for Screws. Signed on 2004-12-09. Completion date: 2005-04-08.
$16,500 with Defense Logistics Agency for Nuts and Washers. Signed on 2005-11-10. Completion date: 2006-02-08.
$16,000, same as above.Signed on 2005-02-04. Completion date: 2005-08-09.
$13,650 with Defense Logistics Agency for Screws. Signed on 2005-01-14. Completion date: 2005-07-24.
SHECKLER PRODUCE INC (3037 S MCCALL RD; small business) : $99,492 in 11 contractsfrom 2004 to 2006
Contracts for Fruits and Vegetables by Defense Logistics Agency Signed by year:2000: $0; 2001: $0; 2002: $0; 2003: $0; 2004: $34,964; 2005: $55,135; 2006: $9,393.
Biggest contracts:
$15,277 with Defense Logistics Agency for Fruits and Vegetables. Signed on 2004-10-16. Completion date: 2004-10-16.
$11,375, same as above.Signed on 2005-09-13. Completion date: 2005-09-13.
$10,624, same as above.Signed on 2005-10-06. Completion date: 2005-10-06.
$10,603, same as above.Signed on 2005-10-05. Completion date: 2005-10-05.
EDUCATIONAL & BUSINESS SYSTEMS (2960 S MCCALL ROAD; small business)
$37,222 with Air Force for Defense Electronics and Communication Equipment -- Management and Support (R&D). Signed on 2004-08-10. Completion date: 2004-09-03.
PRO SPORT FLOORS, INC (2751 AVENUE OF THE AMERICA; small business)
$14,850 with Army for Maintenance, Repair or Alteration of Real Property -- Recreational Buildings. Taking place in CO. Signed on 2003-12-23. Completion date: 2004-02-02.
Top industries in this zip code by the number of employees in 2005:
2002 - 2018 National Fire Incident Reporting System (NFIRS) incidents
According to the data from the years 2002 - 2018 the average number of fires per year is 65. The highest number of fires - 140 took place in 2011, and the least - 6 in 2016. The data has a declining trend.
When looking into fire subcategories, the most reports belonged to: Outside Fires (64.7%), and Structure Fires (19.4%).
Fire incident types reported to NFIRS in Zip Code 34224


 Nearest zip codes: 33947, 33946, 34223, 33981, 34293, 33953.
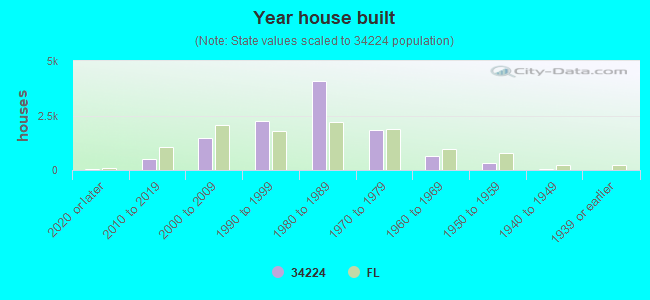


 According to the data from the years 2002 - 2018 the average number of fires per year is 65. The highest number of fires - 140 took place in 2011, and the least - 6 in 2016. The data has a declining trend.
 When looking into fire subcategories, the most reports belonged to: Outside Fires (64.7%), and Structure Fires (19.4%).