Estimated zip code population in 2022: 19,655 Zip code population in 2010: 16,875 Zip code population in 2000: 18,002
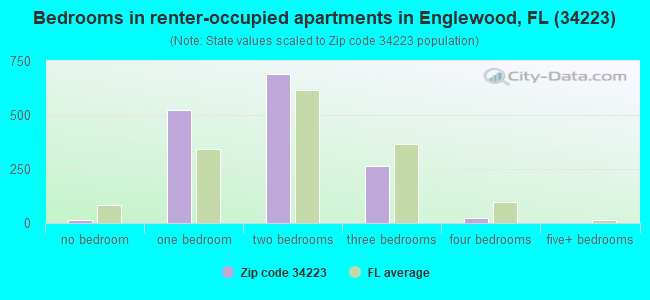
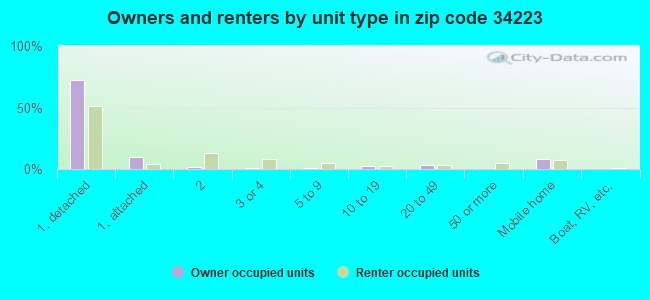
Houses and condos: 14,829 Renter-occupied apartments: 1,515
% of renters here:
14%
State:
33%
March 2022 cost of living index in zip code 34223: 95.3 (near average, U.S. average is 100)
Land area: 28.5 sq. mi. Water area: 9.8 sq. mi.
Population density: 688 people per square mile
(low).
OSM Map
General Map
Google Map
MSN Map
OSM Map
General Map
Google Map
MSN Map
OSM Map
General Map
Google Map
MSN Map
OSM Map
General Map
Google Map
MSN Map
Please wait while loading the map...
Real estate property taxes paid for housing units in 2022:
This zip code:
0.7% ($2,706)
Florida:
0.7% ($2,529)
Median real estate property taxes paid for housing units with mortgages in 2022: $2,707 (0.7%) Median real estate property taxes paid for housing units with no mortgage in 2022: $2,704 (0.7%)
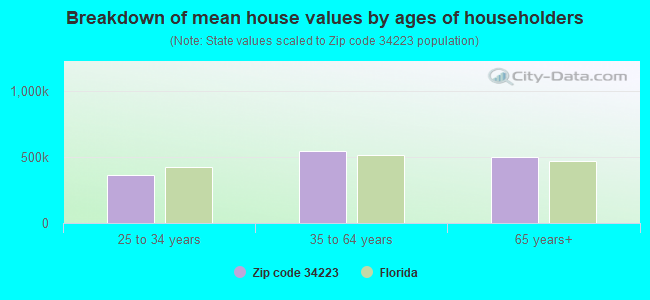
Estimated median house/condo value in 2022: $412,753
34223:
$412,753
Florida:
$354,100
According to our research of Florida and other state lists, there were 18 registered sex offenders living in 34223 zip code as of April 27, 2024. The ratio of all residents to sex offenders in zip code 34223 is 939 to 1. The ratio of registered sex offenders to all residents in this zip code is lower than the state average.
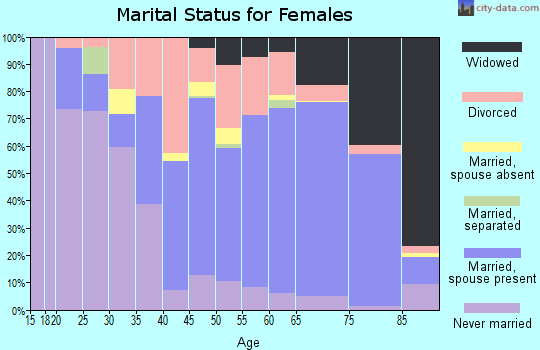
Median resident age:
This zip code:
67.6 years
Florida median age:
42.7 years
Average household size:
This zip code:
1.9 people
Florida:
2.5 people
Averages for the 2020 tax year for zip code 34223, filed in 2021:
Average Adjusted Gross Income (AGI) in 2020: $106,944 (Individual Income Tax Returns)
Here:
$106,944
State:
$82,200
Salary/wage: $58,368 (reported on 52.2% of returns)
Here:
$58,368
State:
$58,347
(% of AGI for various income ranges: 953.6% for AGIs below $25k, 2727.5% for AGIs $25k-50k, 3968.4% for AGIs $50k-75k, 4846.7% for AGIs $75k-100k, 9373.4% for AGIs $100k-200k, 79654.3% for AGIs over 200k)
Taxable interest for individuals: $4,459 (reported on 50.2% of returns)
This zip code:
$4,459
Florida:
$4,272
(% of AGI for various income ranges: 67.6% for AGIs below $25k, 92.7% for AGIs $25k-50k, 193.0% for AGIs $50k-75k, 290.8% for AGIs $75k-100k, 515.2% for AGIs $100k-200k, 8491.4% for AGIs over 200k)
Ordinary dividends: $14,771 (reported on 41.8% of returns)
Here:
$14,771
State:
$15,863
(% of AGI for various income ranges: 130.8% for AGIs below $25k, 217.7% for AGIs $25k-50k, 474.9% for AGIs $50k-75k, 732.4% for AGIs $75k-100k, 1808.5% for AGIs $100k-200k, 23028.6% for AGIs over 200k)
Net capital gain/loss in AGI: +$33,234 (reported on 38.2% of returns)
Here:
+$33,234
State:
+$62,983
(% of AGI for various income ranges: 21.2% for AGIs below $25k, 111.0% for AGIs $25k-50k, 391.2% for AGIs $50k-75k, 638.6% for AGIs $75k-100k, 2386.5% for AGIs $100k-200k, 66505.0% for AGIs over 200k)
Profit/loss from business: +$18,724 (reported on 14.9% of returns)
Here:
+$18,724
State:
+$9,719
(% of AGI for various income ranges: 184.0% for AGIs below $25k, 159.8% for AGIs $25k-50k, 255.3% for AGIs $50k-75k, 348.8% for AGIs $75k-100k, 672.1% for AGIs $100k-200k, 8759.3% for AGIs over 200k)
Taxable individual retirement arrangement distribution: $25,645 (reported on 27.1% of returns)
34223:
$25,645
Florida:
$24,823
(% of AGI for various income ranges: 192.8% for AGIs below $25k, 403.2% for AGIs $25k-50k, 929.9% for AGIs $50k-75k, 1761.6% for AGIs $75k-100k, 3128.9% for AGIs $100k-200k, 12961.4% for AGIs over 200k)
Self-employed (Keogh) retirement plans: $23,483 (reported on 0.6% of returns)
34223:
$23,483
Florida:
$29,694
(% of AGI for various income ranges: 55.6% for AGIs $100k-200k, 724.3% for AGIs over 200k)
Total itemized deductions: $57,688 (reported on 9.0% of returns)
Here:
$57,688
State:
$45,393
(% of AGI for various income ranges: 148.3% for AGIs below $25k, 220.9% for AGIs $25k-50k, 382.3% for AGIs $50k-75k, 577.3% for AGIs $75k-100k, 1122.1% for AGIs $100k-200k, 20999.3% for AGIs over 200k)
Charity contributions: $18,314 (reported on 7.5% of returns)
Here:
$18,314
State:
$20,178
(% of AGI for various income ranges: 6.2% for AGIs below $25k, 21.9% for AGIs $25k-50k, 54.2% for AGIs $50k-75k, 105.1% for AGIs $75k-100k, 238.6% for AGIs $100k-200k, 7003.6% for AGIs over 200k)
Taxes paid: $7,052 (reported on 8.9% of returns)
34223:
$7,052
State:
$6,967
(% of AGI for various income ranges: 19.3% for AGIs below $25k, 31.9% for AGIs $25k-50k, 74.6% for AGIs $50k-75k, 128.8% for AGIs $75k-100k, 247.6% for AGIs $100k-200k, 1537.9% for AGIs over 200k)
Earned income credit: $1,665 (reported on 8.4% of returns)
Here:
$1,665
State:
$2,306
(% of AGI for various income ranges: 54.2% for AGIs below $25k, 30.3% for AGIs $25k-50k)
Percentage of individuals using paid preparers for their 2020 taxes: 91.5%
Here:
91%
State:
92%
(% for various income ranges: 89.4% for AGIs below $25k, 92.1% for AGIs $25k-50k, 93.0% for AGIs $50k-75k, 91.7% for AGIs $75k-100k, 91.2% for AGIs $100k-200k, 95.8% for AGIs over 200k)
Averages for the 2012 tax year for zip code 34223, filed in 2013:
Average Adjusted Gross Income (AGI) in 2012: $69,136 (Individual Income Tax Returns)
Here:
$69,136
State:
$60,316
Salary/wage: $39,817 (reported on 54.9% of returns)
Here:
$39,817
State:
$45,277
(% of AGI for various income ranges: 51.0% for AGIs below $25k, 47.1% for AGIs $25k-50k, 35.9% for AGIs $50k-75k, 32.4% for AGIs $75k-100k, 33.2% for AGIs $100k-200k, 20.7% for AGIs over 200k)
Taxable interest for individuals: $4,641 (reported on 50.4% of returns)
This zip code:
$4,641
Florida:
$3,587
(% of AGI for various income ranges: 4.1% for AGIs below $25k, 2.3% for AGIs $25k-50k, 2.8% for AGIs $50k-75k, 2.6% for AGIs $75k-100k, 3.3% for AGIs $100k-200k, 4.0% for AGIs over 200k)
Ordinary dividends: $12,025 (reported on 40.0% of returns)
Here:
$12,025
State:
$12,831
(% of AGI for various income ranges: 6.2% for AGIs below $25k, 4.5% for AGIs $25k-50k, 4.9% for AGIs $50k-75k, 5.0% for AGIs $75k-100k, 8.0% for AGIs $100k-200k, 8.6% for AGIs over 200k)
Net capital gain/loss in AGI: +$22,284 (reported on 34.4% of returns)
Here:
+$22,284
State:
+$33,493
(% of AGI for various income ranges: 2.0% for AGIs $50k-75k, 2.0% for AGIs $75k-100k, 4.1% for AGIs $100k-200k, 26.1% for AGIs over 200k)
Profit/loss from business: +$17,192 (reported on 14.8% of returns)
Here:
+$17,192
State:
+$10,012
(% of AGI for various income ranges: 8.8% for AGIs below $25k, 4.1% for AGIs $25k-50k, 1.9% for AGIs $50k-75k, 2.4% for AGIs $75k-100k, 3.0% for AGIs $100k-200k, 3.9% for AGIs over 200k)
Taxable individual retirement arrangement distribution: $20,383 (reported on 28.5% of returns)
34223:
$20,383
Florida:
$21,544
(% of AGI for various income ranges: 8.7% for AGIs below $25k, 6.9% for AGIs $25k-50k, 8.7% for AGIs $50k-75k, 10.6% for AGIs $75k-100k, 10.4% for AGIs $100k-200k, 7.1% for AGIs over 200k)
Self-employment retirement plans: $21,733 (reported on 0.4% of returns)
34223:
$21,733
Florida:
$20,611
Total itemized deductions: $29,527 (21% of AGI, reported on 30.5% of returns)
Here:
$29,527
State:
$25,533
Here:
21.2% of AGI
State:
18.0% of AGI
(% of AGI for various income ranges: 16.3% for AGIs below $25k, 12.5% for AGIs $25k-50k, 12.2% for AGIs $50k-75k, 12.5% for AGIs $75k-100k, 12.6% for AGIs $100k-200k, 13.2% for AGIs over 200k)
Charity contributions: $4,472 (reported on 24.6% of returns)
Here:
$4,472
State:
$5,698
(% of AGI for various income ranges: 1.0% for AGIs below $25k, 1.2% for AGIs $25k-50k, 1.4% for AGIs $50k-75k, 1.7% for AGIs $75k-100k, 1.7% for AGIs $100k-200k, 1.8% for AGIs over 200k)
Taxes paid: $8,657 (reported on 29.9% of returns)
34223:
$8,657
State:
$6,203
(% of AGI for various income ranges: 3.4% for AGIs below $25k, 3.1% for AGIs $25k-50k, 3.0% for AGIs $50k-75k, 3.7% for AGIs $75k-100k, 4.1% for AGIs $100k-200k, 4.1% for AGIs over 200k)
Earned income credit: $1,738 (reported on 11.7% of returns)
Here:
$1,738
State:
$2,372
(% of AGI for various income ranges: 3.5% for AGIs below $25k, 0.4% for AGIs $25k-50k)
Percentage of individuals using paid preparers for their 2012 taxes: 59.1%
Here:
59%
State:
54%
(% for various income ranges: 52.3% for AGIs below $25k, 57.6% for AGIs $25k-50k, 62.2% for AGIs $50k-75k, 66.7% for AGIs $75k-100k, 69.2% for AGIs $100k-200k, 83.9% for AGIs over 200k)
Averages for the 2004 tax year for zip code 34223, filed in 2005:
Average Adjusted Gross Income (AGI) in 2004: $57,949 (Individual Income Tax Returns)
Here:
$57,949
State:
$50,523
Salary/wage: $39,484 (reported on 57.5% of returns)
Here:
$39,484
State:
$39,563
(% of AGI for various income ranges: 132.8% for AGIs below $10k, 49.8% for AGIs $10k-25k, 47.8% for AGIs $25k-50k, 42.0% for AGIs $50k-75k, 40.7% for AGIs $75k-100k, 32.9% for AGIs over 100k)
Taxable interest for individuals: $4,274 (reported on 61.5% of returns)
This zip code:
$4,274
Florida:
$3,211
(% of AGI for various income ranges: 25.1% for AGIs below $10k, 6.5% for AGIs $10k-25k, 5.1% for AGIs $25k-50k, 4.6% for AGIs $50k-75k, 3.7% for AGIs $75k-100k, 3.9% for AGIs over 100k)
Taxable dividends: $7,193 (reported on 45.6% of returns)
Here:
$7,193
State:
$6,129
(% of AGI for various income ranges: 19.9% for AGIs below $10k, 5.7% for AGIs $10k-25k, 4.3% for AGIs $25k-50k, 4.1% for AGIs $50k-75k, 4.8% for AGIs $75k-100k, 6.4% for AGIs over 100k)
Net capital gain/loss: +$19,330 (reported on 40.4% of returns)
Here:
+$19,330
State:
+$27,205
(% of AGI for various income ranges: -10.7% for AGIs below $10k, 0.9% for AGIs $10k-25k, 1.7% for AGIs $25k-50k, 3.2% for AGIs $50k-75k, 7.1% for AGIs $75k-100k, 22.7% for AGIs over 100k)
Profit/loss from business: +$13,745 (reported on 14.8% of returns)
Here:
+$13,745
State:
+$10,634
(% of AGI for various income ranges: 20.1% for AGIs below $10k, 5.0% for AGIs $10k-25k, 3.4% for AGIs $25k-50k, 2.8% for AGIs $50k-75k, 3.0% for AGIs $75k-100k, 3.3% for AGIs over 100k)
IRA payment deduction: $3,502 (reported on 3.2% of returns)
34223:
$3,502
Florida:
$3,082
(% of AGI for various income ranges: 0.9% for AGIs below $10k, 0.2% for AGIs $10k-25k, 0.3% for AGIs $25k-50k, 0.3% for AGIs $50k-75k, 0.3% for AGIs $75k-100k, 0.1% for AGIs over 100k)
Self-employed pension: $16,951 (reported on 1.0% of returns)
Here:
$16,951
Florida:
$15,857
Total itemized deductions: $21,943 (21% of AGI, reported on 33.3% of returns)
Here:
$21,943
State:
$20,370
Here:
21.0% of AGI
State:
20.7% of AGI
(% of AGI for various income ranges: 57.6% for AGIs below $10k, 16.9% for AGIs $10k-25k, 14.6% for AGIs $25k-50k, 13.1% for AGIs $50k-75k, 12.9% for AGIs $75k-100k, 10.6% for AGIs over 100k)
Charity contributions deductions: $4,352 (4% of AGI, reported on 28.3% of returns)
Here:
$4,352
State:
$4,064
Here:
3.9% of AGI
State:
3.8% of AGI
(% of AGI for various income ranges: 2.2% for AGIs below $10k, 1.4% for AGIs $10k-25k, 1.4% for AGIs $25k-50k, 1.7% for AGIs $50k-75k, 1.8% for AGIs $75k-100k, 2.6% for AGIs over 100k)
Total tax: $10,721 (reported on 77.3% of returns)
34223:
$10,721
State:
$9,431
(% of AGI for various income ranges: 5.7% for AGIs below $10k, 3.9% for AGIs $10k-25k, 7.0% for AGIs $25k-50k, 9.7% for AGIs $50k-75k, 11.1% for AGIs $75k-100k, 19.7% for AGIs over 100k)
Earned income credit: $1,442 (reported on 9.0% of returns)
Here:
$1,442
State:
$1,808
Percentage of individuals using paid preparers for their 2004 taxes: 65.0%
Here:
65%
State:
60%
(% for various income ranges: 57.8% for AGIs below $10k, 62.6% for AGIs $10k-25k, 62.8% for AGIs $25k-50k, 66.9% for AGIs $50k-75k, 67.0% for AGIs $75k-100k, 84.3% for AGIs over 100k)
Likely homosexual households (counted as self-reported same-sex unmarried-partner households)
Lesbian couples: 0.3% of all households
Gay men: 0.2% of all households
Household received Food Stamps/SNAP in the past 12 months: 265 Household did not receive Food Stamps/SNAP in the past 12 months: 10,295
Women who had a birth in the past 12 months: 77 (68 now married, 11 unmarried) Women who did not have a birth in the past 12 months: 1,547 (492 now married, 1,054 unmarried)
Housing units in zip code 34223 with a mortgage: 2,760 (210 second mortgage, 193 both second mortgage and home equity loan) Houses without a mortgage: 115
Median monthly owner costs for units with a mortgage: $1,627 Median monthly owner costs for units without a mortgage: $678
Residents with income below the poverty level in 2022:
This zip code:
6.8%
Whole state:
12.7%
Residents with income below 50% of the poverty level in 2022:
This zip code:
3.5%
Whole state:
6.6%
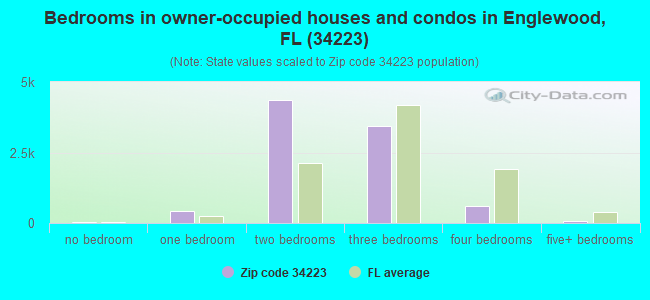
Median number of rooms in houses and condos:
Here:
5.3
State:
5.9
Median number of rooms in apartments:
Here:
3.9
State:
4.2
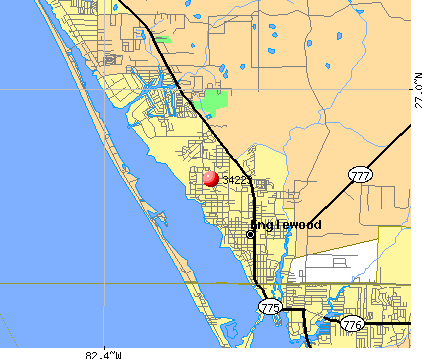
Notable locations in this zip code not listed on our city pages
Notable locations in zip code 34223: Englewood Square (A), Central Plaza (B), Englewood Area Fire Control District Station 71 (C), Englewood Area Fire Control District Station 73 (D), Sarasota County Fire Department Station 73 (E), Sarasota Police Department Community Policing Station (F). Display/hide their locations on the map
Shopping Centers: Lemon Bay Shopping Center (1), Englewood Shopping Center (2), The Englewood Square Shopping Center (3). Display/hide their locations on the map
In group quarters: 60 (-1 institutionalized population)
Size of family households: 5,094 2-persons, 652 3-persons, 343 4-persons, 108 5-persons, 29 6-persons, 52 7-or-more-persons
Size of nonfamily households: 3,485 1-person, 686 2-persons, 43 3-persons
869 married couples with children.
419 single-parent households (259 men, 160 women).
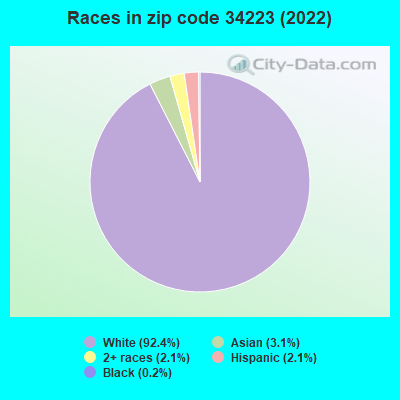
94.0% of residents of 34223 zip code speak English at home.
1.4% of residents speak Spanish at home (77% very well, 20% well, 2% not at all).
2.8% of residents speak other Indo-European language at home (85% very well, 11% well, 4% not well).
2.5% of residents speak Asian or Pacific Island language at home (59% very well, 29% well, 13% not well).
0.1% of residents speak other language at home (54% very well, 46% not well).
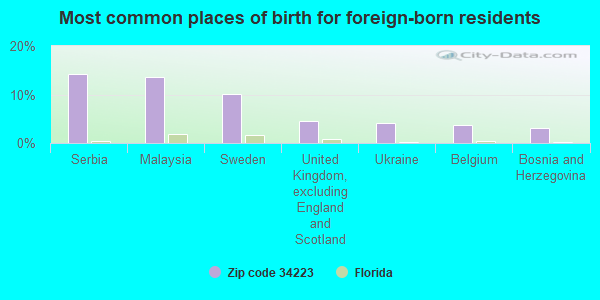
Foreign born population: 1,749 (8.9%) (65.7% of them are naturalized citizens)
This zip code:
8.9%
Whole state:
21.7%
14%Serbia
14%Malaysia
10%Sweden
5%United Kingdom, excluding England and Scotland
4%Ukraine
4%Belgium
3%Bosnia and Herzegovina
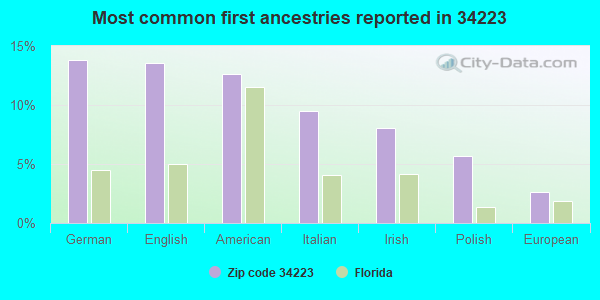
14%German
14%English
13%American
9%Italian
8%Irish
6%Polish
3%European
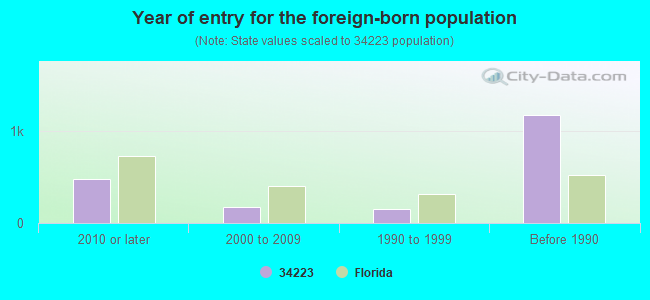
Year of entry for the foreign-born population
4792010 or later
1732000 to 2009
1491990 to 1999
1,178Before 1990
Major facilities with environmental interests located in this zip code:
ARTISTS ENCLAVE (695 ARTIST AVE in ENGLEWOOD, FL)
National Pollutant Discharge Elimination System NON-MAJOR (Tracking pollutant discharge elimination systems) - permit Organizations: JAMES FREDERICK (CONTACT/OWNER)
HAFH STORAGE FACILITY (584 RUSTY MARSHALL DR in ENGLEWOOD, FL)
National Pollutant Discharge Elimination System NON-MAJOR (Tracking pollutant discharge elimination systems) - permit Organizations: THOMAS DIGNAM (CONTACT/OWNER)
HERITAGE CREEK SUBDIVISION (ENGLEWOOD ROAD, W OF SR 776, N in ENGLEWOOD, FL)
National Pollutant Discharge Elimination System NON-MAJOR (Tracking pollutant discharge elimination systems) - permit Organizations: JEFFREY GATES (CONTACT/OWNER)
J & F FURNITURE REFINISHING (190 ARTISTS AVE in ENGLEWOOD, FL)
(Resource Conservation and Recovery Act (tracking hazardous waste)) Organizations: WILLIAM SNYDER (CONTACT/OWNER)
MYAKKA SUBSTATION (1651 RIVER RD in ENGLEWOOD, FL)
NEW CONCEPTS STORAGE (LOTS 22 & 23 PAUL MORRIS DR in ENGLEWOOD, FL)
National Pollutant Discharge Elimination System NON-MAJOR (Tracking pollutant discharge elimination systems) - permit Organizations: ROBERT PIPER (CONTACT/OWNER)
OAK FOREST (STATE ROAD 776 in ENGLEWOOD, FL)
National Pollutant Discharge Elimination System NON-MAJOR (Tracking pollutant discharge elimination systems) - permit Organizations: RONALD JOHNSON (CONTACT/OWNER)
PARK FOREST PHASE V (PARK FOREST BLVD. in ENGLEWOOD, FL)
National Pollutant Discharge Elimination System NON-MAJOR (Tracking pollutant discharge elimination systems) - permit Organizations: MICHAEL JOHNSON (CONTACT/OWNER)
PARK PLACE ESTATES (OLD ENGLEWOOD in ENGLEWOOD, FL)
National Pollutant Discharge Elimination System NON-MAJOR (Tracking pollutant discharge elimination systems) - permit Organizations: ART JOSEPH (CONTACT/OWNER)
Alternative names: ART JOSEPH BOARDWALK PROPERTY
PLATTS GOVERNMENT SURPLUS MATERIALS (920 S RIVER RD in ENGLEWOOD, FL)
(Resource Conservation and Recovery Act (tracking hazardous waste)) Organizations: DONALD PLATT (CONTACT/OWNER)
BOCA ROYALE COUNTRY CLUB (1 SOUTH GOLFVIEW DR in ENGLEWOOD, FL)
(Resource Conservation and Recovery Act (tracking hazardous waste)) Organizations: NON NOTIFIER (CONTACT/OWNER)
BOCA ROYALE, UNIT 9 (NE SIDE SR 776 IN SARASOTA COU in ENGLEWOOD, FL)
National Pollutant Discharge Elimination System NON-MAJOR (Tracking pollutant discharge elimination systems) - permit Organizations: GEORGE THOMPSON (CONTACT/OWNER)
ROYAL PALM MARINA INC (779 WENTWORTH in ENGLEWOOD, FL)
(Resource Conservation and Recovery Act (tracking hazardous waste)) Organizations: JOHN BAIRAMONTE (CONTACT/OWNER)
Housing units lacking complete plumbing facilities: 0.4% Housing units lacking complete kitchen facilities: 1.2%
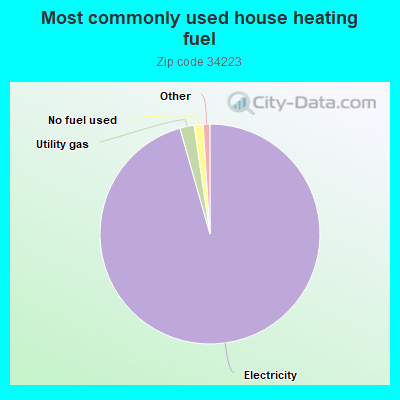
95.6%Electricity
2.1%Utility gas
1.3%No fuel used
Population in 1990: 15,705. Population change in the 1990s: +2,297 (+14.6%).
Place of birth for U.S.-born residents:
This state: 2,967
Northeast: 6,890
Midwest: 5,449
South: 1,749
West: 566
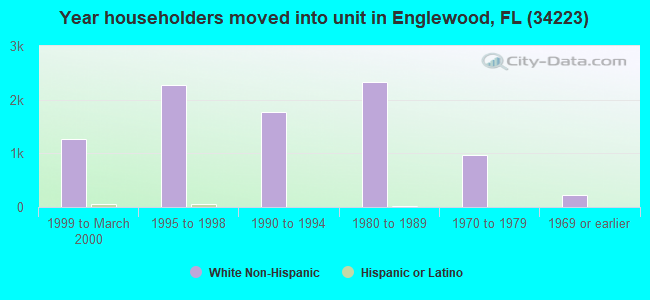
59% of the 34223 zip code residents lived in the same house 5 years ago. Out of people who lived in different houses, 40% lived in this county. Out of people who lived in different counties, 50% lived in Florida.
87% of the 34223 zip code residents lived in the same house 1 year ago. Out of people who lived in different houses, 30% moved from this county. Out of people who lived in different houses, 16% moved from different county within same state. Out of people who lived in different houses, 53% moved from different state. Out of people who lived in different houses, 5% moved from abroad.
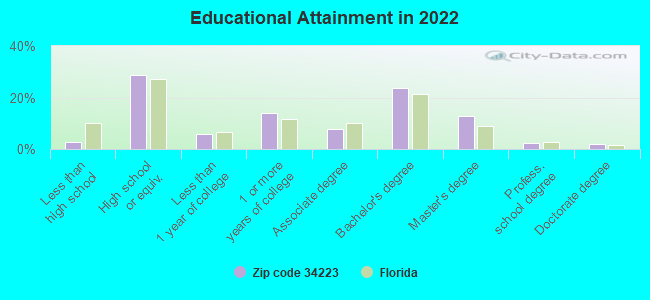
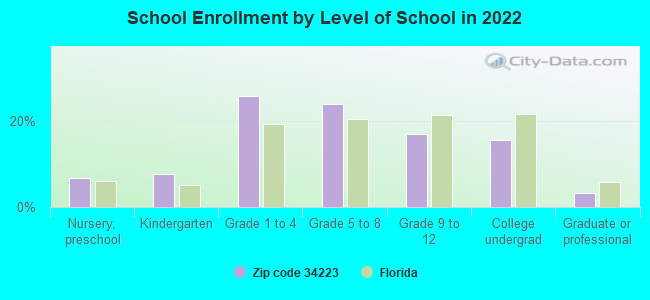
Private vs. public school enrollment:
Students in private schools in grades 1 to 8 (elementary and middle school): 46
Here:
6.5%
Florida:
15.8%
Students in private schools in grades 9 to 12 (high school):
Here:
0.0%
Florida:
12.9%
Students in private undergraduate colleges: 17
Here:
8.0%
Florida:
23.6%
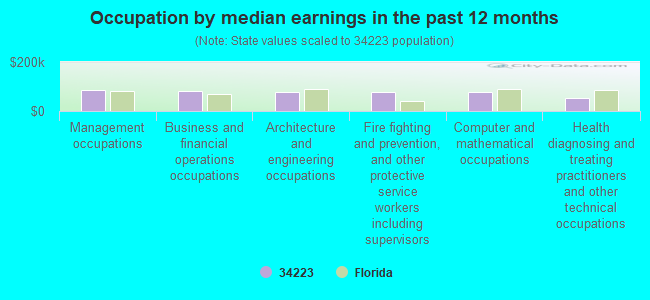
Occupation by median earnings in the past 12 months ($)
88,238Management occupations
83,098Business and financial operations occupations
80,067Architecture and engineering occupations
79,962Fire fighting and prevention, and other protective service workers including supervisors
79,652Computer and mathematical occupations
54,997Health diagnosing and treating practitioners and other technical occupations
Companies with federal contracts located in this zip code (ENGLEWOOD, FL):
SILVER SUN PRODUCTIONS, INC (2345 BUCKSKIN DR; small business) : $73,350 in 2 contractsin 2002
$45,000 with Navy for Film/Video Tape Production Services. Signed on 2002-08-26. Completion date: 2003-08-25.
$28,350, same as above.Signed on 2002-03-15. Completion date: 2002-03-18.
TRICONN INTERNATIONAL CORP. (1811 ENGLEWOOD RD #301; small business)
$43,892 with U.S. Army Corps of Engineers - civil program financing only for Maintenance, Repair and Rebuilding of Equipment -- Ship and Marine Equipment. Taking place in OR. Signed on 2000-08-23. Completion date: 2000-11-24.
CHESTER RUSSEL CHAPIN (315 QUAILS RUN BLVD BLD 4; small business) : $6,225 in 2 contractsin 2002
$6,225 with U.S. Army Corps of Engineers - civil program financing only for Facilities Operations Support Services. Taking place in NH. Signed on 2002-01-04. Completion date: 2002-09-08.
$0, same as above.Signed on 2002-01-04. Completion date: 2002-09-08.
CONTRACT SOLUTIONS INC (517 PAUL MORRIS DR UNIT C3; small business)
$2,039 with Air Force for Office Furniture. Signed on 2004-12-03. Completion date: 2005-01-31.
MERRY MECHANIZATION, INC (333A S INDIANA AVE; small business)
$1,590 with Navy for ADP System Acquisition Support Services. Includes preparation of statement of work, benchmarks, specifications, etc.. Signed on 2004-10-01. Completion date: 2005-09-30.
Top industries in this zip code by the number of employees in 2005:
Administrative and Support and Waste Management and Remediation Services: Professional Employer Organizations (500-999 employees: 1 establishment)
Health Care and Social Assistance: General Medical and Surgical Hospitals (250-499: 1)
2002 - 2018 National Fire Incident Reporting System (NFIRS) incidents
According to the data from the years 2002 - 2018 the average number of fires per year is 66. The highest number of fires - 166 took place in 2009, and the least - 6 in 2017. The data has a declining trend.
When looking into fire subcategories, the most reports belonged to: Outside Fires (61.3%), and Structure Fires (22.7%).
Fire incident types reported to NFIRS in Zip Code 34223


 Nearest zip codes: 34293, 34224, 34292, 34287, 33947, 34285.


 According to the data from the years 2002 - 2018 the average number of fires per year is 66. The highest number of fires - 166 took place in 2009, and the least - 6 in 2017. The data has a declining trend.
 When looking into fire subcategories, the most reports belonged to: Outside Fires (61.3%), and Structure Fires (22.7%).