Estimated zip code population in 2022: 19,321 Zip code population in 2010: 17,599 Zip code population in 2000: 8,039
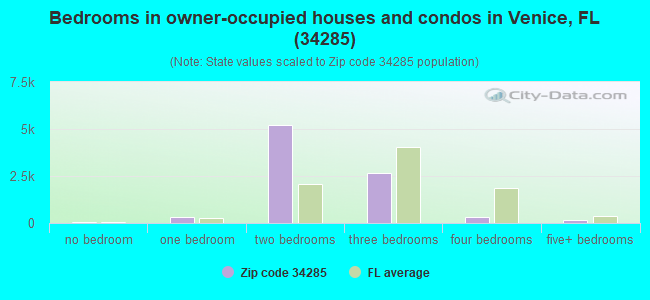
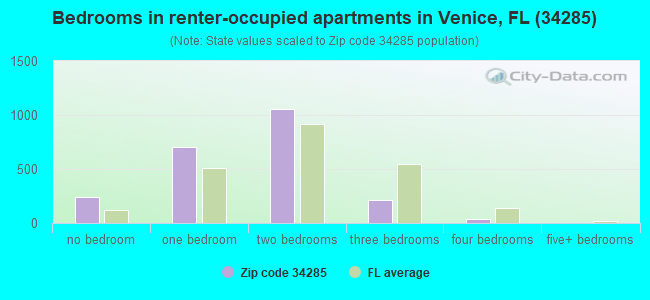
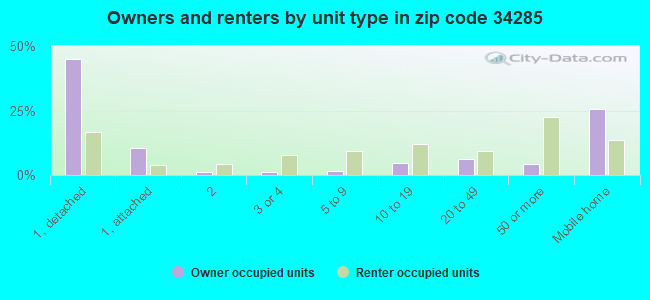
Houses and condos: 16,489 Renter-occupied apartments: 2,230
% of renters here:
20%
State:
33%
March 2022 cost of living index in zip code 34285: 94.9 (less than average, U.S. average is 100)
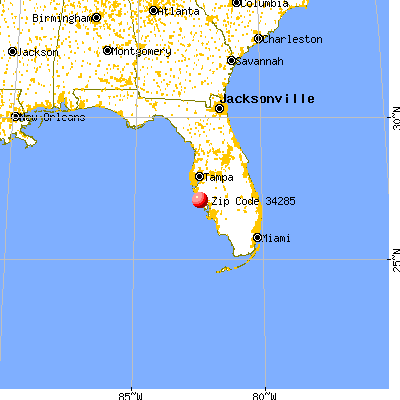
Land area: 8.2 sq. mi. Water area: 1.7 sq. mi.
Population density: 2,350 people per square mile
(low).
OSM Map
General Map
Google Map
MSN Map
OSM Map
General Map
Google Map
MSN Map
OSM Map
General Map
Google Map
MSN Map
OSM Map
General Map
Google Map
MSN Map
Please wait while loading the map...
Real estate property taxes paid for housing units in 2022:
This zip code:
0.7% ($2,442)
Florida:
0.7% ($2,529)
Median real estate property taxes paid for housing units with mortgages in 2022: $2,821 (0.8%) Median real estate property taxes paid for housing units with no mortgage in 2022: $2,184 (0.7%)
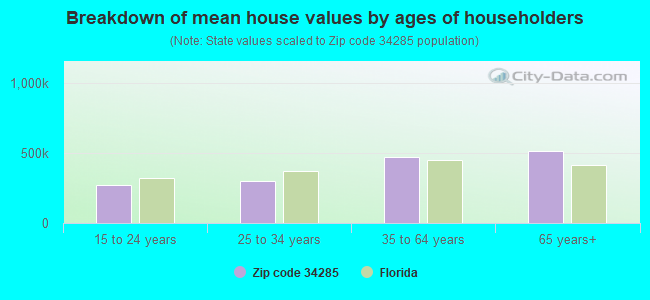
Estimated median house/condo value in 2022: $339,316
34285:
$339,316
Florida:
$354,100
According to our research of Florida and other state lists, there were 9 registered sex offenders living in 34285 zip code as of May 09, 2024. The ratio of all residents to sex offenders in zip code 34285 is 2,081 to 1. The ratio of registered sex offenders to all residents in this zip code is much lower than the state average.
Median resident age:
This zip code:
69.8 years
Florida median age:
42.7 years
Average household size:
This zip code:
1.7 people
Florida:
2.5 people
Averages for the 2020 tax year for zip code 34285, filed in 2021:
Average Adjusted Gross Income (AGI) in 2020: $107,687 (Individual Income Tax Returns)
Here:
$107,687
State:
$82,200
Salary/wage: $64,906 (reported on 47.7% of returns)
Here:
$64,906
State:
$58,347
(% of AGI for various income ranges: 895.7% for AGIs below $25k, 2555.8% for AGIs $25k-50k, 3651.5% for AGIs $50k-75k, 4593.6% for AGIs $75k-100k, 8015.4% for AGIs $100k-200k, 77184.4% for AGIs over 200k)
Taxable interest for individuals: $4,091 (reported on 54.2% of returns)
This zip code:
$4,091
Florida:
$4,272
(% of AGI for various income ranges: 74.0% for AGIs below $25k, 90.3% for AGIs $25k-50k, 241.8% for AGIs $50k-75k, 339.5% for AGIs $75k-100k, 625.5% for AGIs $100k-200k, 5915.0% for AGIs over 200k)
Ordinary dividends: $17,702 (reported on 46.3% of returns)
Here:
$17,702
State:
$15,863
(% of AGI for various income ranges: 161.8% for AGIs below $25k, 257.9% for AGIs $25k-50k, 653.4% for AGIs $50k-75k, 1305.5% for AGIs $75k-100k, 2573.8% for AGIs $100k-200k, 23297.8% for AGIs over 200k)
Net capital gain/loss in AGI: +$47,167 (reported on 41.9% of returns)
Here:
+$47,167
State:
+$62,983
(% of AGI for various income ranges: 50.3% for AGIs below $25k, 122.8% for AGIs $25k-50k, 431.0% for AGIs $50k-75k, 958.4% for AGIs $75k-100k, 2424.6% for AGIs $100k-200k, 86246.1% for AGIs over 200k)
Profit/loss from business: +$17,875 (reported on 13.3% of returns)
Here:
+$17,875
State:
+$9,719
(% of AGI for various income ranges: 163.7% for AGIs below $25k, 162.9% for AGIs $25k-50k, 200.0% for AGIs $50k-75k, 326.6% for AGIs $75k-100k, 769.8% for AGIs $100k-200k, 5175.6% for AGIs over 200k)
Taxable individual retirement arrangement distribution: $28,282 (reported on 30.1% of returns)
34285:
$28,282
Florida:
$24,823
(% of AGI for various income ranges: 207.8% for AGIs below $25k, 445.1% for AGIs $25k-50k, 933.7% for AGIs $50k-75k, 1988.9% for AGIs $75k-100k, 3988.8% for AGIs $100k-200k, 15330.0% for AGIs over 200k)
Self-employed (Keogh) retirement plans: $21,075 (reported on 0.9% of returns)
34285:
$21,075
Florida:
$29,694
(% of AGI for various income ranges: 85.1% for AGIs $100k-200k, 629.4% for AGIs over 200k)
Total itemized deductions: $44,486 (reported on 11.6% of returns)
Here:
$44,486
State:
$45,393
(% of AGI for various income ranges: 186.8% for AGIs below $25k, 278.4% for AGIs $25k-50k, 616.2% for AGIs $50k-75k, 944.3% for AGIs $75k-100k, 1754.8% for AGIs $100k-200k, 11526.7% for AGIs over 200k)
Charity contributions: $16,738 (reported on 10.1% of returns)
Here:
$16,738
State:
$20,178
(% of AGI for various income ranges: 8.0% for AGIs below $25k, 35.4% for AGIs $25k-50k, 82.7% for AGIs $50k-75k, 165.9% for AGIs $75k-100k, 350.5% for AGIs $100k-200k, 6240.6% for AGIs over 200k)
Taxes paid: $6,764 (reported on 11.5% of returns)
34285:
$6,764
State:
$6,967
(% of AGI for various income ranges: 22.9% for AGIs below $25k, 36.2% for AGIs $25k-50k, 104.4% for AGIs $50k-75k, 165.5% for AGIs $75k-100k, 309.8% for AGIs $100k-200k, 1552.8% for AGIs over 200k)
Earned income credit: $1,573 (reported on 6.8% of returns)
Here:
$1,573
State:
$2,306
(% of AGI for various income ranges: 45.8% for AGIs below $25k, 19.8% for AGIs $25k-50k)
Percentage of individuals using paid preparers for their 2020 taxes: 90.6%
Here:
91%
State:
92%
(% for various income ranges: 89.4% for AGIs below $25k, 91.7% for AGIs $25k-50k, 90.8% for AGIs $50k-75k, 89.5% for AGIs $75k-100k, 90.2% for AGIs $100k-200k, 93.8% for AGIs over 200k)
Averages for the 2012 tax year for zip code 34285, filed in 2013:
Average Adjusted Gross Income (AGI) in 2012: $68,491 (Individual Income Tax Returns)
Here:
$68,491
State:
$60,316
Salary/wage: $43,463 (reported on 50.7% of returns)
Here:
$43,463
State:
$45,277
(% of AGI for various income ranges: 48.0% for AGIs below $25k, 44.1% for AGIs $25k-50k, 32.5% for AGIs $50k-75k, 26.3% for AGIs $75k-100k, 25.5% for AGIs $100k-200k, 31.0% for AGIs over 200k)
Taxable interest for individuals: $3,950 (reported on 56.3% of returns)
This zip code:
$3,950
Florida:
$3,587
(% of AGI for various income ranges: 4.0% for AGIs below $25k, 3.0% for AGIs $25k-50k, 2.9% for AGIs $50k-75k, 3.2% for AGIs $75k-100k, 2.7% for AGIs $100k-200k, 3.7% for AGIs over 200k)
Ordinary dividends: $12,384 (reported on 44.8% of returns)
Here:
$12,384
State:
$12,831
(% of AGI for various income ranges: 7.7% for AGIs below $25k, 6.0% for AGIs $25k-50k, 6.0% for AGIs $50k-75k, 6.5% for AGIs $75k-100k, 8.0% for AGIs $100k-200k, 10.2% for AGIs over 200k)
Net capital gain/loss in AGI: +$14,695 (reported on 38.7% of returns)
Here:
+$14,695
State:
+$33,493
(% of AGI for various income ranges: 0.5% for AGIs $25k-50k, 1.4% for AGIs $50k-75k, 2.5% for AGIs $75k-100k, 5.7% for AGIs $100k-200k, 19.0% for AGIs over 200k)
Profit/loss from business: +$11,987 (reported on 13.0% of returns)
Here:
+$11,987
State:
+$10,012
(% of AGI for various income ranges: 6.8% for AGIs below $25k, 2.8% for AGIs $25k-50k, 1.6% for AGIs $50k-75k, 1.5% for AGIs $75k-100k, 2.2% for AGIs $100k-200k, 1.7% for AGIs over 200k)
Taxable individual retirement arrangement distribution: $21,296 (reported on 33.3% of returns)
34285:
$21,296
Florida:
$21,544
(% of AGI for various income ranges: 10.0% for AGIs below $25k, 7.7% for AGIs $25k-50k, 9.8% for AGIs $50k-75k, 11.8% for AGIs $75k-100k, 14.4% for AGIs $100k-200k, 8.5% for AGIs over 200k)
Self-employment retirement plans: $15,100 (reported on 0.5% of returns)
34285:
$15,100
Florida:
$20,611
Total itemized deductions: $27,347 (21% of AGI, reported on 32.7% of returns)
Here:
$27,347
State:
$25,533
Here:
21.3% of AGI
State:
18.0% of AGI
(% of AGI for various income ranges: 18.6% for AGIs below $25k, 15.0% for AGIs $25k-50k, 14.1% for AGIs $50k-75k, 12.9% for AGIs $75k-100k, 12.9% for AGIs $100k-200k, 11.1% for AGIs over 200k)
Charity contributions: $6,135 (reported on 27.9% of returns)
Here:
$6,135
State:
$5,698
(% of AGI for various income ranges: 1.2% for AGIs below $25k, 1.4% for AGIs $25k-50k, 1.8% for AGIs $50k-75k, 1.9% for AGIs $75k-100k, 2.3% for AGIs $100k-200k, 3.7% for AGIs over 200k)
Taxes paid: $7,197 (reported on 32.0% of returns)
34285:
$7,197
State:
$6,203
(% of AGI for various income ranges: 3.1% for AGIs below $25k, 2.6% for AGIs $25k-50k, 3.1% for AGIs $50k-75k, 3.3% for AGIs $75k-100k, 4.0% for AGIs $100k-200k, 3.4% for AGIs over 200k)
Earned income credit: $1,514 (reported on 8.3% of returns)
Here:
$1,514
State:
$2,372
(% of AGI for various income ranges: 2.2% for AGIs below $25k, 0.3% for AGIs $25k-50k)
Percentage of individuals using paid preparers for their 2012 taxes: 54.0%
Here:
54%
State:
54%
(% for various income ranges: 45.3% for AGIs below $25k, 49.7% for AGIs $25k-50k, 56.5% for AGIs $50k-75k, 66.2% for AGIs $75k-100k, 67.7% for AGIs $100k-200k, 82.1% for AGIs over 200k)
Averages for the 2004 tax year for zip code 34285, filed in 2005:
Average Adjusted Gross Income (AGI) in 2004: $61,506 (Individual Income Tax Returns)
Here:
$61,506
State:
$50,523
Salary/wage: $33,832 (reported on 52.5% of returns)
Here:
$33,832
State:
$39,563
(% of AGI for various income ranges: 117.7% for AGIs below $10k, 42.8% for AGIs $10k-25k, 43.7% for AGIs $25k-50k, 32.2% for AGIs $50k-75k, 30.3% for AGIs $75k-100k, 21.0% for AGIs over 100k)
Taxable interest for individuals: $4,567 (reported on 68.5% of returns)
This zip code:
$4,567
Florida:
$3,211
(% of AGI for various income ranges: 36.7% for AGIs below $10k, 8.1% for AGIs $10k-25k, 5.7% for AGIs $25k-50k, 5.6% for AGIs $50k-75k, 5.3% for AGIs $75k-100k, 4.0% for AGIs over 100k)
Taxable dividends: $7,100 (reported on 51.5% of returns)
Here:
$7,100
State:
$6,129
(% of AGI for various income ranges: 31.3% for AGIs below $10k, 7.7% for AGIs $10k-25k, 6.0% for AGIs $25k-50k, 6.3% for AGIs $50k-75k, 7.4% for AGIs $75k-100k, 5.0% for AGIs over 100k)
Net capital gain/loss: +$16,029 (reported on 45.5% of returns)
Here:
+$16,029
State:
+$27,205
(% of AGI for various income ranges: -12.3% for AGIs below $10k, 0.4% for AGIs $10k-25k, 1.7% for AGIs $25k-50k, 4.2% for AGIs $50k-75k, 6.1% for AGIs $75k-100k, 19.3% for AGIs over 100k)
Profit/loss from business: +$13,544 (reported on 11.8% of returns)
Here:
+$13,544
State:
+$10,634
(% of AGI for various income ranges: 3.2% for AGIs below $10k, 3.5% for AGIs $10k-25k, 2.2% for AGIs $25k-50k, 2.2% for AGIs $50k-75k, 2.6% for AGIs $75k-100k, 2.7% for AGIs over 100k)
IRA payment deduction: $3,481 (reported on 3.0% of returns)
34285:
$3,481
Florida:
$3,082
(% of AGI for various income ranges: 1.0% for AGIs below $10k, 0.3% for AGIs $10k-25k, 0.2% for AGIs $25k-50k, 0.3% for AGIs $50k-75k, 0.2% for AGIs $75k-100k, 0.1% for AGIs over 100k)
Self-employed pension: $13,364 (reported on 0.7% of returns)
Here:
$13,364
Florida:
$15,857
Total itemized deductions: $23,925 (22% of AGI, reported on 36.7% of returns)
Here:
$23,925
State:
$20,370
Here:
21.7% of AGI
State:
20.7% of AGI
(% of AGI for various income ranges: 75.2% for AGIs below $10k, 23.7% for AGIs $10k-25k, 16.7% for AGIs $25k-50k, 16.3% for AGIs $50k-75k, 15.7% for AGIs $75k-100k, 10.9% for AGIs over 100k)
Charity contributions deductions: $4,492 (4% of AGI, reported on 32.0% of returns)
Here:
$4,492
State:
$4,064
Here:
3.8% of AGI
State:
3.8% of AGI
(% of AGI for various income ranges: 3.3% for AGIs below $10k, 1.7% for AGIs $10k-25k, 1.9% for AGIs $25k-50k, 2.3% for AGIs $50k-75k, 2.2% for AGIs $75k-100k, 2.6% for AGIs over 100k)
Total tax: $12,134 (reported on 78.1% of returns)
34285:
$12,134
State:
$9,431
(% of AGI for various income ranges: 4.3% for AGIs below $10k, 3.7% for AGIs $10k-25k, 7.1% for AGIs $25k-50k, 9.4% for AGIs $50k-75k, 10.9% for AGIs $75k-100k, 21.7% for AGIs over 100k)
Earned income credit: $1,265 (reported on 6.8% of returns)
Here:
$1,265
State:
$1,808
Percentage of individuals using paid preparers for their 2004 taxes: 65.8%
Here:
66%
State:
60%
(% for various income ranges: 59.6% for AGIs below $10k, 63.3% for AGIs $10k-25k, 65.5% for AGIs $25k-50k, 66.9% for AGIs $50k-75k, 68.5% for AGIs $75k-100k, 78.3% for AGIs over 100k)
Likely homosexual households (counted as self-reported same-sex unmarried-partner households)
Lesbian couples: 0.4% of all households
Gay men: 0.5% of all households
Household received Food Stamps/SNAP in the past 12 months: 542 Household did not receive Food Stamps/SNAP in the past 12 months: 10,457
Women who had a birth in the past 12 months: 22 (24 now married, 0 unmarried) Women who did not have a birth in the past 12 months: 1,610 (480 now married, 1,129 unmarried)
Housing units in zip code 34285 with a mortgage: 2,759 (405 second mortgage, 363 both second mortgage and home equity loan) Houses without a mortgage: 108
Median monthly owner costs for units with a mortgage: $1,769 Median monthly owner costs for units without a mortgage: $767
Residents with income below the poverty level in 2022:
This zip code:
6.8%
Whole state:
12.7%
Residents with income below 50% of the poverty level in 2022:
This zip code:
3.5%
Whole state:
6.6%
Median number of rooms in houses and condos:
Here:
5.1
State:
5.9
Median number of rooms in apartments:
Here:
3.8
State:
4.2
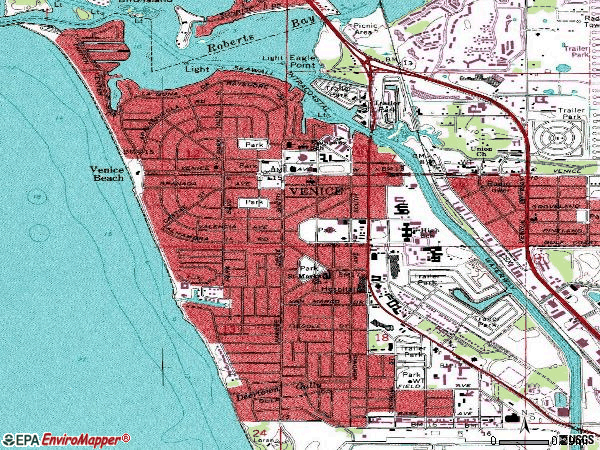
Notable locations in this zip code not listed on our city pages
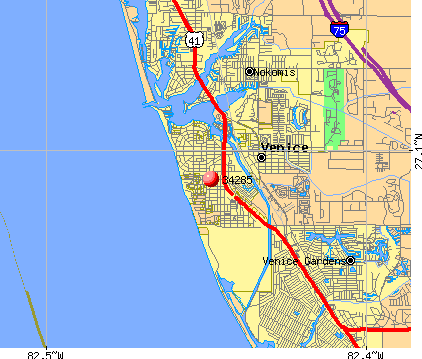
Notable locations in zip code 34285: Venice Fishing Pier Obstruction Lights (A), Bay Plaza at Bird Bay Village (B), Brickyard Plaza (C), Summit Plaza (D), Sarasota County Fire Department Station 21 (E), City of Venice Fire Department Station 51 (F), City of Venice Fire Department Station 52 (G), Ambitrans Ambulance and Wheelchair Service (H), Sarasota County Rescue Station 52 (I), Sarasota County Rescue Station 51 (J), Sarasota County Sheriff's Office South County Jail (K). Display/hide their locations on the map
In group quarters: 634 (-1 institutionalized population)
Size of family households: 4,277 2-persons, 517 3-persons, 259 4-persons, 139 5-persons, 24 6-persons, 33 7-or-more-persons
Size of nonfamily households: 4,835 1-person, 800 2-persons, 58 3-persons
465 married couples with children.
333 single-parent households (83 men, 250 women).
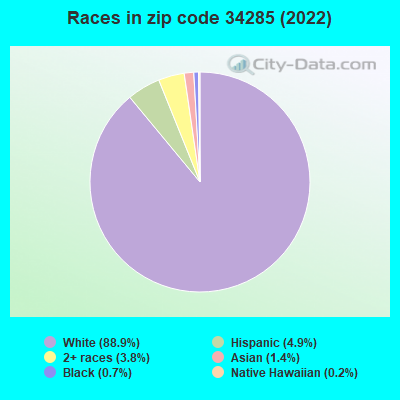
89.9% of residents of 34285 zip code speak English at home.
3.3% of residents speak Spanish at home (71% very well, 9% well, 20% not well).
6.6% of residents speak other Indo-European language at home (70% very well, 25% well, 5% not well).
1.1% of residents speak Asian or Pacific Island language at home (46% very well, 54% well).
0.3% of residents speak other language at home (100% very well).
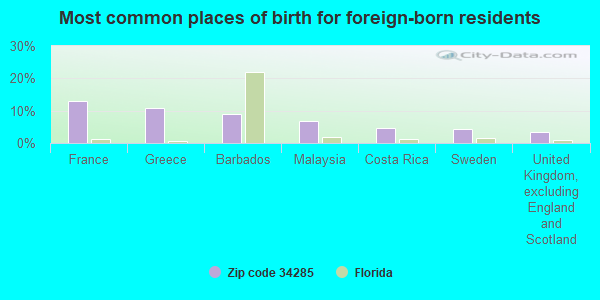
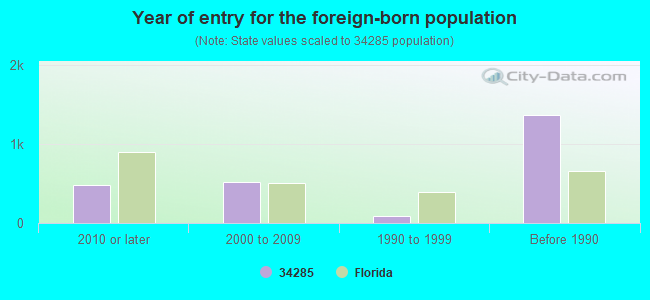
Foreign born population: 2,292 (11.9%) (58.2% of them are naturalized citizens)
Major facilities with environmental interests located in this zip code:
BON SECOURS VENICE HEALTHCARE CORP (540 THE RIALTO in VENICE, FL)
STATE MASTER (FDM) - CHAZ-FLD000459156, HAZARDOUS WASTE REGULATION PROGRAM (Resource Conservation and Recovery Act (tracking hazardous waste)) Business SIC classification: GENERAL MEDICAL AND SURGICAL HOSPITALS Organizations: BON SECOURS HEALTH SYSTEM INC (CONTACT/OWNER)
SPARTAN USA INC (109 SEABOARD AVE S in VENICE, FL)
STATE MASTER (FDM) - WAFR-FLR05G162, NPDES STORMWATER PROGRAM, NPDES STORMWATER PERMIT National Pollutant Discharge Elimination System NON-MAJOR (Tracking pollutant discharge elimination systems) - permit Business SIC classification: CONCRETE PRODUCTS, EXCEPT BLOCK AND BRICK; STEEL PIPE AND TUBES Organizations: WEST COAST ARCHITECTURAL PRE CAST (CONTACT/APPLICANT)
, DENNIS BENDER (CONTACT/OWNER)
GULF COAST MARINE INSTITUTE SOUTH-VENICE (220 BAHAMA STREET in VENICE, FL)
(National Center for Education Statistics) - STATE ID-0412 Organizations: SARASOTA COUNTY SCHOOL DISTRICT (SCHOOL DISTRICT)
ISLAND PARK CONDOMINIUMS (NE CORNER FIELD AVENUE & COOPE in VENICE, FL)
National Pollutant Discharge Elimination System NON-MAJOR (Tracking pollutant discharge elimination systems) - permit Organizations: PAUL SHERMA (CONTACT/OWNER)
PINEBROOK PRESERVE (CORNER EDMONSON ROAD AND PINEB in VENICE, FL)
National Pollutant Discharge Elimination System NON-MAJOR (Tracking pollutant discharge elimination systems) - permit Organizations: PAUL SHERMA (CONTACT/OWNER)
ABSOLUTE WINDOW & SHUTTER, INC (CENTER ROAD INDUSTRIAL PARK - in VENICE, FL)
National Pollutant Discharge Elimination System NON-MAJOR (Tracking pollutant discharge elimination systems) - permit Organizations: BRETT MORROW (CONTACT/OWNER)
GULF COAST ENDOSCOPY CENTER BU (1220 E VENICE AVE in VENICE, FL)
National Pollutant Discharge Elimination System NON-MAJOR (Tracking pollutant discharge elimination systems) - permit Organizations: JOSEPH MENEN (CONTACT/OWNER)
GULFWATER MARINE INC (215 S TAMIAMI TR in SARASOTA, FL)
(Resource Conservation and Recovery Act (tracking hazardous waste)) Business NAICS classification: BOAT BUILDING. Organizations: CLARK BALSINGER OWNER (CONTACT/OWNER)
KELLEY'S WAY CONDOMINIUM (225 PARK BLVD & 456 PALMETTO C in VENICE, FL)
National Pollutant Discharge Elimination System NON-MAJOR (Tracking pollutant discharge elimination systems) - permit Organizations: KEVIN WARD (CONTACT/OWNER)
KYMBERLY'S COURT (253 PARK BLVD in VENICE, FL)
National Pollutant Discharge Elimination System NON-MAJOR (Tracking pollutant discharge elimination systems) - permit Organizations: KEVIN WARD (CONTACT/OWNER)
LAUREL PARK NORTH COMMERCIAL (KNIGHTS TRL RD & LAUREL RD NE in VENICE, FL)
National Pollutant Discharge Elimination System NON-MAJOR (Tracking pollutant discharge elimination systems) - permit Organizations: PAUL SHERMA (CONTACT/OWNER)
MIAMI VALLEY CONCRETE COMPANY (500 GENE GREEN ROAD in VENICE, FL)
National Pollutant Discharge Elimination System NON-MAJOR (Tracking pollutant discharge elimination systems) - permit Business SIC classification: READY-MIXED CONCRETE Organizations: JOHN MCGOVERN (CONTACT/OWNER)
RIVERSIDE BANK (717 EAST VENICE AVENUE in VENICE, FL)
National Pollutant Discharge Elimination System NON-MAJOR (Tracking pollutant discharge elimination systems) - permit Organizations: PETER HOVLAND (CONTACT/OWNER)
Housing units lacking complete plumbing facilities: 0.1% Housing units lacking complete kitchen facilities: 2.6%
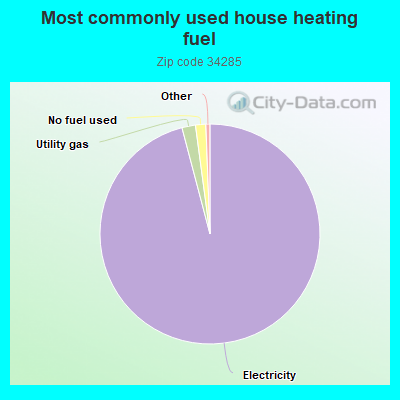
95.8%Electricity
2.0%Utility gas
1.5%No fuel used
Population in 1990: 9,069.
Place of birth for U.S.-born residents:
This state: 2,066
Northeast: 6,349
Midwest: 5,521
South: 2,054
West: 809
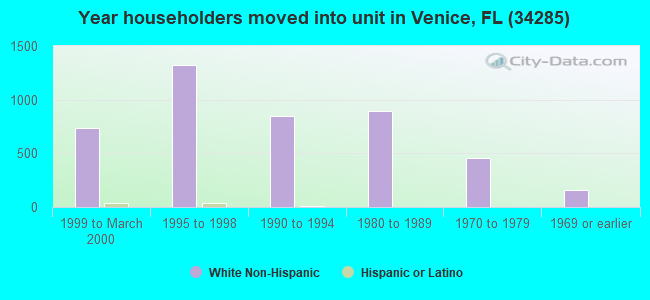
54% of the 34285 zip code residents lived in the same house 5 years ago. Out of people who lived in different houses, 41% lived in this county. Out of people who lived in different counties, 50% lived in Florida.
85% of the 34285 zip code residents lived in the same house 1 year ago. Out of people who lived in different houses, 30% moved from this county. Out of people who lived in different houses, 18% moved from different county within same state. Out of people who lived in different houses, 50% moved from different state. Out of people who lived in different houses, 6% moved from abroad.
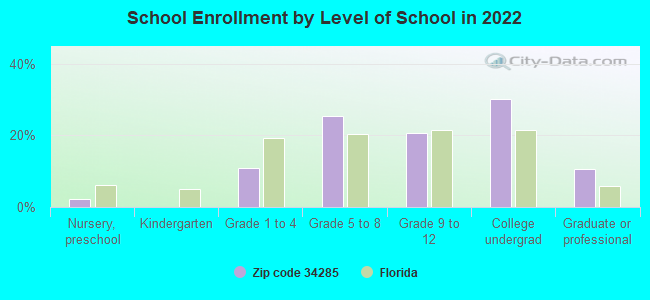
Private vs. public school enrollment:
Students in private schools in grades 1 to 8 (elementary and middle school): 156
Here:
34.6%
Florida:
15.8%
Students in private schools in grades 9 to 12 (high school):
Here:
0.0%
Florida:
12.9%
Students in private undergraduate colleges: 74
Here:
20.1%
Florida:
23.6%
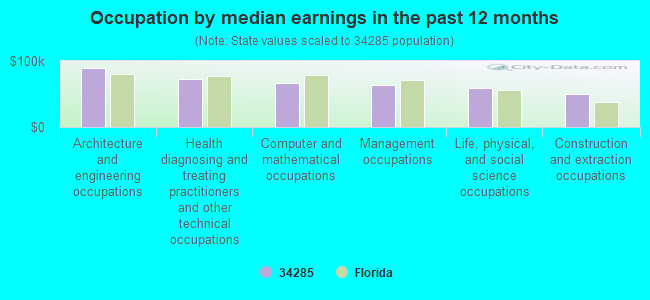
Occupation by median earnings in the past 12 months ($)
89,403Architecture and engineering occupations
72,426Health diagnosing and treating practitioners and other technical occupations
67,118Computer and mathematical occupations
64,350Management occupations
58,357Life, physical, and social science occupations
49,449Construction and extraction occupations
Companies with federal contracts located in this zip code:
EMCEE ELECTRONICS INC (520 CYPRESS AVE in VENICE, FL; small business) : $579,183 in 27 contractsfrom 2000 to 2006
Contracts for Physical Properties Testing and Inspection, Railroad Signal and Warning Devices, Chemical Analysis Instruments, Inspection Gages and Precision Layout Tools, and moreby Army, Air Force, Navy Signed by year:2000: $54,960; 2001: $27,500; 2002: $109,756; 2003: $8,995; 2004: $107,745; 2005: $181,127; 2006: $89,100.
Biggest contracts:
$90,300 with Army for Physical Properties Testing and Inspection. Signed on 2005-02-18. Completion date: 2005-03-06.
$89,100 with Army for Railroad Signal and Warning Devices. Signed on 2006-04-21. Completion date: 2006-06-16.
$34,800 with Air Force for Chemical Analysis Instruments. Signed on 2002-05-23. Completion date: 2002-08-31.
$30,900 with Army for Chemical Analysis Instruments. Signed on 2004-07-08. Completion date: 2004-07-30.
Top industries in this zip code by the number of employees in 2005:
Health Care and Social Assistance: General Medical and Surgical Hospitals (500-999 employees: 1 establishment)
2002 - 2018 National Fire Incident Reporting System (NFIRS) incidents
According to the data from the years 2002 - 2018 the average number of fires per year is 47. The highest number of fires - 82 took place in 2017, and the least - 29 in 2002. The data has a growing trend.
When looking into fire subcategories, the most reports belonged to: Outside Fires (58.8%), and Structure Fires (25.6%).
Fire incident types reported to NFIRS in Zip Code 34285


 Nearest zip codes: 34275, 34292, 34229, 34293, 34223, 34238.


 According to the data from the years 2002 - 2018 the average number of fires per year is 47. The highest number of fires - 82 took place in 2017, and the least - 29 in 2002. The data has a growing trend.
 When looking into fire subcategories, the most reports belonged to: Outside Fires (58.8%), and Structure Fires (25.6%).