Estimated zip code population in 2022: 16,889 Zip code population in 2010: 13,516 Zip code population in 2000: 17,443
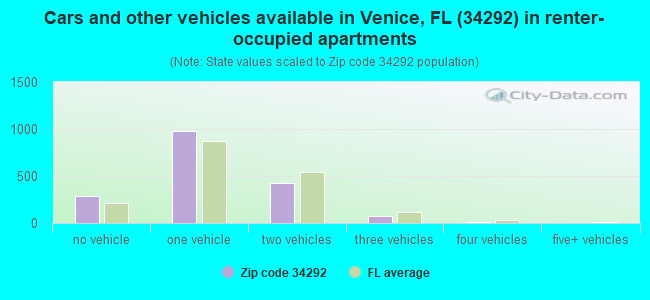
Houses and condos: 10,684 Renter-occupied apartments: 1,783
% of renters here:
21%
State:
33%
March 2022 cost of living index in zip code 34292: 96.8 (near average, U.S. average is 100)
Land area: 29.6 sq. mi. Water area: 1.4 sq. mi.
Population density: 570 people per square mile
(low).
OSM Map
General Map
Google Map
MSN Map
OSM Map
General Map
Google Map
MSN Map
OSM Map
General Map
Google Map
MSN Map
OSM Map
General Map
Google Map
MSN Map
Please wait while loading the map...
Real estate property taxes paid for housing units in 2022:
This zip code:
0.7% ($3,416)
Florida:
0.7% ($2,529)
Median real estate property taxes paid for housing units with mortgages in 2022: $3,625 (0.7%) Median real estate property taxes paid for housing units with no mortgage in 2022: $3,176 (0.7%)
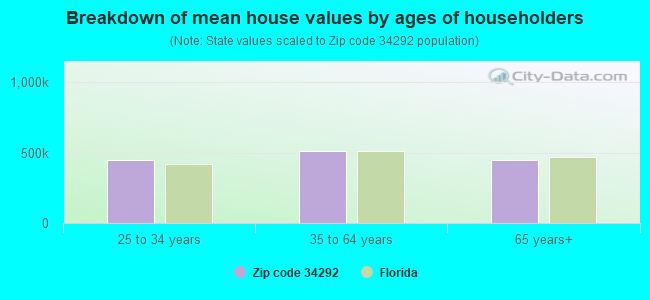
Estimated median house/condo value in 2022: $472,376
34292:
$472,376
Florida:
$354,100
According to our research of Florida and other state lists, there were 6 registered sex offenders living in 34292 zip code as of April 27, 2024. The ratio of all residents to sex offenders in zip code 34292 is 2,668 to 1. The ratio of registered sex offenders to all residents in this zip code is much lower than the state average.
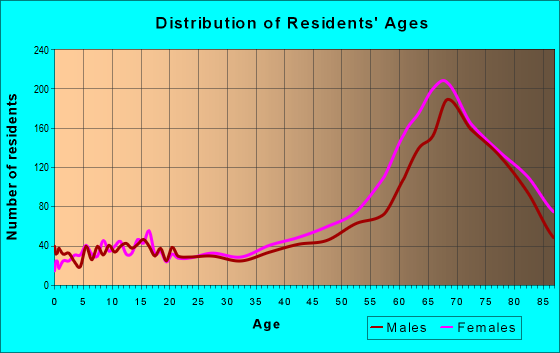
Median resident age:
This zip code:
69.3 years
Florida median age:
42.7 years
Average household size:
This zip code:
1.9 people
Florida:
2.5 people
Averages for the 2020 tax year for zip code 34292, filed in 2021:
Average Adjusted Gross Income (AGI) in 2020: $92,678 (Individual Income Tax Returns)
Here:
$92,678
State:
$82,200
Salary/wage: $59,603 (reported on 48.9% of returns)
Here:
$59,603
State:
$58,347
(% of AGI for various income ranges: 923.4% for AGIs below $25k, 2537.7% for AGIs $25k-50k, 3704.2% for AGIs $50k-75k, 4328.4% for AGIs $75k-100k, 8985.7% for AGIs $100k-200k, 47100.6% for AGIs over 200k)
Taxable interest for individuals: $2,871 (reported on 54.9% of returns)
This zip code:
$2,871
Florida:
$4,272
(% of AGI for various income ranges: 76.9% for AGIs below $25k, 95.4% for AGIs $25k-50k, 188.8% for AGIs $50k-75k, 297.5% for AGIs $75k-100k, 486.1% for AGIs $100k-200k, 2464.4% for AGIs over 200k)
Ordinary dividends: $11,939 (reported on 48.2% of returns)
Here:
$11,939
State:
$15,863
(% of AGI for various income ranges: 171.9% for AGIs below $25k, 268.8% for AGIs $25k-50k, 521.0% for AGIs $50k-75k, 809.8% for AGIs $75k-100k, 1780.2% for AGIs $100k-200k, 11700.0% for AGIs over 200k)
Net capital gain/loss in AGI: +$26,303 (reported on 43.8% of returns)
Here:
+$26,303
State:
+$62,983
(% of AGI for various income ranges: 28.4% for AGIs below $25k, 130.3% for AGIs $25k-50k, 370.3% for AGIs $50k-75k, 690.2% for AGIs $75k-100k, 1924.2% for AGIs $100k-200k, 42265.0% for AGIs over 200k)
Profit/loss from business: +$16,633 (reported on 12.8% of returns)
Here:
+$16,633
State:
+$9,719
(% of AGI for various income ranges: 131.7% for AGIs below $25k, 254.8% for AGIs $25k-50k, 168.8% for AGIs $50k-75k, 260.9% for AGIs $75k-100k, 611.3% for AGIs $100k-200k, 3418.3% for AGIs over 200k)
Taxable individual retirement arrangement distribution: $28,207 (reported on 32.7% of returns)
34292:
$28,207
Florida:
$24,823
(% of AGI for various income ranges: 244.3% for AGIs below $25k, 552.2% for AGIs $25k-50k, 1108.1% for AGIs $50k-75k, 1857.5% for AGIs $75k-100k, 3453.4% for AGIs $100k-200k, 12274.4% for AGIs over 200k)
Self-employed (Keogh) retirement plans: $21,820 (reported on 0.6% of returns)
34292:
$21,820
Florida:
$29,694
(% of AGI for various income ranges: 67.5% for AGIs $100k-200k, 250.0% for AGIs over 200k)
Total itemized deductions: $36,084 (reported on 10.4% of returns)
Here:
$36,084
State:
$45,393
(% of AGI for various income ranges: 146.7% for AGIs below $25k, 321.0% for AGIs $25k-50k, 531.6% for AGIs $50k-75k, 723.8% for AGIs $75k-100k, 1075.5% for AGIs $100k-200k, 5699.4% for AGIs over 200k)
Charity contributions: $9,316 (reported on 9.1% of returns)
Here:
$9,316
State:
$20,178
(% of AGI for various income ranges: 7.5% for AGIs below $25k, 19.0% for AGIs $25k-50k, 75.9% for AGIs $50k-75k, 115.8% for AGIs $75k-100k, 194.6% for AGIs $100k-200k, 2340.0% for AGIs over 200k)
Taxes paid: $6,529 (reported on 10.4% of returns)
34292:
$6,529
State:
$6,967
(% of AGI for various income ranges: 21.8% for AGIs below $25k, 46.9% for AGIs $25k-50k, 87.3% for AGIs $50k-75k, 126.4% for AGIs $75k-100k, 231.1% for AGIs $100k-200k, 987.8% for AGIs over 200k)
Earned income credit: $1,709 (reported on 5.2% of returns)
Here:
$1,709
State:
$2,306
(% of AGI for various income ranges: 36.1% for AGIs below $25k, 31.5% for AGIs $25k-50k)
Percentage of individuals using paid preparers for their 2020 taxes: 91.7%
Here:
92%
State:
92%
(% for various income ranges: 90.2% for AGIs below $25k, 92.8% for AGIs $25k-50k, 91.5% for AGIs $50k-75k, 90.2% for AGIs $75k-100k, 92.6% for AGIs $100k-200k, 93.2% for AGIs over 200k)
Averages for the 2012 tax year for zip code 34292, filed in 2013:
Average Adjusted Gross Income (AGI) in 2012: $74,307 (Individual Income Tax Returns)
Here:
$74,307
State:
$60,316
Salary/wage: $48,896 (reported on 51.3% of returns)
Here:
$48,896
State:
$45,277
(% of AGI for various income ranges: 44.6% for AGIs below $25k, 42.1% for AGIs $25k-50k, 33.4% for AGIs $50k-75k, 29.9% for AGIs $75k-100k, 29.9% for AGIs $100k-200k, 35.8% for AGIs over 200k)
Taxable interest for individuals: $3,055 (reported on 60.5% of returns)
This zip code:
$3,055
Florida:
$3,587
(% of AGI for various income ranges: 4.5% for AGIs below $25k, 2.9% for AGIs $25k-50k, 2.8% for AGIs $50k-75k, 2.0% for AGIs $75k-100k, 2.0% for AGIs $100k-200k, 2.6% for AGIs over 200k)
Ordinary dividends: $10,014 (reported on 49.4% of returns)
Here:
$10,014
State:
$12,831
(% of AGI for various income ranges: 9.6% for AGIs below $25k, 6.2% for AGIs $25k-50k, 5.2% for AGIs $50k-75k, 5.2% for AGIs $75k-100k, 6.4% for AGIs $100k-200k, 8.2% for AGIs over 200k)
Net capital gain/loss in AGI: +$7,863 (reported on 44.6% of returns)
Here:
+$7,863
State:
+$33,493
(% of AGI for various income ranges: 1.5% for AGIs $50k-75k, 2.1% for AGIs $75k-100k, 3.1% for AGIs $100k-200k, 12.9% for AGIs over 200k)
Profit/loss from business: +$13,840 (reported on 12.6% of returns)
Here:
+$13,840
State:
+$10,012
(% of AGI for various income ranges: 5.6% for AGIs below $25k, 2.5% for AGIs $25k-50k, 1.9% for AGIs $50k-75k, 1.9% for AGIs $75k-100k, 1.9% for AGIs $100k-200k, 2.7% for AGIs over 200k)
Taxable individual retirement arrangement distribution: $23,529 (reported on 39.1% of returns)
34292:
$23,529
Florida:
$21,544
(% of AGI for various income ranges: 12.5% for AGIs below $25k, 10.5% for AGIs $25k-50k, 11.0% for AGIs $50k-75k, 13.1% for AGIs $75k-100k, 14.3% for AGIs $100k-200k, 10.8% for AGIs over 200k)
Self-employment retirement plans: $20,675 (reported on 0.6% of returns)
34292:
$20,675
Florida:
$20,611
Total itemized deductions: $24,181 (21% of AGI, reported on 41.0% of returns)
Here:
$24,181
State:
$25,533
Here:
21.5% of AGI
State:
18.0% of AGI
(% of AGI for various income ranges: 20.3% for AGIs below $25k, 16.5% for AGIs $25k-50k, 15.5% for AGIs $50k-75k, 14.3% for AGIs $75k-100k, 12.9% for AGIs $100k-200k, 9.8% for AGIs over 200k)
Charity contributions: $4,274 (reported on 36.5% of returns)
Here:
$4,274
State:
$5,698
(% of AGI for various income ranges: 1.6% for AGIs below $25k, 1.8% for AGIs $25k-50k, 1.8% for AGIs $50k-75k, 2.1% for AGIs $75k-100k, 2.0% for AGIs $100k-200k, 2.5% for AGIs over 200k)
Taxes paid: $6,641 (reported on 40.3% of returns)
34292:
$6,641
State:
$6,203
(% of AGI for various income ranges: 3.6% for AGIs below $25k, 3.3% for AGIs $25k-50k, 3.4% for AGIs $50k-75k, 3.2% for AGIs $75k-100k, 3.9% for AGIs $100k-200k, 3.7% for AGIs over 200k)
Earned income credit: $1,639 (reported on 6.5% of returns)
Here:
$1,639
State:
$2,372
(% of AGI for various income ranges: 2.2% for AGIs below $25k, 0.4% for AGIs $25k-50k)
Percentage of individuals using paid preparers for their 2012 taxes: 57.7%
Here:
58%
State:
54%
(% for various income ranges: 48.8% for AGIs below $25k, 54.7% for AGIs $25k-50k, 62.0% for AGIs $50k-75k, 61.1% for AGIs $75k-100k, 64.3% for AGIs $100k-200k, 75.0% for AGIs over 200k)
Averages for the 2004 tax year for zip code 34292, filed in 2005:
Average Adjusted Gross Income (AGI) in 2004: $64,799 (Individual Income Tax Returns)
Here:
$64,799
State:
$50,523
Salary/wage: $40,523 (reported on 51.3% of returns)
Here:
$40,523
State:
$39,563
(% of AGI for various income ranges: 80.0% for AGIs below $10k, 38.9% for AGIs $10k-25k, 36.6% for AGIs $25k-50k, 28.9% for AGIs $50k-75k, 28.8% for AGIs $75k-100k, 31.4% for AGIs over 100k)
Taxable interest for individuals: $4,422 (reported on 74.6% of returns)
This zip code:
$4,422
Florida:
$3,211
(% of AGI for various income ranges: 21.9% for AGIs below $10k, 8.5% for AGIs $10k-25k, 6.2% for AGIs $25k-50k, 5.1% for AGIs $50k-75k, 4.3% for AGIs $75k-100k, 4.4% for AGIs over 100k)
Taxable dividends: $6,404 (reported on 58.0% of returns)
Here:
$6,404
State:
$6,129
(% of AGI for various income ranges: 25.8% for AGIs below $10k, 8.6% for AGIs $10k-25k, 6.1% for AGIs $25k-50k, 5.6% for AGIs $50k-75k, 5.6% for AGIs $75k-100k, 5.1% for AGIs over 100k)
Net capital gain/loss: +$15,127 (reported on 51.1% of returns)
Here:
+$15,127
State:
+$27,205
(% of AGI for various income ranges: -13.7% for AGIs below $10k, -0.9% for AGIs $10k-25k, 1.5% for AGIs $25k-50k, 2.9% for AGIs $50k-75k, 4.9% for AGIs $75k-100k, 21.0% for AGIs over 100k)
Profit/loss from business: +$16,184 (reported on 12.3% of returns)
Here:
+$16,184
State:
+$10,634
(% of AGI for various income ranges: 4.6% for AGIs below $10k, 4.0% for AGIs $10k-25k, 2.4% for AGIs $25k-50k, 1.9% for AGIs $50k-75k, 2.2% for AGIs $75k-100k, 3.7% for AGIs over 100k)
IRA payment deduction: $3,784 (reported on 3.1% of returns)
34292:
$3,784
Florida:
$3,082
(% of AGI for various income ranges: 0.3% for AGIs $10k-25k, 0.2% for AGIs $25k-50k, 0.2% for AGIs $50k-75k, 0.3% for AGIs $75k-100k, 0.1% for AGIs over 100k)
Self-employed pension: $24,897 (reported on 0.7% of returns)
Here:
$24,897
Florida:
$15,857
Total itemized deductions: $21,442 (22% of AGI, reported on 42.9% of returns)
Here:
$21,442
State:
$20,370
Here:
22.0% of AGI
State:
20.7% of AGI
(% of AGI for various income ranges: 57.8% for AGIs below $10k, 22.6% for AGIs $10k-25k, 18.3% for AGIs $25k-50k, 15.9% for AGIs $50k-75k, 15.7% for AGIs $75k-100k, 10.7% for AGIs over 100k)
Charity contributions deductions: $4,430 (4% of AGI, reported on 38.9% of returns)
Here:
$4,430
State:
$4,064
Here:
4.4% of AGI
State:
3.8% of AGI
(% of AGI for various income ranges: 3.1% for AGIs below $10k, 1.6% for AGIs $10k-25k, 2.2% for AGIs $25k-50k, 2.1% for AGIs $50k-75k, 2.2% for AGIs $75k-100k, 3.2% for AGIs over 100k)
Total tax: $10,870 (reported on 82.2% of returns)
34292:
$10,870
State:
$9,431
(% of AGI for various income ranges: 3.9% for AGIs below $10k, 3.8% for AGIs $10k-25k, 7.0% for AGIs $25k-50k, 9.1% for AGIs $50k-75k, 10.7% for AGIs $75k-100k, 19.0% for AGIs over 100k)
Earned income credit: $1,254 (reported on 4.3% of returns)
Here:
$1,254
State:
$1,808
Percentage of individuals using paid preparers for their 2004 taxes: 61.2%
Here:
61%
State:
60%
(% for various income ranges: 58.3% for AGIs below $10k, 56.4% for AGIs $10k-25k, 60.2% for AGIs $25k-50k, 61.9% for AGIs $50k-75k, 61.0% for AGIs $75k-100k, 71.8% for AGIs over 100k)
Likely homosexual households (counted as self-reported same-sex unmarried-partner households)
Lesbian couples: 0.1% of all households
Gay men: 0.0% of all households
Household received Food Stamps/SNAP in the past 12 months: 276 Household did not receive Food Stamps/SNAP in the past 12 months: 8,456
Women who had a birth in the past 12 months: 37 (39 now married, 0 unmarried) Women who did not have a birth in the past 12 months: 1,461 (662 now married, 798 unmarried)
Housing units in zip code 34292 with a mortgage: 2,816 (216 second mortgage, 218 both second mortgage and home equity loan) Houses without a mortgage: 123
Median monthly owner costs for units with a mortgage: $1,890 Median monthly owner costs for units without a mortgage: $690
Residents with income below the poverty level in 2022:
This zip code:
5.5%
Whole state:
12.7%
Residents with income below 50% of the poverty level in 2022:
This zip code:
3.0%
Whole state:
6.6%
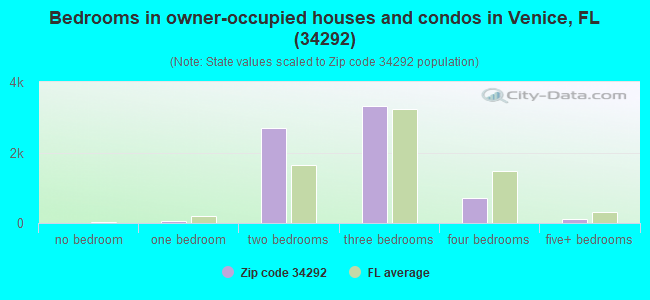
Median number of rooms in houses and condos:
Here:
5.8
State:
5.9
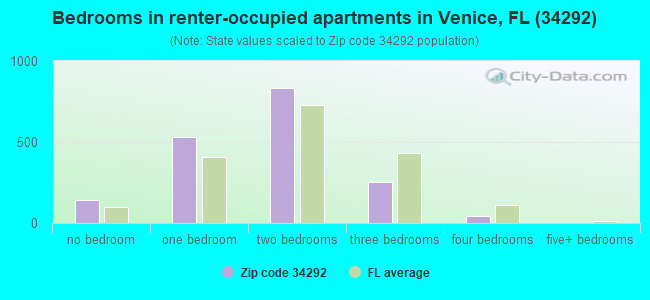
Median number of rooms in apartments:
Here:
3.8
State:
4.2
Notable locations in this zip code not listed on our city pages
In group quarters: 425 (-1 institutionalized population)
Size of family households: 4,497 2-persons, 628 3-persons, 287 4-persons, 42 5-persons, 49 6-persons, 48 7-or-more-persons
Size of nonfamily households: 2,583 1-person, 533 2-persons, 17 4-persons
842 married couples with children.
264 single-parent households (42 men, 222 women).
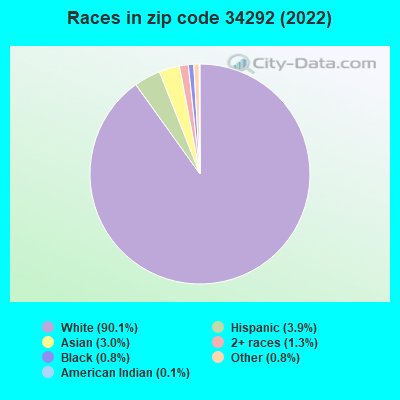
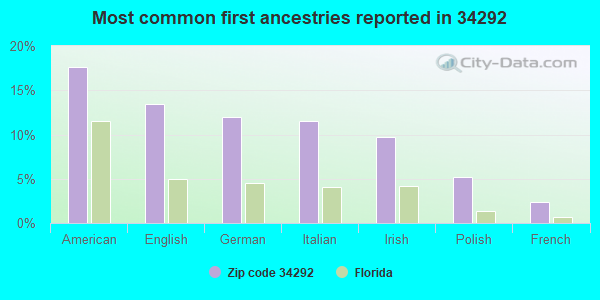
91.5% of residents of 34292 zip code speak English at home.
3.3% of residents speak Spanish at home (90% very well, 6% well, 1% not well, 3% not at all).
3.2% of residents speak other Indo-European language at home (74% very well, 24% well, 2% not well).
2.7% of residents speak Asian or Pacific Island language at home (38% very well, 13% well, 50% not well).
0.4% of residents speak other language at home (29% very well, 71% well).
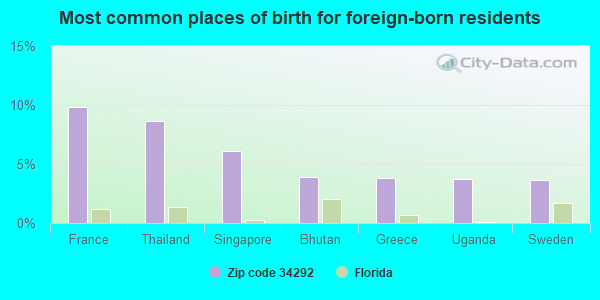
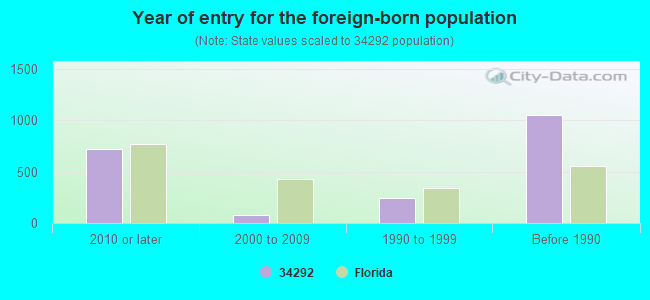
Foreign born population: 1,787 (10.6%) (70.7% of them are naturalized citizens)
Major facilities with environmental interests located in this zip code:
HANSON PIPE & PRODUCTS INC VENICE (99 W CENTER RD in VENICE, FL)
(Integrated Compliance Information System) - ICIS-, ENFORCEMENT/COMPLIANCE ACTIVITY, ICIS-04-2005-9937, FORMAL ENFORCEMENT ACTION (Integrated Compliance Information System) - ICIS-, ENFORCEMENT/COMPLIANCE ACTIVITY, ICIS-04-2005-9937, National Pollutant Discharge Elimination System NON-MAJOR (Tracking pollutant discharge elimination systems) - permit TRI REPORTER (Tracking of toxic chemicals releasing facilities) Business SIC classification: CONCRETE PRODUCTS, EXCEPT BLOCK AND BRICK Organizations: GREG DAUGHERTY (CONTACT/OWNER)
Alternative names: HPP VENICE
CLARK S CITGO (213 VENICE BYPASS(US 41- BYPAS in VENICE, FL)
STATE MASTER (FDM) - WAFR-FLG910324, INDUSTRIAL WASTEWATER PROGRAM, WAFR-FLG911540, National Pollutant Discharge Elimination System NON-MAJOR (Tracking pollutant discharge elimination systems) - permit Business SIC classification: GASOLINE SERVICE STATIONS Organizations: BUREAU OF PETROLEUM STORAGE SYSTEMS, ARCADIS GERAGHTY & MILLER, GEOSOLUTIONS INC., ATOFINA PETROCHEMICALS (CONTACT/APPLICANT)
, CHRIS ITIN (CONTACT/OWNER)
, GEOSOLUTIONS INC. (CONTACT/PERMIT)
, ARCADIS G&M, INC. (ENGINEER)
Alternative names: CLARK'S CITGO[FORMER FINA SERV, CLARK'S CITGO[FORMER FINA SERV, CLARK'S CITGO[FORMER FINA SERV, FINA STATION #7094
CRANE ENVIRONMENTAL (730 COMMERCE DR in VENICE, FL)
STATE MASTER (FDM) - WAFR-FLRNEE258, NPDES STORMWATER PROGRAM, NPDES STORMWATER PERMIT (Resource Conservation and Recovery Act (tracking hazardous waste)) Business SIC classification: SERVICE INDUSTRY MACHINERY Organizations: CRANE ENVITOMENTAL (CONTACT/APPLICANT)
, EP DEVELOPMENT CORP (CONTACT/OWNER)
Alternative names: CRANE ENVIROMENTAL, ENVIRONMENTAL PRODUCTS USA INC, ENVIRONMENTAL PRODUCTS USA INC
GLASPRO INC (101 POND CYPRESS RD in VENICE, FL)
AIR SYNTHETIC MINOR (AIRS/AFS) CRITERIA AND HAZARDOUS AIR POLLUTANT INVENTORY (Inventory of air pollution sources) National Pollutant Discharge Elimination System NON-MAJOR (Tracking pollutant discharge elimination systems) - permit (Resource Conservation and Recovery Act (tracking hazardous waste)) TRI REPORTER (Tracking of toxic chemicals releasing facilities) Business SIC classification: BOAT BUILDING AND REPAIRING; SPORTING AND ATHLETIC GOODS; MANUFACTURING INDUSTRIES Organizations: BOB SMETTS (CONTACT/OWNER)
Alternative names: ROBERT H. SMETTS
ISLAND VILLAGE MONTESSORI SCHOOL (2001 PINEBROOK ROAD in VENICE, FL)
(National Center for Education Statistics) - STATE ID-0090 Organizations: SARASOTA COUNTY SCHOOL DISTRICT (SCHOOL DISTRICT)
JELD-WEN WINDOW DIV (355 CENTER CT in VENICE, FL)
National Pollutant Discharge Elimination System NON-MAJOR (Tracking pollutant discharge elimination systems) - permit TRI REPORTER (Tracking of toxic chemicals releasing facilities) Business SIC classification: PLASTICS PRODUCTS; METAL DOORS, SASH, FRAMES, MOLDING, AND TRIM Organizations: JOHN TRACY (CONTACT/OWNER)
SOUTH COUNTY YMCA WELLNESS BUI (701 CENTER RD in VENICE, FL)
National Pollutant Discharge Elimination System NON-MAJOR (Tracking pollutant discharge elimination systems) - permit Organizations: PAUL SHERMA (CONTACT/OWNER)
Alternative names: ISLAMIC SOCIETY OF SARASOTA AN, SOTH COUNTY YMCA YOUTH CENTER
SOTHERN SPRING & STAMPING, INC (401 SUB STATION ROAD in VENICE, FL)
National Pollutant Discharge Elimination System NON-MAJOR (Tracking pollutant discharge elimination systems) - permit Organizations: JACK COX (CONTACT/OWNER)
Alternative names: BLAKE MEDICAL CENTER PHASE 2A
National Pollutant Discharge Elimination System NON-MAJOR (Tracking pollutant discharge elimination systems) - permit Organizations: PAUL SHERMA (CONTACT/OWNER)
SAWGRASS (769 SAWGRASS BRIDGE RD AND OTH in VENICE, FL)
National Pollutant Discharge Elimination System NON-MAJOR (Tracking pollutant discharge elimination systems) - permit Organizations: ROBERT MELSOM (CONTACT/OWNER)
Alternative names: COCHRANE FURNITURE CO INC
National Pollutant Discharge Elimination System NON-MAJOR (Tracking pollutant discharge elimination systems) - permit Organizations: PAUL SHERMA (CONTACT/OWNER)
LOTS 11 & 12 AT JCC (COMMERCIAL COURT in VENICE, FL)
National Pollutant Discharge Elimination System NON-MAJOR (Tracking pollutant discharge elimination systems) - permit Organizations: PAUL SHERMA (CONTACT/OWNER)
SARASOTA COUNTY INTERSTATE BUS (770 COMMERCE DR in VENICE, FL)
National Pollutant Discharge Elimination System NON-MAJOR (Tracking pollutant discharge elimination systems) - permit Organizations: DAVID TAYLOR (CONTACT/OWNER)
Housing units lacking complete kitchen facilities: 3.6%
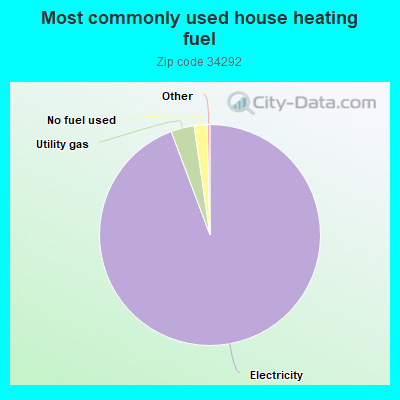
94.3%Electricity
3.4%Utility gas
1.9%No fuel used
Population in 1990: 13,901. Population change in the 1990s: +3,542 (+25.5%).
Place of birth for U.S.-born residents:
This state: 1,810
Northeast: 5,968
Midwest: 5,219
South: 1,376
West: 443
53% of the 34292 zip code residents lived in the same house 5 years ago. Out of people who lived in different houses, 39% lived in this county. Out of people who lived in different counties, 50% lived in Florida.
85% of the 34292 zip code residents lived in the same house 1 year ago. Out of people who lived in different houses, 38% moved from this county. Out of people who lived in different houses, 13% moved from different county within same state. Out of people who lived in different houses, 47% moved from different state. Out of people who lived in different houses, 3% moved from abroad.
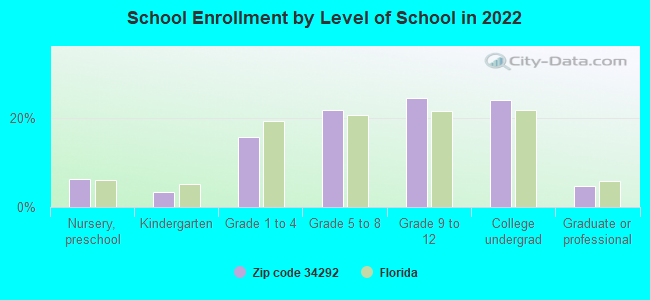
Private vs. public school enrollment:
Students in private schools in grades 1 to 8 (elementary and middle school): 158
Here:
24.5%
Florida:
15.8%
Students in private schools in grades 9 to 12 (high school): 27
Here:
6.5%
Florida:
12.9%
Students in private undergraduate colleges: 80
Here:
19.7%
Florida:
23.6%
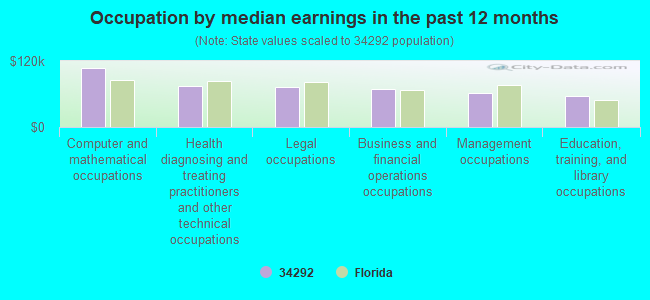
Occupation by median earnings in the past 12 months ($)
107,224Computer and mathematical occupations
74,717Health diagnosing and treating practitioners and other technical occupations
72,455Legal occupations
69,650Business and financial operations occupations
62,051Management occupations
56,984Education, training, and library occupations
Companies with federal contracts located in this zip code (VENICE, FL):
COAST TO COAST AEROSPACE, LLC (752 COMMERCE DRIVE; small business) : $744,658 in 38 contractsfrom 2003 to 2006
Contracts for Switches, Relays and Solenoids, Guns, 75 mm through 125 mm, Liquid and Gas Flow, Liquid Level, and Mechanical Motion Measuring Instruments, and moreby Defense Logistics Agency, Army Signed by year:2000: $0; 2001: $0; 2002: $0; 2003: $85,231; 2004: $159,519; 2005: $363,363; 2006: $136,545.
Biggest contracts:
$93,788 with Defense Logistics Agency for Switches. Signed on 2005-02-20. Completion date: 2005-07-20.
$83,034, same as above.Signed on 2005-01-07. Completion date: 2005-11-09.
$71,100 with Defense Logistics Agency for Switches. Taking place in CA. Signed on 2004-03-16. Completion date: 2004-10-12.
$42,405, same as above.Signed on 2003-11-10. Completion date: 2004-05-08.
PAN WORLD RESOURCES CORPORATIO (401 COMMERCIAL CT, STE G; small business) : $735,700 in 18 contractsfrom 1999 to 2005
Contracts for Orthopedic Services, Operation of Government-Owned Facilities -- Miscellaneous Buildings, Nursing Services by Army, Public Health Service, United States Coast Guard (disused code: now 7008), U.S. Coast Guard, and others Signed by year:2000: $89,000; 2001: $77,000; 2002: $178,084; 2003: $74,576; 2004: $44,880; 2005: $199,160; 2006: $0.
Biggest contracts:
$110,240 with Army for Orthopedic Services. Taking place in DC. Signed on 2005-10-25. Completion date: 2004-09-30.
$92,000, same as above.Signed on 2002-10-30. Completion date: 2002-09-30.
$89,000 with Public Health Service for Operation of Government-Owned Facilities -- Miscellaneous Buildings. Taking place in SD. Signed on 2000-01-15. Completion date: 2001-01-15.
$88,920 with Army for Orthopedic Services. Taking place in DC. Signed on 2005-01-04. Completion date: 2004-09-30.
EASTERN MICROWAVE CORP (530 U S HIGHWAY 41 BYPASS; small business) : $139,347 in 9 contractsfrom 1999 to 2002
Contracts for Switches, Antennas, Waveguides, and Related Equipment by Navy, Defense Logistics Agency Signed by year:2000: $57,560; 2001: $149,043; 2002: -$226,208; 2003: $0; 2004: $0; 2005: $0; 2006: $0.
Biggest contracts:
$98,553 with Navy for Switches. Taking place in MA. Signed on 2001-10-10. Completion date: 2001-10-18.
$81,696 with Defense Logistics Agency for Antennas, Waveguides, and Related Equipment. Taking place in MA. Signed on 1999-10-25. Completion date: 2000-03-23.
$77,256, same as above.Signed on 1999-12-10. Completion date: 2000-11-04.
$74,222 with Defense Logistics Agency for Antennas, Waveguides, and Related Equipment. Signed on 2002-03-22. Completion date: 2002-10-15.
FUTLUZ LTD (104 GRAND OAK CIRCLE; small business) : $123,400 in 4 contractsfrom 2001 to 2002
$43,506 with Army for Other Education and Training Services. Taking place in VA. Signed on 2001-10-01. Completion date: 2002-09-30.
$36,900 with Army for Education Services. Taking place in VA. Signed on 2002-11-20. Completion date: 2003-09-30.
$26,994 with Army for Other Education and Training Services. Taking place in VA. Signed on 2002-08-07. Completion date: 2002-09-30.
$16,000, same as above.Signed on 2002-02-28. Completion date: 2002-09-30.
COAST TO COAST AEROSPACE LLC (752 COMMCRCE DRIVE STE9; small business)
$12,770 with Defense Logistics Agency for Relays and Solenoids. Signed on 2005-04-22. Completion date: 2005-11-21.
INTERNATIONAL CONNECTOR INC (119 CORPORATION WAY UNIT D; small business)
$656 with Department of Defense for Connectors, Electrical. Signed on 2003-02-25. Completion date: 2003-03-24.
Top industries in this zip code by the number of employees in 2005:
Health Care and Social Assistance: Nursing Care Facilities (100-249 employees: 4 establishments, 1-4 employees: 2 establishments)
2002 - 2018 National Fire Incident Reporting System (NFIRS) incidents
According to the data from the years 2002 - 2018 the average number of fires per year is 48. The highest number of fires - 63 took place in 2009, and the least - 22 in 2004. The data has a dropping trend.
When looking into fire subcategories, the most reports belonged to: Outside Fires (55.7%), and Mobile Property/Vehicle Fires (22.1%).
Fire incident types reported to NFIRS in Zip Code 34292


 Nearest zip codes: 34293, 34275, 34285, 34291, 34287, 34223.
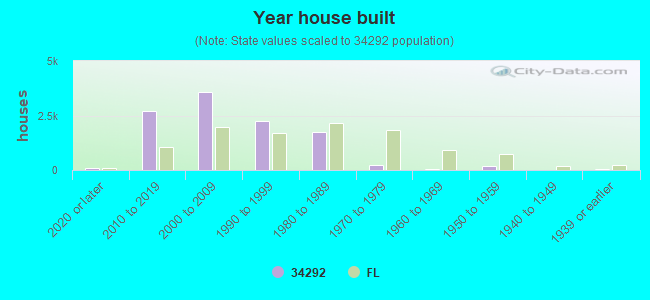


 According to the data from the years 2002 - 2018 the average number of fires per year is 48. The highest number of fires - 63 took place in 2009, and the least - 22 in 2004. The data has a dropping trend.
 When looking into fire subcategories, the most reports belonged to: Outside Fires (55.7%), and Mobile Property/Vehicle Fires (22.1%).