Estimated zip code population in 2022: 16,048 Zip code population in 2010: 13,590 Zip code population in 2000: 12,106
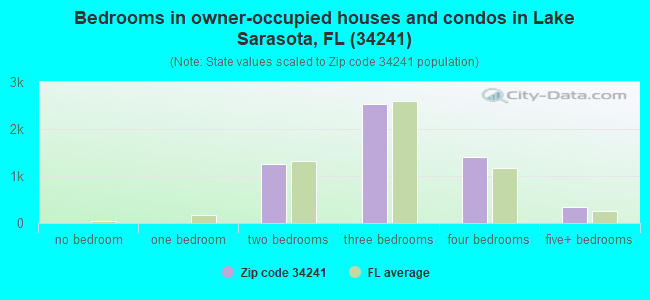
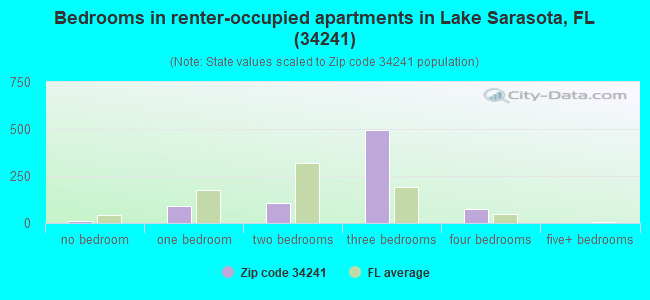
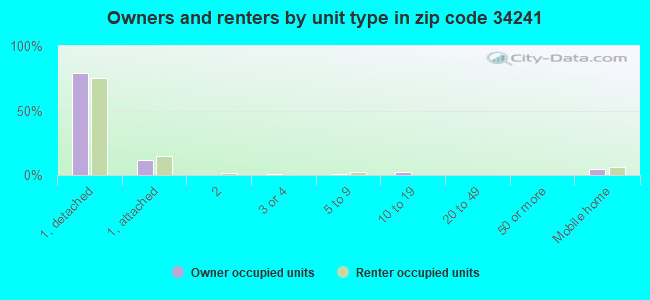
Houses and condos: 6,970 Renter-occupied apartments: 795
% of renters here:
13%
State:
33%
March 2022 cost of living index in zip code 34241: 96.1 (near average, U.S. average is 100)
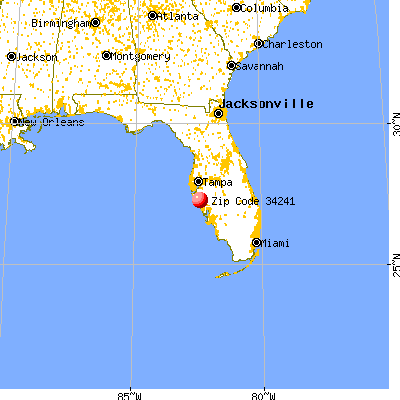
Land area: 68.7 sq. mi. Water area: 2.8 sq. mi.
Population density: 234 people per square mile
(very low).
OSM Map
General Map
Google Map
MSN Map
OSM Map
General Map
Google Map
MSN Map
OSM Map
General Map
Google Map
MSN Map
OSM Map
General Map
Google Map
MSN Map
Please wait while loading the map...
Real estate property taxes paid for housing units in 2022:
This zip code:
0.6% ($3,605)
Florida:
0.7% ($2,529)
Median real estate property taxes paid for housing units with mortgages in 2022: $3,453 (0.6%) Median real estate property taxes paid for housing units with no mortgage in 2022: $3,796 (0.8%)
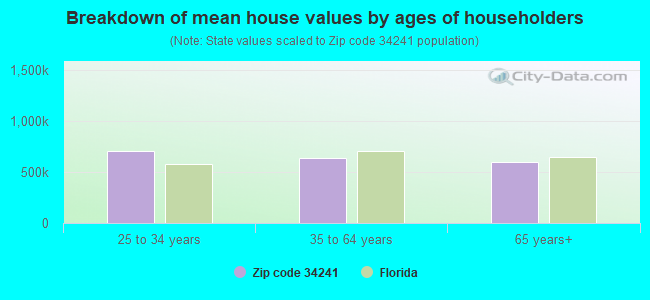
Estimated median house/condo value in 2022: $559,386
34241:
$559,386
Florida:
$354,100
According to our research of Florida and other state lists, there were 9 registered sex offenders living in 34241 zip code as of April 27, 2024. The ratio of all residents to sex offenders in zip code 34241 is 1,586 to 1. The ratio of registered sex offenders to all residents in this zip code is much lower than the state average.
Median resident age:
This zip code:
51.6 years
Florida median age:
42.7 years
Average household size:
This zip code:
2.6 people
Florida:
2.5 people
Averages for the 2020 tax year for zip code 34241, filed in 2021:
Average Adjusted Gross Income (AGI) in 2020: $119,445 (Individual Income Tax Returns)
Here:
$119,445
State:
$82,200
Salary/wage: $80,548 (reported on 71.6% of returns)
Here:
$80,548
State:
$58,347
(% of AGI for various income ranges: 1145.0% for AGIs below $25k, 3563.8% for AGIs $25k-50k, 6553.4% for AGIs $50k-75k, 8600.2% for AGIs $75k-100k, 16208.6% for AGIs $100k-200k, 79098.5% for AGIs over 200k)
Taxable interest for individuals: $3,611 (reported on 41.8% of returns)
This zip code:
$3,611
Florida:
$4,272
(% of AGI for various income ranges: 37.7% for AGIs below $25k, 56.2% for AGIs $25k-50k, 116.8% for AGIs $50k-75k, 218.6% for AGIs $75k-100k, 369.5% for AGIs $100k-200k, 2464.2% for AGIs over 200k)
Ordinary dividends: $14,798 (reported on 36.7% of returns)
Here:
$14,798
State:
$15,863
(% of AGI for various income ranges: 104.4% for AGIs below $25k, 130.6% for AGIs $25k-50k, 353.1% for AGIs $50k-75k, 510.5% for AGIs $75k-100k, 1193.4% for AGIs $100k-200k, 10284.6% for AGIs over 200k)
Net capital gain/loss in AGI: +$40,635 (reported on 35.0% of returns)
Here:
+$40,635
State:
+$62,983
(% of AGI for various income ranges: 30.2% for AGIs below $25k, 120.6% for AGIs $25k-50k, 296.8% for AGIs $50k-75k, 391.0% for AGIs $75k-100k, 1497.7% for AGIs $100k-200k, 36626.9% for AGIs over 200k)
Profit/loss from business: +$22,250 (reported on 19.7% of returns)
Here:
+$22,250
State:
+$9,719
(% of AGI for various income ranges: 200.5% for AGIs below $25k, 318.3% for AGIs $25k-50k, 304.9% for AGIs $50k-75k, 448.1% for AGIs $75k-100k, 1014.5% for AGIs $100k-200k, 6631.2% for AGIs over 200k)
Taxable individual retirement arrangement distribution: $30,690 (reported on 16.6% of returns)
34241:
$30,690
Florida:
$24,823
(% of AGI for various income ranges: 123.7% for AGIs below $25k, 206.0% for AGIs $25k-50k, 483.4% for AGIs $50k-75k, 871.2% for AGIs $75k-100k, 2087.7% for AGIs $100k-200k, 5475.8% for AGIs over 200k)
Self-employed (Keogh) retirement plans: $25,144 (reported on 1.1% of returns)
34241:
$25,144
Florida:
$29,694
(% of AGI for various income ranges: 81.5% for AGIs $100k-200k, 638.5% for AGIs over 200k)
Total itemized deductions: $47,519 (reported on 13.4% of returns)
Here:
$47,519
State:
$45,393
(% of AGI for various income ranges: 112.2% for AGIs below $25k, 265.8% for AGIs $25k-50k, 526.1% for AGIs $50k-75k, 545.2% for AGIs $75k-100k, 1348.6% for AGIs $100k-200k, 11670.4% for AGIs over 200k)
Charity contributions: $12,109 (reported on 11.5% of returns)
Here:
$12,109
State:
$20,178
(% of AGI for various income ranges: 6.7% for AGIs below $25k, 34.5% for AGIs $25k-50k, 57.5% for AGIs $50k-75k, 69.8% for AGIs $75k-100k, 275.0% for AGIs $100k-200k, 2995.0% for AGIs over 200k)
Taxes paid: $7,211 (reported on 13.4% of returns)
34241:
$7,211
State:
$6,967
(% of AGI for various income ranges: 18.4% for AGIs below $25k, 45.4% for AGIs $25k-50k, 98.8% for AGIs $50k-75k, 121.7% for AGIs $75k-100k, 286.1% for AGIs $100k-200k, 1406.5% for AGIs over 200k)
Earned income credit: $1,938 (reported on 8.4% of returns)
Here:
$1,938
State:
$2,306
(% of AGI for various income ranges: 56.8% for AGIs below $25k, 54.1% for AGIs $25k-50k)
Percentage of individuals using paid preparers for their 2020 taxes: 92.3%
Here:
92%
State:
92%
(% for various income ranges: 90.6% for AGIs below $25k, 92.6% for AGIs $25k-50k, 92.9% for AGIs $50k-75k, 91.8% for AGIs $75k-100k, 93.1% for AGIs $100k-200k, 94.0% for AGIs over 200k)
Averages for the 2012 tax year for zip code 34241, filed in 2013:
Average Adjusted Gross Income (AGI) in 2012: $90,465 (Individual Income Tax Returns)
Here:
$90,465
State:
$60,316
Salary/wage: $61,267 (reported on 73.1% of returns)
Here:
$61,267
State:
$45,277
(% of AGI for various income ranges: 67.6% for AGIs below $25k, 68.2% for AGIs $25k-50k, 61.9% for AGIs $50k-75k, 53.1% for AGIs $75k-100k, 53.8% for AGIs $100k-200k, 38.7% for AGIs over 200k)
Taxable interest for individuals: $3,837 (reported on 45.1% of returns)
This zip code:
$3,837
Florida:
$3,587
(% of AGI for various income ranges: 2.5% for AGIs below $25k, 1.7% for AGIs $25k-50k, 1.9% for AGIs $50k-75k, 1.6% for AGIs $75k-100k, 1.7% for AGIs $100k-200k, 2.1% for AGIs over 200k)
Ordinary dividends: $12,856 (reported on 36.3% of returns)
Here:
$12,856
State:
$12,831
(% of AGI for various income ranges: 5.7% for AGIs below $25k, 3.5% for AGIs $25k-50k, 3.3% for AGIs $50k-75k, 4.6% for AGIs $75k-100k, 4.2% for AGIs $100k-200k, 6.5% for AGIs over 200k)
Net capital gain/loss in AGI: +$25,929 (reported on 32.9% of returns)
Here:
+$25,929
State:
+$33,493
(% of AGI for various income ranges: 0.1% for AGIs $25k-50k, 1.1% for AGIs $50k-75k, 1.5% for AGIs $75k-100k, 3.8% for AGIs $100k-200k, 18.8% for AGIs over 200k)
Profit/loss from business: +$17,965 (reported on 17.8% of returns)
Here:
+$17,965
State:
+$10,012
(% of AGI for various income ranges: 10.8% for AGIs below $25k, 6.4% for AGIs $25k-50k, 4.6% for AGIs $50k-75k, 2.6% for AGIs $75k-100k, 3.7% for AGIs $100k-200k, 2.2% for AGIs over 200k)
Taxable individual retirement arrangement distribution: $23,461 (reported on 19.2% of returns)
34241:
$23,461
Florida:
$21,544
(% of AGI for various income ranges: 5.9% for AGIs below $25k, 4.5% for AGIs $25k-50k, 5.3% for AGIs $50k-75k, 6.9% for AGIs $75k-100k, 8.0% for AGIs $100k-200k, 2.8% for AGIs over 200k)
Self-employment retirement plans: $16,017 (reported on 0.9% of returns)
34241:
$16,017
Florida:
$20,611
Total itemized deductions: $25,878 (17% of AGI, reported on 40.5% of returns)
Here:
$25,878
State:
$25,533
Here:
17.1% of AGI
State:
18.0% of AGI
(% of AGI for various income ranges: 18.5% for AGIs below $25k, 14.8% for AGIs $25k-50k, 13.9% for AGIs $50k-75k, 14.7% for AGIs $75k-100k, 14.0% for AGIs $100k-200k, 7.7% for AGIs over 200k)
Charity contributions: $4,520 (reported on 33.8% of returns)
Here:
$4,520
State:
$5,698
(% of AGI for various income ranges: 1.1% for AGIs below $25k, 1.2% for AGIs $25k-50k, 1.4% for AGIs $50k-75k, 1.7% for AGIs $75k-100k, 2.0% for AGIs $100k-200k, 1.7% for AGIs over 200k)
Taxes paid: $6,899 (reported on 39.8% of returns)
34241:
$6,899
State:
$6,203
(% of AGI for various income ranges: 3.6% for AGIs below $25k, 3.1% for AGIs $25k-50k, 3.1% for AGIs $50k-75k, 3.4% for AGIs $75k-100k, 3.7% for AGIs $100k-200k, 2.5% for AGIs over 200k)
Earned income credit: $1,835 (reported on 10.9% of returns)
Here:
$1,835
State:
$2,372
(% of AGI for various income ranges: 3.6% for AGIs below $25k, 0.9% for AGIs $25k-50k)
Percentage of individuals using paid preparers for their 2012 taxes: 57.1%
Here:
57%
State:
54%
(% for various income ranges: 50.2% for AGIs below $25k, 49.6% for AGIs $25k-50k, 55.4% for AGIs $50k-75k, 61.4% for AGIs $75k-100k, 67.9% for AGIs $100k-200k, 79.6% for AGIs over 200k)
Averages for the 2004 tax year for zip code 34241, filed in 2005:
Average Adjusted Gross Income (AGI) in 2004: $73,699 (Individual Income Tax Returns)
Here:
$73,699
State:
$50,523
Salary/wage: $51,337 (reported on 75.4% of returns)
Here:
$51,337
State:
$39,563
(% of AGI for various income ranges: 68.3% for AGIs $10k-25k, 68.1% for AGIs $25k-50k, 61.0% for AGIs $50k-75k, 57.3% for AGIs $75k-100k, 44.7% for AGIs over 100k)
Taxable interest for individuals: $3,606 (reported on 57.2% of returns)
This zip code:
$3,606
Florida:
$3,211
(% of AGI for various income ranges: 4.2% for AGIs $10k-25k, 3.0% for AGIs $25k-50k, 3.0% for AGIs $50k-75k, 2.2% for AGIs $75k-100k, 2.4% for AGIs over 100k)
Taxable dividends: $7,541 (reported on 40.9% of returns)
Here:
$7,541
State:
$6,129
(% of AGI for various income ranges: 4.5% for AGIs $10k-25k, 3.5% for AGIs $25k-50k, 3.7% for AGIs $50k-75k, 3.6% for AGIs $75k-100k, 4.2% for AGIs over 100k)
Net capital gain/loss: +$22,999 (reported on 34.8% of returns)
Here:
+$22,999
State:
+$27,205
(% of AGI for various income ranges: 1.9% for AGIs $10k-25k, 1.1% for AGIs $25k-50k, 1.6% for AGIs $50k-75k, 3.4% for AGIs $75k-100k, 16.2% for AGIs over 100k)
Profit/loss from business: +$19,220 (reported on 17.5% of returns)
Here:
+$19,220
State:
+$10,634
(% of AGI for various income ranges: 6.4% for AGIs $10k-25k, 5.7% for AGIs $25k-50k, 6.0% for AGIs $50k-75k, 5.5% for AGIs $75k-100k, 3.7% for AGIs over 100k)
IRA payment deduction: $3,636 (reported on 4.3% of returns)
34241:
$3,636
Florida:
$3,082
(% of AGI for various income ranges: 0.4% for AGIs $10k-25k, 0.5% for AGIs $25k-50k, 0.2% for AGIs $50k-75k, 0.3% for AGIs $75k-100k, 0.1% for AGIs over 100k)
Self-employed pension: $15,621 (reported on 1.4% of returns)
Here:
$15,621
Florida:
$15,857
(% of AGI for various income ranges: 0.3% for AGIs $50k-75k, 0.4% for AGIs $75k-100k, 0.3% for AGIs over 100k)
Total itemized deductions: $21,460 (19% of AGI, reported on 47.7% of returns)
Here:
$21,460
State:
$20,370
Here:
18.6% of AGI
State:
20.7% of AGI
(% of AGI for various income ranges: 21.5% for AGIs $10k-25k, 20.7% for AGIs $25k-50k, 19.5% for AGIs $50k-75k, 17.4% for AGIs $75k-100k, 10.1% for AGIs over 100k)
Charity contributions deductions: $3,707 (3% of AGI, reported on 41.9% of returns)
Here:
$3,707
State:
$4,064
Here:
3.0% of AGI
State:
3.8% of AGI
(% of AGI for various income ranges: 1.5% for AGIs $10k-25k, 2.0% for AGIs $25k-50k, 2.2% for AGIs $50k-75k, 2.4% for AGIs $75k-100k, 2.1% for AGIs over 100k)
Total tax: $14,730 (reported on 79.0% of returns)
34241:
$14,730
State:
$9,431
(% of AGI for various income ranges: 4.4% for AGIs $10k-25k, 6.8% for AGIs $25k-50k, 9.0% for AGIs $50k-75k, 10.3% for AGIs $75k-100k, 20.2% for AGIs over 100k)
Earned income credit: $1,565 (reported on 7.4% of returns)
Here:
$1,565
State:
$1,808
Percentage of individuals using paid preparers for their 2004 taxes: 60.5%
Here:
60%
State:
60%
(% for various income ranges: 51.9% for AGIs below $10k, 56.1% for AGIs $10k-25k, 58.3% for AGIs $25k-50k, 64.1% for AGIs $50k-75k, 63.1% for AGIs $75k-100k, 71.7% for AGIs over 100k)
Household received Food Stamps/SNAP in the past 12 months: 131 Household did not receive Food Stamps/SNAP in the past 12 months: 6,205
Women who had a birth in the past 12 months: 70 (45 now married, 25 unmarried) Women who did not have a birth in the past 12 months: 3,027 (1,487 now married, 1,541 unmarried)
Housing units in zip code 34241 with a mortgage: 2,917 (476 second mortgage, 394 both second mortgage and home equity loan) Houses without a mortgage: 46
Median monthly owner costs for units with a mortgage: $2,276 Median monthly owner costs for units without a mortgage: $799
Residents with income below the poverty level in 2022:
This zip code:
6.4%
Whole state:
12.7%
Residents with income below 50% of the poverty level in 2022:
This zip code:
4.5%
Whole state:
6.6%
Median number of rooms in houses and condos:
Here:
6.6
State:
5.9
Median number of rooms in apartments:
Here:
5.3
State:
4.2
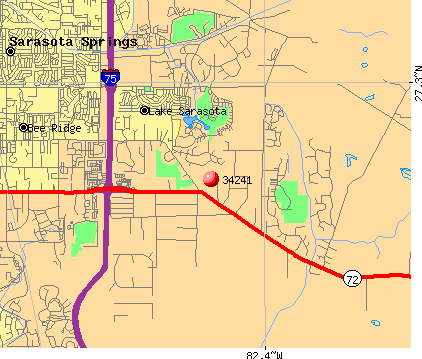
Notable locations in this zip code not listed on our city pages
Notable locations in zip code 34241: Harris Camp (A), Camp Hamilton (B), Fortners Camp (C), Hi Hat Ranch (D), Kansas City Royals Ball Park (E), Sarasota County Fire Department Station 8 (F), Sarasota County Fire Department Station 18 (G), Sarasota County Fire Department Station 16 (H). Display/hide their locations on the map
Size of family households: 2,515 2-persons, 846 3-persons, 715 4-persons, 570 5-persons, 62 6-persons, 35 7-or-more-persons
Size of nonfamily households: 1,105 1-person, 397 2-persons, 29 3-persons
2,218 married couples with children.
367 single-parent households (98 men, 269 women).
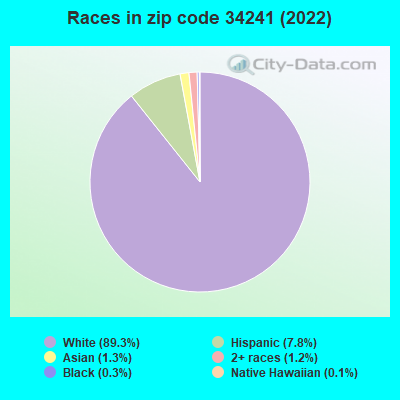
89.2% of residents of 34241 zip code speak English at home.
3.2% of residents speak Spanish at home (87% very well, 5% well, 6% not well, 2% not at all).
6.4% of residents speak other Indo-European language at home (67% very well, 30% well, 3% not well).
0.7% of residents speak Asian or Pacific Island language at home (75% very well, 21% well, 4% not well).
0.6% of residents speak other language at home (82% very well, 18% well).
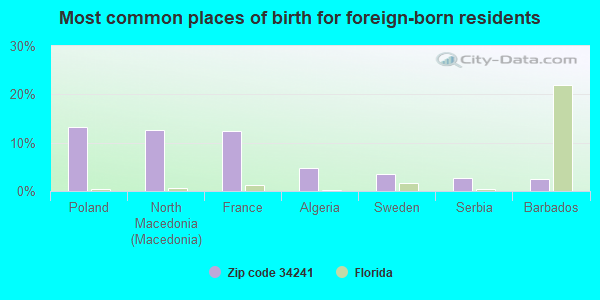
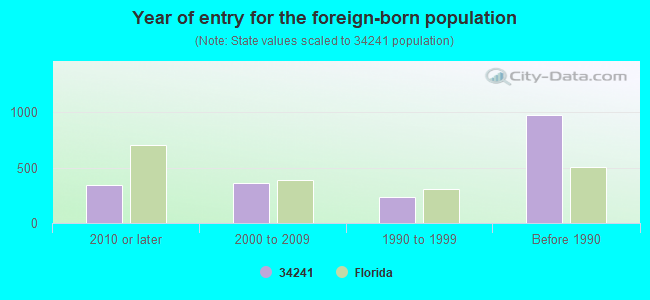
Foreign born population: 1,709 (10.7%) (70.6% of them are naturalized citizens)
Major facilities with environmental interests located in this zip code:
LAKEVIEW ELEMENTARY SCHOOL (7299 PROCTOR RD in SARASOTA, FL)
(National Center for Education Statistics) - STATE ID-0471 Organizations: SARASOTA COUNTY SCHOOL DISTRICT (SCHOOL DISTRICT)
MYAKKA STOP CAMP (INACTIV (13220 STATE ROAD 72 in SARASOTA, FL)
(National Center for Education Statistics) - STATE ID-0295 Organizations: SARASOTA COUNTY SCHOOL DISTRICT (SCHOOL DISTRICT)
OAK PARK SCHOOL (7285 PROCTOR RD in SARASOTA, FL)
(National Center for Education Statistics) - STATE ID-0293 Organizations: SARASOTA COUNTY SCHOOL DISTRICT (SCHOOL DISTRICT)
SARASOTA CO. BOARD OF COUNTY COMM'S (8350 BEE RIDGE ROAD in SARASOTA, FL)
AIR MAJOR (AIRS/AFS) CRITERIA AND HAZARDOUS AIR POLLUTANT INVENTORY (Inventory of air pollution sources) (Resource Conservation and Recovery Act (tracking hazardous waste)) Business SIC classification: REFUSE SYSTEMS Business NAICS classification: SOLID WASTE LANDFILL. Organizations: DENNIS LAABS, HW MGR (CONTACT/OWNER)
Alternative names: SARASOTA CO LANDFILL, SARASOTA COUNTY BOARD OF COUNTY COMMissions
RIDGELAKE BUSINESS PARK (NE BEE RIDGE RD. & I-75 in NA, FL)
National Pollutant Discharge Elimination System NON-MAJOR (Tracking pollutant discharge elimination systems) - permit Organizations: FRED STARLING (CONTACT/OWNER)
SECLUDED OAKS, UNIT II, PHASE (4850 LUSTER LEAF LANE in SARASOTA, FL)
National Pollutant Discharge Elimination System NON-MAJOR (Tracking pollutant discharge elimination systems) - permit Organizations: JAMES LANIER (CONTACT/OWNER)
COASH ESTATES (SW CORNER OF INTER OF COASH LA in SARASOTA, FL)
National Pollutant Discharge Elimination System NON-MAJOR (Tracking pollutant discharge elimination systems) - permit Organizations: JAMES LANIER (CONTACT/OWNER)
Alternative names: SHERMAN MHP LLC
HERITAGE OAKS GOLF AND COUNTRY (4800 CHASE OAKS DR in SARASOTA, FL)
National Pollutant Discharge Elimination System NON-MAJOR (Tracking pollutant discharge elimination systems) - permit Organizations: DAVID SOMERS (CONTACT/OWNER)
LOCKLEAR PARK (F/K/A TWO LAKES (N OF BAHIA VISTA, E OF LOCKWOO in SARASOTA, FL)
National Pollutant Discharge Elimination System NON-MAJOR (Tracking pollutant discharge elimination systems) - permit Organizations: WILLIAM WISINIEWSKI (CONTACT/OWNER)
ROTHENBACH PARK (8350 BEE RIDGE ROAD in SARASOTA, FL)
National Pollutant Discharge Elimination System NON-MAJOR (Tracking pollutant discharge elimination systems) - permit Organizations: WILLIAM WISNIEWSKI (CONTACT/OWNER)
SARASOTA BAPTIST CHURCH PRESCH (7091 PROCTOR RD in SARASOTA, FL)
National Pollutant Discharge Elimination System NON-MAJOR (Tracking pollutant discharge elimination systems) - permit Organizations: BILL ESPY (CONTACT/OWNER)
CHURCH OF HOPE (1616 WENDELL KENT RD in SARASOTA, FL)
National Pollutant Discharge Elimination System NON-MAJOR (Tracking pollutant discharge elimination systems) - permit Organizations: PETER YOUNG (CONTACT/OWNER)
LIFE CARE CENTER OF SARASOTA (8104 N TUTTLE AVE in SARASOTA, FL)
National Pollutant Discharge Elimination System NON-MAJOR (Tracking pollutant discharge elimination systems) - permit Alternative names: LIFE CARE HEALTH RESOURCES INC
Housing units lacking complete kitchen facilities: 2.0%
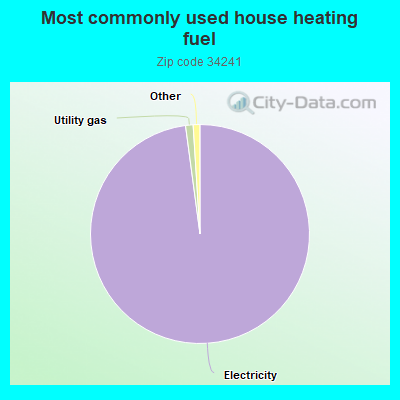
97.9%Electricity
1.1%Utility gas
Population in 1990: 8,902. Population change in the 1990s: +3,204 (+36.0%).
Place of birth for U.S.-born residents:
This state: 4,759
Northeast: 4,164
Midwest: 3,064
South: 1,574
West: 451
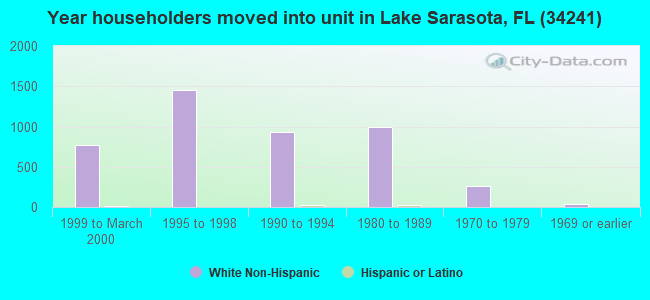
53% of the 34241 zip code residents lived in the same house 5 years ago. Out of people who lived in different houses, 53% lived in this county. Out of people who lived in different counties, 50% lived in Florida.
92% of the 34241 zip code residents lived in the same house 1 year ago. Out of people who lived in different houses, 60% moved from this county. Out of people who lived in different houses, 14% moved from different county within same state. Out of people who lived in different houses, 16% moved from different state. Out of people who lived in different houses, 9% moved from abroad.
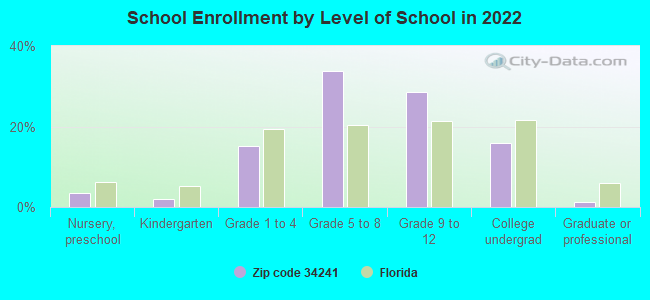
Private vs. public school enrollment:
Students in private schools in grades 1 to 8 (elementary and middle school): 339
Here:
21.2%
Florida:
15.8%
Students in private schools in grades 9 to 12 (high school): 214
Here:
22.9%
Florida:
12.9%
Students in private undergraduate colleges: 48
Here:
9.4%
Florida:
23.6%
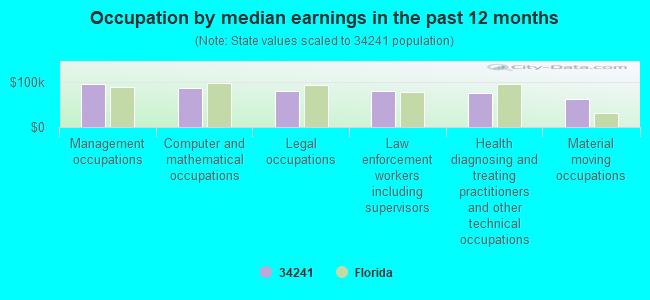
Occupation by median earnings in the past 12 months ($)
95,908Management occupations
87,438Computer and mathematical occupations
81,074Legal occupations
80,878Law enforcement workers including supervisors
76,934Health diagnosing and treating practitioners and other technical occupations
62,685Material moving occupations
Companies with federal contracts located in this zip code:
QUEST OUTFITTERS (4919 HUBNER CIR in SARASOTA, FL; small business) : $3,610 in 2 contractsin 2006
$6,905 with Defense Logistics Agency for Textile Fabrics. Signed on 2006-06-30. Completion date: 2006-07-14.
-$3,295, same as above.Signed on 2006-06-30. Completion date: 2006-07-14.
Top industries in this zip code by the number of employees in 2005:
2002 - 2018 National Fire Incident Reporting System (NFIRS) incidents
According to the data from the years 2002 - 2018 the average number of fires per year is 25. The highest number of fires - 40 took place in 2012, and the least - 0 in 2004. The data has a dropping trend.
When looking into fire subcategories, the most reports belonged to: Outside Fires (66.4%), and Mobile Property/Vehicle Fires (15.7%).
Fire incident types reported to NFIRS in Zip Code 34241


 Nearest zip codes: 34238, 34233, 34275, 34232, 34229, 34240.


 According to the data from the years 2002 - 2018 the average number of fires per year is 25. The highest number of fires - 40 took place in 2012, and the least - 0 in 2004. The data has a dropping trend.
 When looking into fire subcategories, the most reports belonged to: Outside Fires (66.4%), and Mobile Property/Vehicle Fires (15.7%).