Estimated zip code population in 2022: 19,926 Zip code population in 2010: 16,062 Zip code population in 2000: 15,761
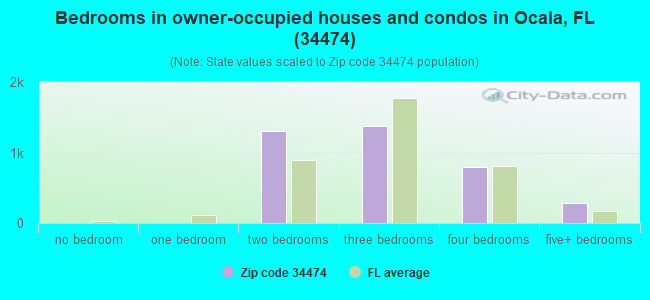
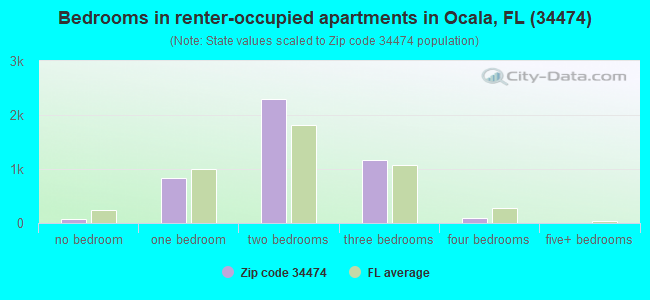
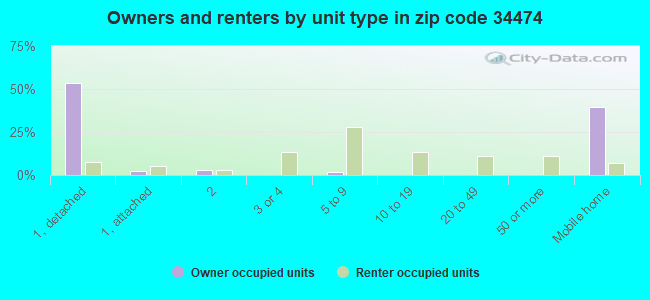
Houses and condos: 9,176 Renter-occupied apartments: 4,479
% of renters here:
54%
State:
33%
March 2022 cost of living index in zip code 34474: 85.0 (less than average, U.S. average is 100)
Land area: 19.8 sq. mi. Water area: 0.0 sq. mi.
Population density: 1,009 people per square mile
(low).
OSM Map
General Map
Google Map
MSN Map
OSM Map
General Map
Google Map
MSN Map
OSM Map
General Map
Google Map
MSN Map
OSM Map
General Map
Google Map
MSN Map
Please wait while loading the map...
Real estate property taxes paid for housing units in 2022:
This zip code:
0.8% ($1,551)
Florida:
0.7% ($2,529)
Median real estate property taxes paid for housing units with mortgages in 2022: $1,878 (0.6%) Median real estate property taxes paid for housing units with no mortgage in 2022: $832 (1.0%)
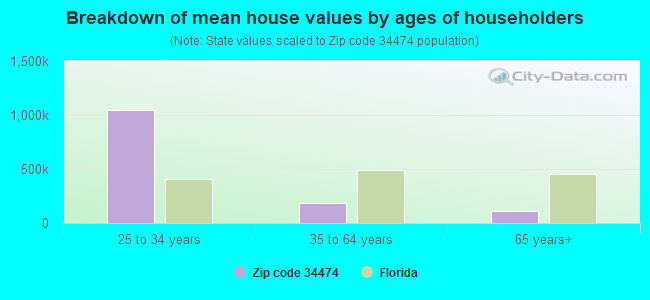
Estimated median house/condo value in 2022: $204,438
34474:
$204,438
Florida:
$354,100
According to our research of Florida and other state lists, there were 17 registered sex offenders living in 34474 zip code as of April 27, 2024. The ratio of all residents to sex offenders in zip code 34474 is 948 to 1. The ratio of registered sex offenders to all residents in this zip code is lower than the state average.
Median resident age:
This zip code:
41.4 years
Florida median age:
42.7 years
Average household size:
This zip code:
2.4 people
Florida:
2.5 people
Averages for the 2020 tax year for zip code 34474, filed in 2021:
Average Adjusted Gross Income (AGI) in 2020: $51,413 (Individual Income Tax Returns)
Here:
$51,413
State:
$82,200
Salary/wage: $46,236 (reported on 81.3% of returns)
Here:
$46,236
State:
$58,347
(% of AGI for various income ranges: 1260.2% for AGIs below $25k, 3669.5% for AGIs $25k-50k, 6655.5% for AGIs $50k-75k, 10191.7% for AGIs $75k-100k, 17859.5% for AGIs $100k-200k, 78895.0% for AGIs over 200k)
Taxable interest for individuals: $1,760 (reported on 18.2% of returns)
This zip code:
$1,760
Florida:
$4,272
(% of AGI for various income ranges: 12.5% for AGIs below $25k, 14.5% for AGIs $25k-50k, 40.1% for AGIs $50k-75k, 78.6% for AGIs $75k-100k, 176.4% for AGIs $100k-200k, 1281.7% for AGIs over 200k)
Ordinary dividends: $4,405 (reported on 11.5% of returns)
Here:
$4,405
State:
$15,863
(% of AGI for various income ranges: 16.3% for AGIs below $25k, 24.1% for AGIs $25k-50k, 49.8% for AGIs $50k-75k, 171.9% for AGIs $75k-100k, 368.5% for AGIs $100k-200k, 1420.0% for AGIs over 200k)
Net capital gain/loss in AGI: +$12,905 (reported on 11.2% of returns)
Here:
+$12,905
State:
+$62,983
(% of AGI for various income ranges: 8.4% for AGIs below $25k, 21.2% for AGIs $25k-50k, 89.6% for AGIs $50k-75k, 162.8% for AGIs $75k-100k, 687.7% for AGIs $100k-200k, 12293.3% for AGIs over 200k)
Profit/loss from business: +$11,330 (reported on 17.4% of returns)
Here:
+$11,330
State:
+$9,719
(% of AGI for various income ranges: 131.0% for AGIs below $25k, 167.2% for AGIs $25k-50k, 260.2% for AGIs $50k-75k, 350.3% for AGIs $75k-100k, 614.4% for AGIs $100k-200k, 6745.0% for AGIs over 200k)
Taxable individual retirement arrangement distribution: $16,542 (reported on 6.3% of returns)
34474:
$16,542
Florida:
$24,823
(% of AGI for various income ranges: 49.1% for AGIs below $25k, 43.6% for AGIs $25k-50k, 179.0% for AGIs $50k-75k, 266.1% for AGIs $75k-100k, 701.0% for AGIs $100k-200k, 2320.0% for AGIs over 200k)
Total itemized deductions: $33,093 (reported on 3.6% of returns)
Here:
$33,093
State:
$45,393
(% of AGI for various income ranges: 23.3% for AGIs below $25k, 61.9% for AGIs $25k-50k, 177.6% for AGIs $50k-75k, 268.9% for AGIs $75k-100k, 543.8% for AGIs $100k-200k, 5996.7% for AGIs over 200k)
Charity contributions: $11,870 (reported on 2.8% of returns)
Here:
$11,870
State:
$20,178
(% of AGI for various income ranges: 13.9% for AGIs $25k-50k, 31.2% for AGIs $50k-75k, 67.5% for AGIs $75k-100k, 186.2% for AGIs $100k-200k, 2053.3% for AGIs over 200k)
Taxes paid: $5,456 (reported on 3.3% of returns)
34474:
$5,456
State:
$6,967
(% of AGI for various income ranges: 3.0% for AGIs below $25k, 7.6% for AGIs $25k-50k, 27.8% for AGIs $50k-75k, 45.3% for AGIs $75k-100k, 104.6% for AGIs $100k-200k, 750.0% for AGIs over 200k)
Earned income credit: $2,342 (reported on 21.6% of returns)
Here:
$2,342
State:
$2,306
(% of AGI for various income ranges: 111.5% for AGIs below $25k, 74.8% for AGIs $25k-50k, 1.2% for AGIs $50k-75k)
Percentage of individuals using paid preparers for their 2020 taxes: 93.4%
Here:
93%
State:
92%
(% for various income ranges: 92.2% for AGIs below $25k, 94.7% for AGIs $25k-50k, 93.1% for AGIs $50k-75k, 92.9% for AGIs $75k-100k, 94.4% for AGIs $100k-200k, 95.0% for AGIs over 200k)
Averages for the 2012 tax year for zip code 34474, filed in 2013:
Average Adjusted Gross Income (AGI) in 2012: $42,112 (Individual Income Tax Returns)
Here:
$42,112
State:
$60,316
Salary/wage: $37,401 (reported on 81.7% of returns)
Here:
$37,401
State:
$45,277
(% of AGI for various income ranges: 75.9% for AGIs below $25k, 79.1% for AGIs $25k-50k, 77.5% for AGIs $50k-75k, 73.8% for AGIs $75k-100k, 75.5% for AGIs $100k-200k, 52.4% for AGIs over 200k)
Taxable interest for individuals: $1,552 (reported on 22.0% of returns)
This zip code:
$1,552
Florida:
$3,587
(% of AGI for various income ranges: 1.0% for AGIs below $25k, 0.7% for AGIs $25k-50k, 0.9% for AGIs $50k-75k, 0.5% for AGIs $75k-100k, 0.9% for AGIs $100k-200k, 0.9% for AGIs over 200k)
Ordinary dividends: $4,420 (reported on 11.9% of returns)
Here:
$4,420
State:
$12,831
(% of AGI for various income ranges: 2.0% for AGIs below $25k, 1.3% for AGIs $25k-50k, 1.2% for AGIs $50k-75k, 1.3% for AGIs $75k-100k, 1.3% for AGIs $100k-200k, 0.5% for AGIs over 200k)
Net capital gain/loss in AGI: +$4,806 (reported on 9.2% of returns)
Here:
+$4,806
State:
+$33,493
(% of AGI for various income ranges: 1.2% for AGIs $100k-200k, 5.2% for AGIs over 200k)
Profit/loss from business: +$9,990 (reported on 13.5% of returns)
Here:
+$9,990
State:
+$10,012
(% of AGI for various income ranges: 7.3% for AGIs below $25k, 3.0% for AGIs $25k-50k, 2.0% for AGIs $50k-75k, 3.2% for AGIs $75k-100k, 2.8% for AGIs $100k-200k, 1.4% for AGIs over 200k)
Taxable individual retirement arrangement distribution: $11,279 (reported on 8.2% of returns)
34474:
$11,279
Florida:
$21,544
(% of AGI for various income ranges: 2.6% for AGIs below $25k, 2.3% for AGIs $25k-50k, 2.4% for AGIs $50k-75k, 2.5% for AGIs $75k-100k, 3.7% for AGIs $100k-200k)
Total itemized deductions: $18,713 (20% of AGI, reported on 16.3% of returns)
Here:
$18,713
State:
$25,533
Here:
20.3% of AGI
State:
18.0% of AGI
(% of AGI for various income ranges: 4.7% for AGIs below $25k, 6.8% for AGIs $25k-50k, 8.0% for AGIs $50k-75k, 9.2% for AGIs $75k-100k, 9.7% for AGIs $100k-200k, 5.8% for AGIs over 200k)
Charity contributions: $4,273 (reported on 12.6% of returns)
Here:
$4,273
State:
$5,698
(% of AGI for various income ranges: 0.4% for AGIs below $25k, 0.8% for AGIs $25k-50k, 1.1% for AGIs $50k-75k, 1.7% for AGIs $75k-100k, 1.9% for AGIs $100k-200k, 2.0% for AGIs over 200k)
Taxes paid: $3,094 (reported on 16.0% of returns)
34474:
$3,094
State:
$6,203
(% of AGI for various income ranges: 0.5% for AGIs below $25k, 0.9% for AGIs $25k-50k, 1.2% for AGIs $50k-75k, 1.5% for AGIs $75k-100k, 2.0% for AGIs $100k-200k, 1.2% for AGIs over 200k)
Earned income credit: $2,369 (reported on 22.9% of returns)
Here:
$2,369
State:
$2,372
(% of AGI for various income ranges: 6.8% for AGIs below $25k, 1.1% for AGIs $25k-50k)
Percentage of individuals using paid preparers for their 2012 taxes: 48.7%
Here:
49%
State:
54%
(% for various income ranges: 45.9% for AGIs below $25k, 46.5% for AGIs $25k-50k, 54.4% for AGIs $50k-75k, 50.0% for AGIs $75k-100k, 61.8% for AGIs $100k-200k, 81.8% for AGIs over 200k)
Averages for the 2004 tax year for zip code 34474, filed in 2005:
Average Adjusted Gross Income (AGI) in 2004: $45,033 (Individual Income Tax Returns)
Here:
$45,033
State:
$50,523
Salary/wage: $36,126 (reported on 82.1% of returns)
Here:
$36,126
State:
$39,563
(% of AGI for various income ranges: 139.0% for AGIs below $10k, 79.1% for AGIs $10k-25k, 78.2% for AGIs $25k-50k, 74.6% for AGIs $50k-75k, 73.2% for AGIs $75k-100k, 51.5% for AGIs over 100k)
Taxable interest for individuals: $2,494 (reported on 33.0% of returns)
This zip code:
$2,494
Florida:
$3,211
(% of AGI for various income ranges: 8.9% for AGIs below $10k, 2.2% for AGIs $10k-25k, 1.5% for AGIs $25k-50k, 1.4% for AGIs $50k-75k, 2.1% for AGIs $75k-100k, 1.7% for AGIs over 100k)
Taxable dividends: $3,111 (reported on 18.1% of returns)
Here:
$3,111
State:
$6,129
(% of AGI for various income ranges: 9.4% for AGIs below $10k, 1.3% for AGIs $10k-25k, 0.9% for AGIs $25k-50k, 1.2% for AGIs $50k-75k, 0.9% for AGIs $75k-100k, 1.2% for AGIs over 100k)
Net capital gain/loss: +$20,692 (reported on 16.4% of returns)
Here:
+$20,692
State:
+$27,205
(% of AGI for various income ranges: -5.0% for AGIs below $10k, 0.3% for AGIs $10k-25k, 1.0% for AGIs $25k-50k, 1.5% for AGIs $50k-75k, 1.6% for AGIs $75k-100k, 15.0% for AGIs over 100k)
Profit/loss from business: +$14,575 (reported on 12.3% of returns)
Here:
+$14,575
State:
+$10,634
(% of AGI for various income ranges: -0.6% for AGIs below $10k, 4.2% for AGIs $10k-25k, 2.3% for AGIs $25k-50k, 2.3% for AGIs $50k-75k, 3.4% for AGIs $75k-100k, 5.3% for AGIs over 100k)
IRA payment deduction: $3,410 (reported on 2.1% of returns)
34474:
$3,410
Florida:
$3,082
(% of AGI for various income ranges: 0.1% for AGIs $10k-25k, 0.2% for AGIs $25k-50k, 0.2% for AGIs $50k-75k, 0.3% for AGIs $75k-100k, 0.1% for AGIs over 100k)
Self-employed pension: $14,360 (reported on 0.3% of returns)
Here:
$14,360
Florida:
$15,857
Total itemized deductions: $19,951 (17% of AGI, reported on 18.8% of returns)
Here:
$19,951
State:
$20,370
Here:
17.4% of AGI
State:
20.7% of AGI
(% of AGI for various income ranges: 13.2% for AGIs below $10k, 5.8% for AGIs $10k-25k, 7.3% for AGIs $25k-50k, 10.1% for AGIs $50k-75k, 12.5% for AGIs $75k-100k, 8.2% for AGIs over 100k)
Charity contributions deductions: $5,149 (4% of AGI, reported on 16.1% of returns)
Here:
$5,149
State:
$4,064
Here:
4.2% of AGI
State:
3.8% of AGI
(% of AGI for various income ranges: 0.7% for AGIs below $10k, 0.7% for AGIs $10k-25k, 1.1% for AGIs $25k-50k, 1.7% for AGIs $50k-75k, 2.3% for AGIs $75k-100k, 2.4% for AGIs over 100k)
Total tax: $9,430 (reported on 68.8% of returns)
34474:
$9,430
State:
$9,431
(% of AGI for various income ranges: 3.4% for AGIs below $10k, 3.7% for AGIs $10k-25k, 6.9% for AGIs $25k-50k, 9.6% for AGIs $50k-75k, 11.3% for AGIs $75k-100k, 22.4% for AGIs over 100k)
Earned income credit: $1,848 (reported on 22.6% of returns)
Here:
$1,848
State:
$1,808
Percentage of individuals using paid preparers for their 2004 taxes: 61.4%
Here:
61%
State:
60%
(% for various income ranges: 59.2% for AGIs below $10k, 63.3% for AGIs $10k-25k, 57.7% for AGIs $25k-50k, 59.0% for AGIs $50k-75k, 59.0% for AGIs $75k-100k, 76.3% for AGIs over 100k)
Household received Food Stamps/SNAP in the past 12 months: 803 Household did not receive Food Stamps/SNAP in the past 12 months: 7,476
Women who had a birth in the past 12 months: 202 (123 now married, 78 unmarried) Women who did not have a birth in the past 12 months: 3,980 (1,485 now married, 2,495 unmarried)
Housing units in zip code 34474 with a mortgage: 2,105 (130 second mortgage, 131 both second mortgage and home equity loan) Houses without a mortgage: 28
Median monthly owner costs for units with a mortgage: $1,507 Median monthly owner costs for units without a mortgage: $541
Residents with income below the poverty level in 2022:
This zip code:
16.4%
Whole state:
12.7%
Residents with income below 50% of the poverty level in 2022:
This zip code:
7.8%
Whole state:
6.6%
Median number of rooms in houses and condos:
Here:
6.2
State:
5.9
Median number of rooms in apartments:
Here:
4.4
State:
4.2
Notable locations in this zip code not listed on our city pages
Notable locations in zip code 34474: Heath Brook Commons (A), West Port Football Stadium (B), Ocala Fire and Rescue Station 6 (C), Sumter Electric Company Substation (D), Red Oak Electric Substation (E), Ocala Fire and Rescue Station 4 (F), Marion County Sheriff's Office - Airport Annex (G), Central Florida Regional Library (H), Emergency Medical Services Alliance (I). Display/hide their locations on the map
Churches in zip code 34474 include: College Park Church of God (A), Calvary Baptist Church (B), College Road Baptist Church (C), Eagles Nest Church (D), The Rock Family Church (E), Church of the Nazarene (F), Ocala Word of Faith Church (G), Berean Baptist Church (H), Mount Calvary Missionary Baptist Church (I). Display/hide their locations on the map
In group quarters: 471 (-1 institutionalized population)
Size of family households: 1,997 2-persons, 1,228 3-persons, 1,053 4-persons, 288 5-persons, 323 6-persons, 32 7-or-more-persons
Size of nonfamily households: 2,752 1-person, 573 2-persons, 10 3-persons
2,214 married couples with children.
1,566 single-parent households (460 men, 1,106 women).
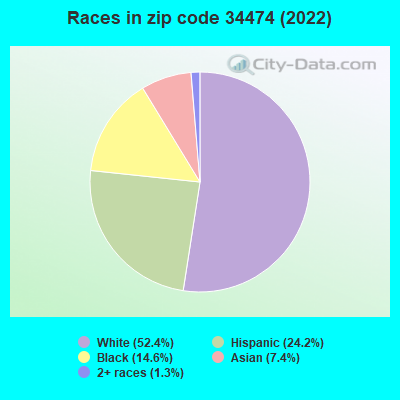
73.0% of residents of 34474 zip code speak English at home.
20.0% of residents speak Spanish at home (50% very well, 21% well, 24% not well, 4% not at all).
4.3% of residents speak other Indo-European language at home (88% very well, 12% well).
2.5% of residents speak Asian or Pacific Island language at home (69% very well, 16% well, 6% not well, 9% not at all).
0.1% of residents speak other language at home (100% very well).
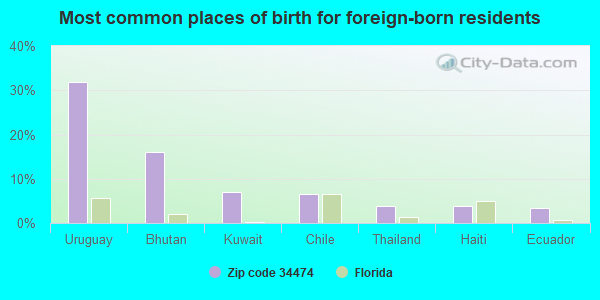
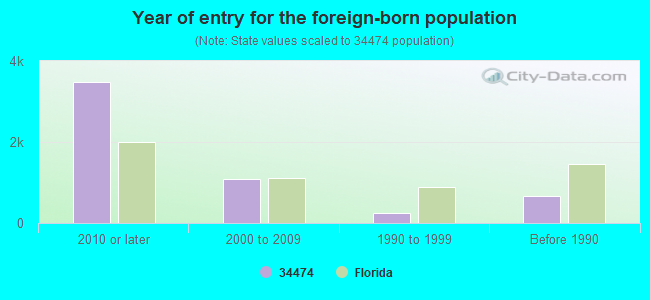
Foreign born population: 3,632 (18.2%) (40.9% of them are naturalized citizens)
Major facilities with environmental interests located in this zip code:
HOMETTE FLORIDA (1230 S.W. 10TH ST. in OCALA, FL)
STATE MASTER (FDM) - WAFR-FLR05B754, NPDES STORMWATER PROGRAM, NPDES STORMWATER PERMIT CRITERIA AND HAZARDOUS AIR POLLUTANT INVENTORY (Inventory of air pollution sources) National Pollutant Discharge Elimination System NON-MAJOR (Tracking pollutant discharge elimination systems) - permit TRI REPORTER (Tracking of toxic chemicals releasing facilities) Business SIC classification: MOBILE HOMES Business NAICS classification: MANUFACTURED HOME (MOBILE HOME) MANUFACTURING. Organizations: SKYLINE CORPORATION (CONTACT/APPLICANT)
, MICHAEL WOLTER (CONTACT/OWNER)
, SKYLINE CORP (CONTACT/PERMIT)
Alternative names: HOMETTE CORP
CLOSETMAID (650 SOUTHWEST 27TH AVENUE in OCALA, FL)
STATE MASTER (FDM) - CHAZ-FLD148657539, HAZARDOUS WASTE REGULATION PROGRAM CRITERIA AND HAZARDOUS AIR POLLUTANT INVENTORY (Inventory of air pollution sources) Small Quantity Generators, between 100 kg and 1000 kg of hazardous waste/month (Resource Conservation and Recovery Act (tracking hazardous waste)) - notification TRI REPORTER (Tracking of toxic chemicals releasing facilities) Business SIC classification: MISCELLANEOUS FABRICATED WIRE PRODUCTS; SILVERWARE, PLATED WARE, AND STAINLESS STEEL WARE Organizations: COX PAUL ENGR\MFG (CONTACT/OWNER)
Alternative names: CLAIRSON INTERNATIONAL, CLAIRSON INTERNATIONAL CLOSETMAID
ALLIED TIRES AND SERVICE #2584 (2547 SW COLLEGE RD in OCALA, FL)
STATE MASTER (FDM) - CHAZ-FL0000362251, HAZARDOUS WASTE REGULATION PROGRAM Small Quantity Generators, between 100 kg and 1000 kg of hazardous waste/month (Resource Conservation and Recovery Act (tracking hazardous waste)) - notification Business SIC classification: AUTO AND HOME SUPPLY STORES Organizations: ALLIED TIRE SALES INC #70, ANGIE MUCCI, PARALEGAL (CONTACT/OWNER)
, GOODYEAR TIRE AND RUBBER CO (CONTACT/OWNER)
Alternative names: ALLIED TIRE SALES INC #70
SAMS CLUB #6335 (3921 SOUTHWEST COLLEGE ROAD in OCALA, FL)
(Integrated Compliance Information System) - ICIS-04-2000-0161, FORMAL ENFORCEMENT ACTION (Resource Conservation and Recovery Act (tracking hazardous waste)) Organizations: SAMS EAST INC (CONTACT/OWNER)
COLLEGE PARK ELEMENTARY SCHOOL (1330 SOUTHWEST 33RD AVE. in OCALA, FL)
(Geographic Names Information System) (National Center for Education Statistics) - STATE ID-0651 Organizations: MARION COUNTY SCHOOL DISTRICT (SCHOOL DISTRICT)
LAUREL PARK APARTMENTS - PHASE (100 NW 23RD AVENUE in OCALA, FL)
National Pollutant Discharge Elimination System NON-MAJOR (Tracking pollutant discharge elimination systems) - permit National Pollutant Discharge Elimination System NON-MAJOR (Tracking pollutant discharge elimination systems) - permit Organizations: DALE LEE (CONTACT/OWNER)
Alternative names: PARALLEL TAXIWAY TO RUNWAY 15-
SHADY HILL ELEMENTARY SCHOOL (5959 S. MAGNOLIA AVENUE in OCALA, FL)
(National Center for Education Statistics) - STATE ID-0551 Organizations: MARION COUNTY SCHOOL DISTRICT (SCHOOL DISTRICT)
MERILLAT OCALA PLANT (1300 SW 38TH AVENUE in OCALA, FL)
AIR MAJOR (AIRS/AFS) CRITERIA AND HAZARDOUS AIR POLLUTANT INVENTORY (Inventory of air pollution sources) National Pollutant Discharge Elimination System NON-MAJOR (Tracking pollutant discharge elimination systems) - permit Small Quantity Generators, between 100 kg and 1000 kg of hazardous waste/month (Resource Conservation and Recovery Act (tracking hazardous waste)) - notification TRI REPORTER (Tracking of toxic chemicals releasing facilities) Business SIC classification: WOOD KITCHEN CABINETS Organizations: MERILLAT CORP (CONTACT/OWNER)
Alternative names: THE HASKELL COMPANY, MERILLAT CORP, MERILLAT CORP
COMMUNITY TECHNICAL AND ADULT EDUCATION CENTER (1014 S.W. 7TH ROAD in OCALA, FL)
(National Center for Education Statistics) - STATE ID-9412 Organizations: MARION COUNTY SCHOOL DISTRICT (SCHOOL DISTRICT)
KINGSBURY ACADEMY (3130 SW 27TH AVENUE in OCALA, FL)
(National Center for Education Statistics) - STATE ID-9731 Organizations: MARION COUNTY SCHOOL DISTRICT (SCHOOL DISTRICT)
KMART OCALA DISTRIBUTION CENTER (655 SW 52ND AVE in OCALA, FL)
Small Quantity Generators, between 100 kg and 1000 kg of hazardous waste/month (Resource Conservation and Recovery Act (tracking hazardous waste)) - notification - ICIS-, ENFORCEMENT/COMPLIANCE ACTIVITY Organizations: DENNIS GOODRICH (CONTACT/OWNER)
MARTIN MARIETTA MISSILE SYSTEMS BUILDING 7 OCALA (5312 SOUTHWEST 6TH PLACE in OCALA, FL)
AIR SYNTHETIC MINOR (AIRS/AFS) CRITERIA AND HAZARDOUS AIR POLLUTANT INVENTORY (Inventory of air pollution sources) HAZARDOUS WASTE BIENNIAL REPORTER (Resource Conservation and Recovery Act (tracking hazardous waste)) (Resource Conservation and Recovery Act (tracking hazardous waste)) TRI REPORTER (Tracking of toxic chemicals releasing facilities) Business SIC classification: ELECTRONIC COMPONENTS; SEARCH, DETECTION, NAVIGATION, GUIDANCE, AERONAUTICAL, AND NAUTICAL SYSTEMS AND INSTRUMENTS Organizations: RONALD KRAMER, GROUP ENV ENG (CONTACT/OWNER)
Alternative names: LOCKHEED MARTIN ELECTRONIC & MISSIL, LOCKHEED MARTIN ELECTRONICS & MISSILES, LOCKHEED MARTIN ELECRONICS & MISSILE, LOCKHEED MARTIN ELECRONICS & MISSILES
SADDLEWOOD ELEMENTARY SCHOOL (3700 SW 43RD COURT in OCALA, FL)
(National Center for Education Statistics) - STATE ID-0681 Organizations: MARION COUNTY SCHOOL DISTRICT (SCHOOL DISTRICT)
Housing units lacking complete plumbing facilities: 2.3% Housing units lacking complete kitchen facilities: 3.3%
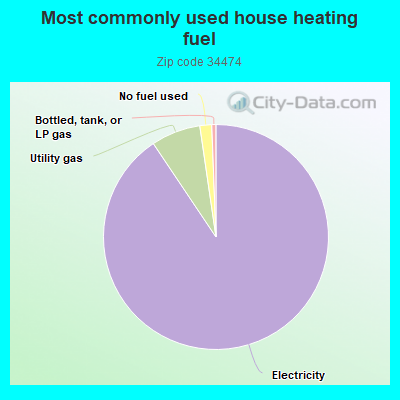
90.6%Electricity
7.1%Utility gas
1.7%No fuel used
0.6%Bottled, tank, or LP gas
Place of birth for U.S.-born residents:
This state: 6,325
Northeast: 4,470
Midwest: 1,892
South: 1,282
West: 896
36% of the 34474 zip code residents lived in the same house 5 years ago. Out of people who lived in different houses, 48% lived in this county. Out of people who lived in different counties, 50% lived in Florida.
78% of the 34474 zip code residents lived in the same house 1 year ago. Out of people who lived in different houses, 46% moved from this county. Out of people who lived in different houses, 27% moved from different county within same state. Out of people who lived in different houses, 13% moved from different state. Out of people who lived in different houses, 11% moved from abroad.
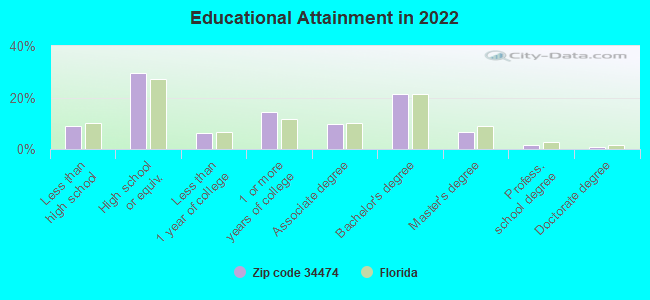
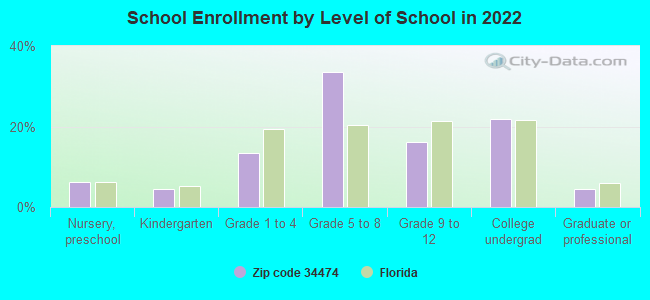
Private vs. public school enrollment:
Students in private schools in grades 1 to 8 (elementary and middle school): 431
Here:
20.0%
Florida:
15.8%
Students in private schools in grades 9 to 12 (high school): 84
Here:
11.3%
Florida:
12.9%
Students in private undergraduate colleges: 333
Here:
32.9%
Florida:
23.6%
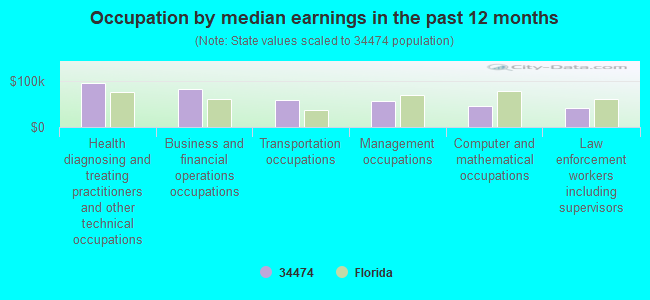
Occupation by median earnings in the past 12 months ($)
95,899Health diagnosing and treating practitioners and other technical occupations
83,552Business and financial operations occupations
59,549Transportation occupations
56,757Management occupations
44,715Computer and mathematical occupations
42,316Law enforcement workers including supervisors
Companies with biggest federal contracts located in this zip code:
COMPAIR USA, INC (1634 SW 17TH ST in OCALA, FL) : $569,868 in 12 contractsfrom 1999 to 2005
Contracts for Compressors and Vacuum Pumps, Diesel Engines and Components, Air Purification Equipment, Non-nuclear Ship Repair (East) Ship repair (including overhauls and conversions) performed on non-nuclear propelled and nonpropelled ships east of the 108th meridian, and moreby Navy, Air Force Signed by year:2000: $159,248; 2001: $0; 2002: $289,770; 2003: $9,695; 2004: $37,250; 2005: $41,694; 2006: $0.
Biggest contracts:
$110,000 with Navy for Compressors and Vacuum Pumps. Signed on 2002-07-23. Completion date: 2002-07-23.
$98,983 with Navy for Compressors and Vacuum Pumps. Taking place in CA. Signed on 2000-06-30. Completion date: 2000-06-30.
$73,382, same as above.Signed on 2002-02-28. Completion date: 2002-03-25.
$53,194 with Air Force for Diesel Engines and Components. Signed on 2002-11-18. Completion date: 2003-02-21.
HIGH STRUCTURE MAINTENANCE LLC (3101 SW 34TH AVE A STE905- in OCALA, FL; small business) : $207,780 in 7 contractsfrom 2002 to 2004
Contracts for Maintenance, Repair and Rebuilding of Equipment -- Miscellaneous by Army Signed by year:2000: $0; 2001: $0; 2002: $62,760; 2003: $71,260; 2004: $73,760; 2005: $0; 2006: $0.
Biggest contracts:
$68,260 with Army for Maintenance, Repair and Rebuilding of Equipment -- Miscellaneous. Signed on 2004-10-05. Completion date: 2005-09-30.
$62,760, same as above.Signed on 2003-11-17. Completion date: 2004-09-30.
$62,760 with Army for Maintenance, Repair and Rebuilding of Equipment -- Miscellaneous. Taking place in MD. Signed on 2002-11-22. Completion date: 2003-09-30.
$8,500, same as above.Signed on 2003-04-28. Completion date: 2003-09-30.
HIGH STRUCTURE MAINTENANCE INC (PMB-425 in OCALA, FL; small business) : $154,971 in 6 contractsfrom 1999 to 2001
Contracts for Maintenance, Repair and Rebuilding of Equipment -- Miscellaneous by Army Signed by year:2000: $0; 2001: $108,211; 2002: $0; 2003: $0; 2004: $0; 2005: $0; 2006: $0.
Biggest contracts:
$108,520 with Army for Maintenance, Repair and Rebuilding of Equipment -- Miscellaneous. Taking place in MD. Signed on 2001-12-11. Completion date: 2002-09-30.
$46,760, same as above.Signed on 1999-10-19. Completion date: 2000-09-30.
$0, same as above.Signed on 2001-12-11. Completion date: 2002-09-30.
$0, same as above.Signed on 2001-10-31. Completion date: 2001-09-30.
INTERNATIONAL CENTER FOR EMERG (3001 SW 67TH AVE in OCALA, FL)
$71,160 with Navy for Education Services. Signed on 2002-02-28. Completion date: 2002-05-03.
latif M. hamed (3230 S.W. 33rd Road in Ocala, FL; small business)
$62,300 with Offices, Boards and Divisions (includes Attorney General, Deputy Attorney General, etc.) for Expert Witness. Signed on 2005-02-04. Completion date: 2005-06-01.
OCALA INN LTD (3434 SW COLLEGE RD in OCALA, FL; small business) : $48,921 in 3 contractsfrom 2004 to 2005
$32,568 with Army for Lodging - Hotel/Motel. Signed on 2004-06-18. Completion date: 2004-06-29.
$9,177, same as above.Signed on 2005-03-30. Completion date: 2005-04-04.
$7,176, same as above.Signed on 2005-07-21. Completion date: 2005-07-30.
AMCO WATER METERING SYSTEMS (1100 SW 38TH AVE in OCALA, FL; small business)
$48,900 with Army for Sets, Kits, and Outfits of Measuring Tools. Signed on 2003-04-09. Completion date: 2003-05-09.
FIRE EMERGENCY & SAFETY TECHNO (5625 SW 6TH PL UNIT 104 in OCALA, FL; small business)
$27,368 with Air Force for Trailers. Signed on 2005-09-30. Completion date: 2005-11-30.
VAN-MOR INC (1007 SW 17TH ST in OCALA, FL; small business) 50 employees, $0 revenue. Woman Owned Business
$24,668 with Air Force for Vehicular Power Transmission Components. Signed on 2005-02-08. Completion date: 2005-02-10.
DOLLINGER CORPORATION (2499 SW 60TH AVE in OCALA, FL) : $19,964 in 2 contractsin 2005
$9,982 with Navy for Engine Fuel System Components, Nonaircraft. Signed on 2005-05-11. Completion date: 2005-05-23.
$9,982, same as above.Signed on 2005-07-06. Completion date: 2005-08-15.
Top industries in this zip code by the number of employees in 2005:
Health Care and Social Assistance: General Medical and Surgical Hospitals (over 1000 employees: 2 establishments)
2003 - 2018 National Fire Incident Reporting System (NFIRS) incidents
According to the data from the years 2003 - 2018 the average number of fire incidents per year is 71. The highest number of fire incidents - 148 took place in 2005, and the least - 32 in 2004. The data has a declining trend.
When looking into fire subcategories, the most reports belonged to: Structure Fires (35.4%), and Outside Fires (32.8%).
Fire incident types reported to NFIRS in Zip Code 34474


 Nearest zip codes: 34476, 34471, 34481, 34482, 34475, 34480.


 According to the data from the years 2003 - 2018 the average number of fire incidents per year is 71. The highest number of fire incidents - 148 took place in 2005, and the least - 32 in 2004. The data has a declining trend.
 When looking into fire subcategories, the most reports belonged to: Structure Fires (35.4%), and Outside Fires (32.8%).