Estimated zip code population in 2022: 89,364 Zip code population in 2010: 46,083 Zip code population in 2000: 22,779
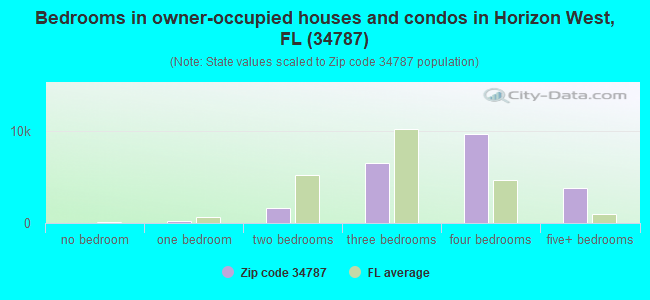
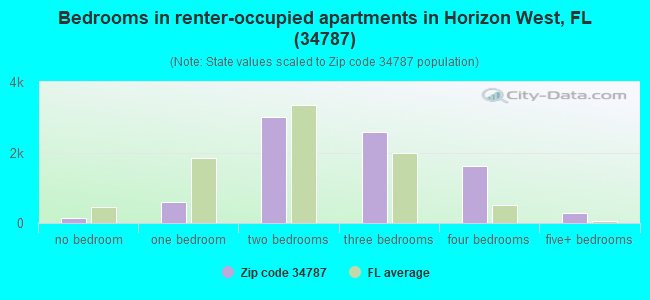
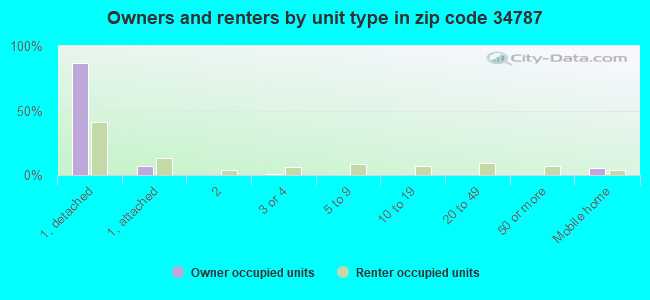
Houses and condos: 31,346 Renter-occupied apartments: 8,250
% of renters here:
28%
State:
33%
March 2022 cost of living index in zip code 34787: 92.9 (less than average, U.S. average is 100)
Land area: 69.1 sq. mi. Water area: 10.5 sq. mi.
Population density: 1,293 people per square mile
(low).
OSM Map
General Map
Google Map
MSN Map
OSM Map
General Map
Google Map
MSN Map
OSM Map
General Map
Google Map
MSN Map
OSM Map
General Map
Google Map
MSN Map
Please wait while loading the map...
Real estate property taxes paid for housing units in 2022:
This zip code:
0.8% ($4,495)
Florida:
0.7% ($2,529)
Median real estate property taxes paid for housing units with mortgages in 2022: $4,726 (0.8%) Median real estate property taxes paid for housing units with no mortgage in 2022: $3,724 (0.9%)
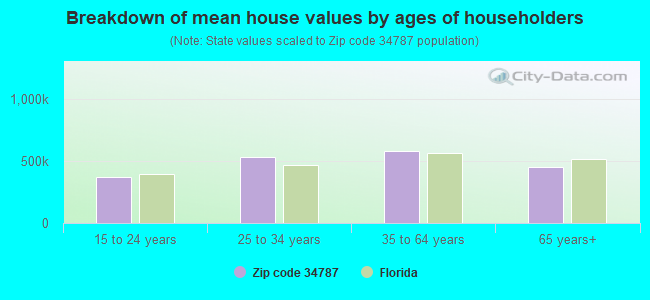
Estimated median house/condo value in 2022: $533,816
34787:
$533,816
Florida:
$354,100
According to our research of Florida and other state lists, there were 41 registered sex offenders living in 34787 zip code as of April 27, 2024. The ratio of all residents to sex offenders in zip code 34787 is 1,382 to 1. The ratio of registered sex offenders to all residents in this zip code is lower than the state average.
Median resident age:
This zip code:
38.0 years
Florida median age:
42.7 years
Average household size:
This zip code:
3.0 people
Florida:
2.5 people
Averages for the 2020 tax year for zip code 34787, filed in 2021:
Average Adjusted Gross Income (AGI) in 2020: $91,015 (Individual Income Tax Returns)
Here:
$91,015
State:
$82,200
Salary/wage: $78,879 (reported on 85.5% of returns)
Here:
$78,879
State:
$58,347
(% of AGI for various income ranges: 1197.8% for AGIs below $25k, 3462.1% for AGIs $25k-50k, 6519.2% for AGIs $50k-75k, 9660.9% for AGIs $75k-100k, 18374.9% for AGIs $100k-200k, 71047.1% for AGIs over 200k)
Taxable interest for individuals: $1,515 (reported on 27.6% of returns)
This zip code:
$1,515
Florida:
$4,272
(% of AGI for various income ranges: 11.5% for AGIs below $25k, 16.8% for AGIs $25k-50k, 35.5% for AGIs $50k-75k, 63.0% for AGIs $75k-100k, 90.3% for AGIs $100k-200k, 525.4% for AGIs over 200k)
Ordinary dividends: $5,031 (reported on 22.2% of returns)
Here:
$5,031
State:
$15,863
(% of AGI for various income ranges: 20.3% for AGIs below $25k, 38.6% for AGIs $25k-50k, 87.1% for AGIs $50k-75k, 116.7% for AGIs $75k-100k, 244.7% for AGIs $100k-200k, 1600.5% for AGIs over 200k)
Net capital gain/loss in AGI: +$20,184 (reported on 21.2% of returns)
Here:
+$20,184
State:
+$62,983
(% of AGI for various income ranges: 11.6% for AGIs below $25k, 41.4% for AGIs $25k-50k, 103.4% for AGIs $50k-75k, 190.2% for AGIs $75k-100k, 519.0% for AGIs $100k-200k, 9455.4% for AGIs over 200k)
Profit/loss from business: +$12,310 (reported on 21.9% of returns)
Here:
+$12,310
State:
+$9,719
(% of AGI for various income ranges: 160.5% for AGIs below $25k, 198.1% for AGIs $25k-50k, 282.6% for AGIs $50k-75k, 332.8% for AGIs $75k-100k, 516.9% for AGIs $100k-200k, 2662.3% for AGIs over 200k)
Taxable individual retirement arrangement distribution: $23,172 (reported on 6.4% of returns)
34787:
$23,172
Florida:
$24,823
(% of AGI for various income ranges: 27.7% for AGIs below $25k, 59.3% for AGIs $25k-50k, 149.2% for AGIs $50k-75k, 280.3% for AGIs $75k-100k, 437.0% for AGIs $100k-200k, 1380.8% for AGIs over 200k)
Self-employed (Keogh) retirement plans: $22,833 (reported on 0.5% of returns)
34787:
$22,833
Florida:
$29,694
(% of AGI for various income ranges: 11.3% for AGIs $50k-75k, 16.0% for AGIs $100k-200k, 230.7% for AGIs over 200k)
Total itemized deductions: $32,968 (reported on 11.5% of returns)
Here:
$32,968
State:
$45,393
(% of AGI for various income ranges: 41.3% for AGIs below $25k, 131.6% for AGIs $25k-50k, 356.8% for AGIs $50k-75k, 486.0% for AGIs $75k-100k, 976.1% for AGIs $100k-200k, 4794.4% for AGIs over 200k)
Charity contributions: $10,485 (reported on 9.3% of returns)
Here:
$10,485
State:
$20,178
(% of AGI for various income ranges: 2.7% for AGIs below $25k, 17.5% for AGIs $25k-50k, 48.9% for AGIs $50k-75k, 88.7% for AGIs $75k-100k, 218.7% for AGIs $100k-200k, 1630.0% for AGIs over 200k)
Taxes paid: $7,098 (reported on 11.4% of returns)
34787:
$7,098
State:
$6,967
(% of AGI for various income ranges: 6.4% for AGIs below $25k, 26.7% for AGIs $25k-50k, 76.9% for AGIs $50k-75k, 107.5% for AGIs $75k-100k, 228.2% for AGIs $100k-200k, 966.1% for AGIs over 200k)
Earned income credit: $2,340 (reported on 13.4% of returns)
Here:
$2,340
State:
$2,306
(% of AGI for various income ranges: 94.9% for AGIs below $25k, 65.7% for AGIs $25k-50k, 1.2% for AGIs $50k-75k)
Percentage of individuals using paid preparers for their 2020 taxes: 93.3%
Here:
93%
State:
92%
(% for various income ranges: 91.4% for AGIs below $25k, 94.0% for AGIs $25k-50k, 92.9% for AGIs $50k-75k, 94.1% for AGIs $75k-100k, 94.2% for AGIs $100k-200k, 95.2% for AGIs over 200k)
Averages for the 2012 tax year for zip code 34787, filed in 2013:
Average Adjusted Gross Income (AGI) in 2012: $58,413 (Individual Income Tax Returns)
Here:
$58,413
State:
$60,316
Salary/wage: $52,793 (reported on 87.9% of returns)
Here:
$52,793
State:
$45,277
(% of AGI for various income ranges: 80.9% for AGIs below $25k, 86.9% for AGIs $25k-50k, 83.6% for AGIs $50k-75k, 84.2% for AGIs $75k-100k, 84.0% for AGIs $100k-200k, 62.0% for AGIs over 200k)
Taxable interest for individuals: $1,214 (reported on 26.0% of returns)
This zip code:
$1,214
Florida:
$3,587
(% of AGI for various income ranges: 0.6% for AGIs below $25k, 0.5% for AGIs $25k-50k, 0.5% for AGIs $50k-75k, 0.3% for AGIs $75k-100k, 0.5% for AGIs $100k-200k, 0.8% for AGIs over 200k)
Ordinary dividends: $4,140 (reported on 17.2% of returns)
Here:
$4,140
State:
$12,831
(% of AGI for various income ranges: 0.8% for AGIs below $25k, 1.0% for AGIs $25k-50k, 0.7% for AGIs $50k-75k, 0.7% for AGIs $75k-100k, 0.9% for AGIs $100k-200k, 2.7% for AGIs over 200k)
Net capital gain/loss in AGI: +$13,140 (reported on 12.6% of returns)
Here:
+$13,140
State:
+$33,493
(% of AGI for various income ranges: 0.2% for AGIs $25k-50k, 0.2% for AGIs $50k-75k, 0.4% for AGIs $75k-100k, 1.0% for AGIs $100k-200k, 11.6% for AGIs over 200k)
Profit/loss from business: +$9,402 (reported on 17.7% of returns)
Here:
+$9,402
State:
+$10,012
(% of AGI for various income ranges: 8.3% for AGIs below $25k, 2.2% for AGIs $25k-50k, 2.3% for AGIs $50k-75k, 2.1% for AGIs $75k-100k, 2.2% for AGIs $100k-200k, 2.6% for AGIs over 200k)
Taxable individual retirement arrangement distribution: $15,557 (reported on 6.4% of returns)
34787:
$15,557
Florida:
$21,544
(% of AGI for various income ranges: 1.6% for AGIs below $25k, 1.4% for AGIs $25k-50k, 1.8% for AGIs $50k-75k, 2.1% for AGIs $75k-100k, 2.1% for AGIs $100k-200k, 1.2% for AGIs over 200k)
Self-employment retirement plans: $14,500 (reported on 0.3% of returns)
34787:
$14,500
Florida:
$20,611
Total itemized deductions: $21,573 (19% of AGI, reported on 31.2% of returns)
Here:
$21,573
State:
$25,533
Here:
19.4% of AGI
State:
18.0% of AGI
(% of AGI for various income ranges: 7.0% for AGIs below $25k, 11.1% for AGIs $25k-50k, 12.8% for AGIs $50k-75k, 13.0% for AGIs $75k-100k, 13.3% for AGIs $100k-200k, 9.5% for AGIs over 200k)
Charity contributions: $4,036 (reported on 25.7% of returns)
Here:
$4,036
State:
$5,698
(% of AGI for various income ranges: 0.6% for AGIs below $25k, 1.2% for AGIs $25k-50k, 1.7% for AGIs $50k-75k, 1.7% for AGIs $75k-100k, 2.0% for AGIs $100k-200k, 2.4% for AGIs over 200k)
Taxes paid: $4,651 (reported on 30.6% of returns)
34787:
$4,651
State:
$6,203
(% of AGI for various income ranges: 1.1% for AGIs below $25k, 1.9% for AGIs $25k-50k, 2.4% for AGIs $50k-75k, 2.7% for AGIs $75k-100k, 3.0% for AGIs $100k-200k, 2.4% for AGIs over 200k)
Earned income credit: $2,490 (reported on 20.4% of returns)
Here:
$2,490
State:
$2,372
(% of AGI for various income ranges: 7.7% for AGIs below $25k, 1.2% for AGIs $25k-50k)
Percentage of individuals using paid preparers for their 2012 taxes: 50.0%
Here:
50%
State:
54%
(% for various income ranges: 49.0% for AGIs below $25k, 47.1% for AGIs $25k-50k, 49.6% for AGIs $50k-75k, 50.3% for AGIs $75k-100k, 53.6% for AGIs $100k-200k, 68.6% for AGIs over 200k)
Averages for the 2004 tax year for zip code 34787, filed in 2005:
Average Adjusted Gross Income (AGI) in 2004: $47,826 (Individual Income Tax Returns)
Here:
$47,826
State:
$50,523
Salary/wage: $42,646 (reported on 89.2% of returns)
Here:
$42,646
State:
$39,563
(% of AGI for various income ranges: 139.8% for AGIs below $10k, 84.2% for AGIs $10k-25k, 87.3% for AGIs $25k-50k, 85.0% for AGIs $50k-75k, 86.8% for AGIs $75k-100k, 68.2% for AGIs over 100k)
Taxable interest for individuals: $1,219 (reported on 38.3% of returns)
This zip code:
$1,219
Florida:
$3,211
(% of AGI for various income ranges: 5.5% for AGIs below $10k, 1.3% for AGIs $10k-25k, 0.7% for AGIs $25k-50k, 0.8% for AGIs $50k-75k, 0.6% for AGIs $75k-100k, 1.1% for AGIs over 100k)
Taxable dividends: $1,641 (reported on 19.4% of returns)
Here:
$1,641
State:
$6,129
(% of AGI for various income ranges: 1.8% for AGIs below $10k, 0.8% for AGIs $10k-25k, 0.6% for AGIs $25k-50k, 0.6% for AGIs $50k-75k, 0.4% for AGIs $75k-100k, 0.7% for AGIs over 100k)
Net capital gain/loss: +$18,056 (reported on 16.3% of returns)
Here:
+$18,056
State:
+$27,205
(% of AGI for various income ranges: -0.3% for AGIs below $10k, 0.3% for AGIs $10k-25k, 0.6% for AGIs $25k-50k, 1.8% for AGIs $50k-75k, 2.0% for AGIs $75k-100k, 13.7% for AGIs over 100k)
Profit/loss from business: +$8,444 (reported on 15.4% of returns)
Here:
+$8,444
State:
+$10,634
(% of AGI for various income ranges: 0.4% for AGIs below $10k, 4.5% for AGIs $10k-25k, 2.9% for AGIs $25k-50k, 2.8% for AGIs $50k-75k, 2.3% for AGIs $75k-100k, 2.4% for AGIs over 100k)
IRA payment deduction: $2,849 (reported on 2.2% of returns)
34787:
$2,849
Florida:
$3,082
(% of AGI for various income ranges: 0.4% for AGIs below $10k, 0.1% for AGIs $10k-25k, 0.2% for AGIs $25k-50k, 0.2% for AGIs $50k-75k, 0.1% for AGIs $75k-100k, 0.1% for AGIs over 100k)
Self-employed pension: $13,083 (reported on 0.3% of returns)
Here:
$13,083
Florida:
$15,857
Total itemized deductions: $18,387 (22% of AGI, reported on 36.4% of returns)
Here:
$18,387
State:
$20,370
Here:
21.6% of AGI
State:
20.7% of AGI
(% of AGI for various income ranges: 18.6% for AGIs below $10k, 10.0% for AGIs $10k-25k, 14.7% for AGIs $25k-50k, 16.8% for AGIs $50k-75k, 16.7% for AGIs $75k-100k, 12.3% for AGIs over 100k)
Charity contributions deductions: $3,383 (4% of AGI, reported on 31.1% of returns)
Here:
$3,383
State:
$4,064
Here:
3.8% of AGI
State:
3.8% of AGI
(% of AGI for various income ranges: 1.3% for AGIs below $10k, 1.1% for AGIs $10k-25k, 1.8% for AGIs $25k-50k, 2.2% for AGIs $50k-75k, 2.6% for AGIs $75k-100k, 2.5% for AGIs over 100k)
Total tax: $7,362 (reported on 73.4% of returns)
34787:
$7,362
State:
$9,431
(% of AGI for various income ranges: 4.2% for AGIs below $10k, 3.7% for AGIs $10k-25k, 6.4% for AGIs $25k-50k, 8.5% for AGIs $50k-75k, 10.0% for AGIs $75k-100k, 17.3% for AGIs over 100k)
Earned income credit: $1,901 (reported on 19.0% of returns)
Here:
$1,901
State:
$1,808
Percentage of individuals using paid preparers for their 2004 taxes: 57.2%
Here:
57%
State:
60%
(% for various income ranges: 54.1% for AGIs below $10k, 59.4% for AGIs $10k-25k, 57.0% for AGIs $25k-50k, 55.1% for AGIs $50k-75k, 54.0% for AGIs $75k-100k, 61.9% for AGIs over 100k)
Likely homosexual households (counted as self-reported same-sex unmarried-partner households)
Lesbian couples: 0.1% of all households
Gay men: 0.4% of all households
Household received Food Stamps/SNAP in the past 12 months: 1,900 Household did not receive Food Stamps/SNAP in the past 12 months: 28,045
Women who had a birth in the past 12 months: 663 (568 now married, 113 unmarried) Women who did not have a birth in the past 12 months: 22,833 (11,842 now married, 11,001 unmarried)
Housing units in zip code 34787 with a mortgage: 15,158 (1,126 second mortgage, 16 home equity loan, 951 both second mortgage and home equity loan) Houses without a mortgage: 80
Median monthly owner costs for units with a mortgage: $2,402 Median monthly owner costs for units without a mortgage: $772
Residents with income below the poverty level in 2022:
This zip code:
8.5%
Whole state:
12.7%
Residents with income below 50% of the poverty level in 2022:
This zip code:
3.7%
Whole state:
6.6%
Median number of rooms in houses and condos:
Here:
7.2
State:
5.9
Median number of rooms in apartments:
Here:
4.9
State:
4.2
Notable locations in this zip code not listed on our city pages
Notable locations in zip code 34787: Hickory Hammock Grove (A), Windermere Golf Center (B), Willowbrook Golf Course (C), Winter Garden Communication Center (D), Orange County Library System West Orange Branch Library (E), Heritage Foundation History Center (F), Winter Garden Heritage Museum (G), Winter Garden Fire Department Station 24 Headquarters (H), Winter Garden Fire Department Station 23 (I), Oakland Police Department (J), Winter Garden Police Department (K), Oakland Police Department (L), Orange County Fire Rescue Department Station 37 (M), Orange County Fire Rescue Department Station 34 (N), Oakland Town Hall (O). Display/hide their locations on the map
Shopping Centers: Tri City Center Shopping Center (1), Winter Gardens Regal Shopping Center (2), Peoples Plaza West Shopping Center (3), Winter Garden Regional Shopping Center (4). Display/hide their locations on the map
Churches in zip code 34787 include: Resurrection Church (A), First Baptist Church of Winter Garden (B), Saint John Lutheran Church (C), Christian Life Fellowship (D), Zion Temple Fire Baptized Holiness Church of God of the Americas (E), Church of Abundant Life (F), First United Methodist Church of Winter Garden (G), Seventh Day Adventist Church (H), First Baptist Church of Oakland (I). Display/hide their locations on the map
Lakes and swamps: Lake Austin (A), Lake Avalon (B), Tub Lake (C), Grass Lake (D), Lake Beulah (E), Black Lake (F), Lake Hancock (G), Lake Hartley (H). Display/hide their locations on the map
18,652 married couples with children.
3,966 single-parent households (1,229 men, 2,737 women).
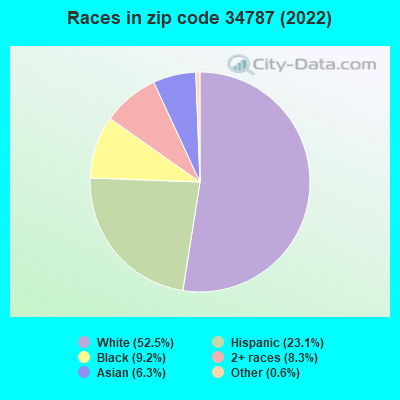
73.6% of residents of 34787 zip code speak English at home.
14.4% of residents speak Spanish at home (59% very well, 9% well, 11% not well, 21% not at all).
8.4% of residents speak other Indo-European language at home (57% very well, 22% well, 20% not well).
3.5% of residents speak Asian or Pacific Island language at home (50% very well, 17% well, 25% not well, 8% not at all).
0.3% of residents speak other language at home (90% very well, 10% well).
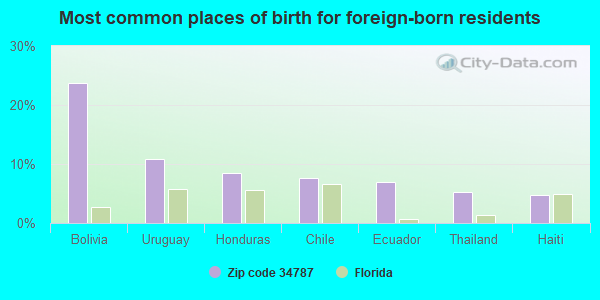
Foreign born population: 19,288 (21.6%) (43.9% of them are naturalized citizens)
This zip code:
21.6%
Whole state:
21.7%
24%Bolivia
11%Uruguay
8%Honduras
8%Chile
7%Ecuador
5%Thailand
5%Haiti
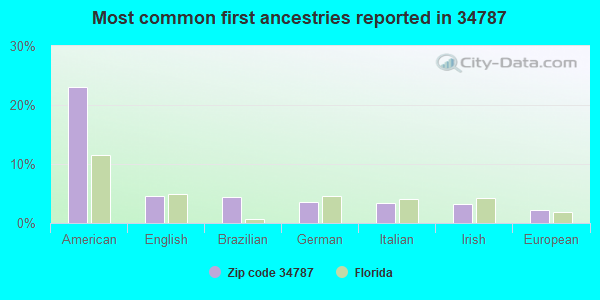
23%American
5%English
4%Brazilian
3%German
3%Italian
3%Irish
2%European
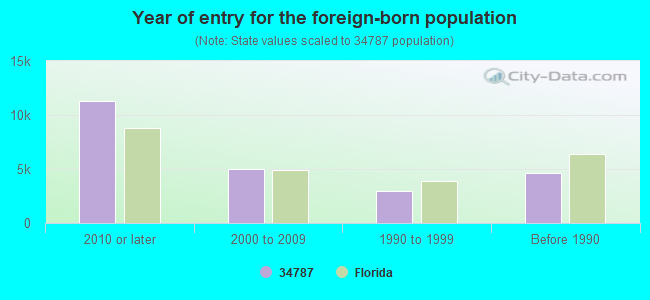
Year of entry for the foreign-born population
11,3232010 or later
4,9802000 to 2009
2,9461990 to 1999
4,602Before 1990
Major facilities with environmental interests located in this zip code:
RANGER CONSTRUCTION INDUSTRIES INC (1200 ELBOC WAY in WINTER GARDEN, FL)
AIR SYNTHETIC MINOR (AIRS/AFS) STATE MASTER (FDM) - WAFR-FLR05B797, NPDES STORMWATER PROGRAM, NPDES STORMWATER PERMIT (Integrated Compliance Information System) - ICIS-04-2000-0187, FORMAL ENFORCEMENT ACTION CRITERIA AND HAZARDOUS AIR POLLUTANT INVENTORY (Inventory of air pollution sources) National Pollutant Discharge Elimination System NON-MAJOR (Tracking pollutant discharge elimination systems) - permit National Pollutant Discharge Elimination System NON-MAJOR (Tracking pollutant discharge elimination systems) - permit (Resource Conservation and Recovery Act (tracking hazardous waste)) Business SIC classification: ASPHALT PAVING MIXTURES AND BLOCKS Organizations: PAVEX CORP DBA RANGER CONSTRUCTION S (CONTACT/APPLICANT)
, TERRY WILER (CONTACT/OWNER)
, JAMES R BOTERF, EXEC VP (CONTACT/OWNER)
, JON CHELLGREN (CONTACT/OWNER)
, HAZEN HINDS (CONTACT/OWNER)
, PAVEX CORP DBA RANGER CONSTRUCTION S (CONTACT/PERMIT)
, NAVEX CORP (CONTACT/PERMIT)
Alternative names: AMERICAN ASPHALT INC, NAVEX CORP, PAVEX CORP, PAVEX PARK, LOTS 5-7, RANGER CONSTRUCTION INDUSTRIES, INC. - WINTER GARDEN ASPHALT
LAKE WHITNEY ELEMENTARY SCHOOL (1351 WINDERMERE ROAD in WINTER GARDEN, FL)
(National Center for Education Statistics) - STATE ID-1571 (National Center for Education Statistics) - STATE ID-0235 Organizations: ORANGE COUNTY SCHOOL DISTRICT (SCHOOL DISTRICT)
CROWN CORK AND SEAL COMPANY INCORPORATED (851 EAST MAPLE STREET in WINTER GARDEN, FL)
AIR MAJOR (AIRS/AFS) SUPERFUND (Superfund database) (Integrated Compliance Information System) - ICIS-04-2001-1762, FORMAL ENFORCEMENT ACTION CRITERIA AND HAZARDOUS AIR POLLUTANT INVENTORY (Inventory of air pollution sources) Small Quantity Generators, between 100 kg and 1000 kg of hazardous waste/month (Resource Conservation and Recovery Act (tracking hazardous waste)) - notification TRI REPORTER (Tracking of toxic chemicals releasing facilities) Business SIC classification: METAL CANS; COATING, ENGRAVING, AND ALLIED SERVICES Business NAICS classification: METAL CAN MANUFACTURING. Organizations: COLLIE TURNER, PLT MGR (CONTACT/OWNER)
Alternative names: CONTINENTAL CAN CO US PLT NO.3, CROWN FOOD PACKAGING
COURTESY COLLISION CENTER (12881 W COLONIAL DR in WINTER GARDEN, FL)
STATE MASTER (FDM) - CHAZ-FLR000049767, HAZARDOUS WASTE REGULATION PROGRAM Small Quantity Generators, between 100 kg and 1000 kg of hazardous waste/month (Resource Conservation and Recovery Act (tracking hazardous waste)) - notification Business SIC classification: TOP, BODY, AND UPHOLSTERY REPAIR SHOPS AND PAINT SHOPS Organizations: BOB & BUCKS BODY SHOP, BOB & BUCKS (CONTACT/OWNER)
, SBR INDUSTRIES (CONTACT/OWNER)
Alternative names: BOB & BUCKS BODY SHOP
LAKEVIEW MIDDLE SCHOOL REPLACE (1200 W BAY ST in WINTER GARDEN, FL)
(National Center for Education Statistics) - STATE ID-0352 National Pollutant Discharge Elimination System NON-MAJOR (Tracking pollutant discharge elimination systems) - permit Organizations: ERIC PALMER (CONTACT/OWNER)
, ORANGE COUNTY SCHOOL DISTRICT (SCHOOL DISTRICT)
LOUIS DREYFUS CITRUS INC (355 NINTH STREET in WINTER GARDEN, FL)
AIR MINOR (AIRS/AFS) CRITERIA AND HAZARDOUS AIR POLLUTANT INVENTORY (Inventory of air pollution sources) National Pollutant Discharge Elimination System NON-MAJOR (Tracking pollutant discharge elimination systems) - permit TRI REPORTER (Tracking of toxic chemicals releasing facilities) Business SIC classification: FROZEN FRUITS, FRUIT JUICES, AND VEGETABLES Organizations: PAUL BALLENTINE (CONTACT/OWNER)
Alternative names: WINTER GARDEN CITRUS INC.
O-TEC WESTSIDE TECH (955 E STOREY RD in WINTER GARDEN, FL)
(National Center for Education Statistics) - STATE ID-5783 Organizations: ORANGE COUNTY SCHOOL DISTRICT (SCHOOL DISTRICT)
AFTER HOURS (14748 W COLONIAL DR in WINTER GARDEN, FL)
AIR MINOR (AIRS/AFS) Small Quantity Generators, between 100 kg and 1000 kg of hazardous waste/month (Resource Conservation and Recovery Act (tracking hazardous waste)) - notification Small Quantity Generators, between 100 kg and 1000 kg of hazardous waste/month (Resource Conservation and Recovery Act (tracking hazardous waste)) - notification Business SIC classification: DRYCLEANING PLANTS, EXCEPT RUG CLEANING Organizations: MITCHELLS MANAGEMENT CORP (CONTACT/OWNER)
Alternative names: MITCHELLS CLEANERS, MITCHELLS FORMAL WEAR
ORLANDO PAVING COMPANY (12601 CR 545 in WINTER GARDEN, FL)
AIR SYNTHETIC MINOR (AIRS/AFS) National Pollutant Discharge Elimination System NON-MAJOR (Tracking pollutant discharge elimination systems) - permit Business SIC classification: ASPHALT PAVING MIXTURES AND BLOCKS Organizations: REGINALD STERNS (CONTACT/OWNER)
Alternative names: ORLANDO PAVING COMPANY TEMP AS
National Pollutant Discharge Elimination System NON-MAJOR (Tracking pollutant discharge elimination systems) - permit Organizations: WALTER BEEMAN (CONTACT/OWNER)
84 LUMBER - PINELOCH INDUSTRIA (150 N WEST CROWN POINT RD in WINTER GARDEN, FL)
National Pollutant Discharge Elimination System NON-MAJOR (Tracking pollutant discharge elimination systems) - permit Organizations: CHRISTINA TORAS (CONTACT/OWNER)
SPNNAKER COVE (STONEYBROOK PKWY/TOWN CENTER R in WINTER GDN, FL)
National Pollutant Discharge Elimination System NON-MAJOR (Tracking pollutant discharge elimination systems) - permit Organizations: WILLIAM GRAHAM (CONTACT/OWNER)
ACME MINI-MART SHORT TERM PETR (515 DILLARD ST in WINTER GARDEN, FL)
National Pollutant Discharge Elimination System NON-MAJOR (Tracking pollutant discharge elimination systems) - permit Organizations: TOMMY WATTS (CONTACT/OWNER)
Housing units lacking complete plumbing facilities: 0.5% Housing units lacking complete kitchen facilities: 0.9%
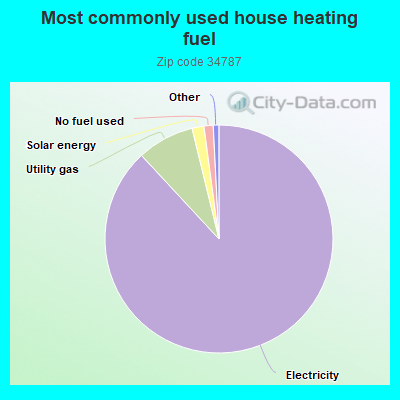
88.1%Electricity
8.1%Utility gas
1.7%Solar energy
1.3%No fuel used
Population in 1990: 18,939. Population change in the 1990s: +3,840 (+20.3%).
Place of birth for U.S.-born residents:
This state: 28,441
Northeast: 13,672
Midwest: 10,150
South: 9,241
West: 4,808
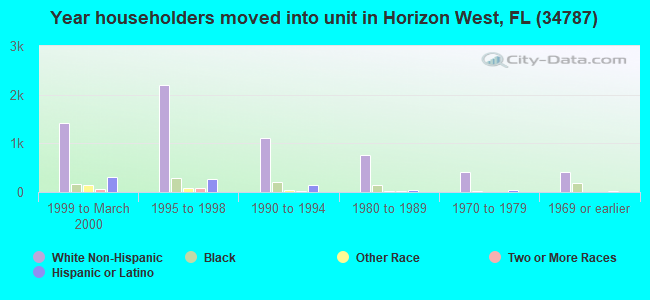
47% of the 34787 zip code residents lived in the same house 5 years ago. Out of people who lived in different houses, 54% lived in this county. Out of people who lived in different counties, 50% lived in Florida.
89% of the 34787 zip code residents lived in the same house 1 year ago. Out of people who lived in different houses, 38% moved from this county. Out of people who lived in different houses, 15% moved from different county within same state. Out of people who lived in different houses, 37% moved from different state. Out of people who lived in different houses, 14% moved from abroad.
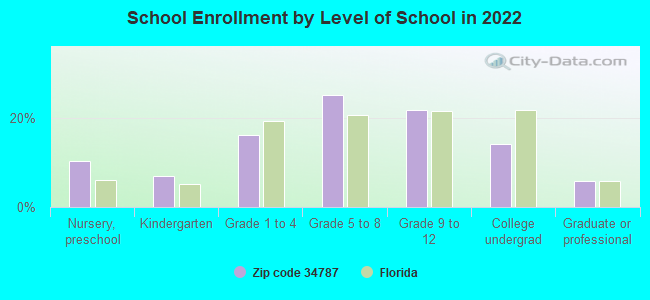
Private vs. public school enrollment:
Students in private schools in grades 1 to 8 (elementary and middle school): 1,075
Here:
10.1%
Florida:
15.8%
Students in private schools in grades 9 to 12 (high school): 706
Here:
12.4%
Florida:
12.9%
Students in private undergraduate colleges: 923
Here:
25.0%
Florida:
23.6%
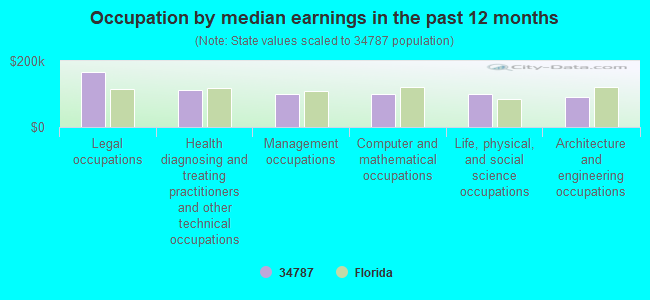
Occupation by median earnings in the past 12 months ($)
165,228Legal occupations
113,480Health diagnosing and treating practitioners and other technical occupations
100,044Management occupations
99,742Computer and mathematical occupations
98,691Life, physical, and social science occupations
92,136Architecture and engineering occupations
Companies with federal contracts located in this zip code:
LOUIS DREYFUS CITRUS INC (355 9TH ST in WINTER GARDEN, FL; small business) : $6,036,502 in 13 contractsfrom 2003 to 2005
Contracts for Fruits and Vegetables, Food Items For Resale by Agricultural Marketing Service, Defense Commissary Agency Signed by year:2000: $0; 2001: $0; 2002: $0; 2003: $1,081,925; 2004: $4,530,970; 2005: $423,607; 2006: $0.
Biggest contracts:
$1,692,943 with Agricultural Marketing Service for Fruits and Vegetables. Signed on 2004-02-17. Completion date: 2004-10-31.
$1,081,925, same as above.Signed on 2003-12-03. Completion date: 2004-04-30.
$1,045,455, same as above.Signed on 2004-01-30. Completion date: 2004-06-30.
$491,724, same as above.Signed on 2004-01-30. Completion date: 2004-06-30.
THE PENTECH GROUP (9448 LAKE HICKORY NUT DRIV in WINTER GARDEN, MD; small business) : $1,772,050 in 12 contractsfrom 2000 to 2006
Contracts for Maintenance, Repair and Rebuilding of Equipment -- Miscellaneous, ADP Systems Analysis Services, Engineering and Technical Services, Other Professional Services, and moreby Air Force Signed by year:2000: $463,680; 2001: $242,242; 2002: $216,516; 2003: $512,052; 2004: $21,111; 2005: $0; 2006: $316,449.
Biggest contracts:
$318,920 with Air Force for Maintenance, Repair and Rebuilding of Equipment -- Miscellaneous. Taking place in UT. Signed on 2000-10-18. Completion date: 2001-10-31.
$316,449 with Air Force for ADP Systems Analysis Services. Taking place in UT. Signed on 2006-05-31. Completion date: 2007-05-31.
$304,164 with Air Force for Engineering and Technical Services. Taking place in UT. Signed on 2003-12-18. Completion date: 2006-12-31.
$242,242 with Air Force for Maintenance, Repair and Rebuilding of Equipment -- Miscellaneous. Signed on 2001-10-24. Completion date: 2002-11-30.
SUPERIOR ACCESS SOLUTIONS, LLC (1318 MARBLE CREST WAY in WINTER GARDEN, FL; small business) : $344,122 in 8 contractsfrom 2004 to 2006
Contracts for Electrical and Electronic Properties Measuring and Testing Instruments, ADP Support Equipment, Miscellaneous Communication Equipment, Maintenance, Repair and Rebuilding of Equipment -- Instruments and Laboratory Equipment, and moreby Navy, NASA, Air Force Signed by year:2000: $0; 2001: $0; 2002: $0; 2003: $0; 2004: $70,707; 2005: $202,708; 2006: $70,707.
Biggest contracts:
$202,708 with Navy for Electrical and Electronic Properties Measuring and Testing Instruments. Signed on 2005-05-02. Completion date: 2005-08-01.
$44,430 with NASA for ADP Support Equipment. Taking place in MN. Signed on 2004-01-09. Completion date: 2004-02-06.
$26,277 with NASA for Miscellaneous Communication Equipment. Taking place in MN. Signed on 2004-08-11. Completion date: 2004-09-27.
$19,584 with Navy for Maintenance, Repair and Rebuilding of Equipment -- Instruments and Laboratory Equipment. Taking place in CA. Signed on 2006-02-01. Completion date: 2006-04-28.
UNITED RENTALS, INC. (1664 E. SPRING RIDGE CIRCL in WINTER GARDEN, FL; small business)
$127,845 with Army for Lease or Rental of Equipment -- Plumbing, Heating, and Waste Disposal Equipment. Taking place in LA. Signed on 1999-10-07. Completion date: 1999-11-23.
CANDELA CONTROLS, INC (711 BUSINESS PARK BLVD , S in WINTER GARDEN, FL; small business)
$25,740 with Air Force for Electric Portable and Hand Lighting Equipment. Signed on 2002-03-22. Completion date: 2002-04-18.
BOB KERRS MARINE TOOL INC (917 W OAKLAND AVENUE in OAKLAND, FL; small business) : $20,748 in 5 contractsfrom 2003 to 2005
Contracts for Miscellaneous Ship and Marine Equipment, Miscellaneous Engine Accessories, Nonaircraft, Tool and Hardware Boxes, Miscellaneous Special Industry Machinery, and moreby Department of Defense, Navy, Air Force Signed by year:2000: $0; 2001: $0; 2002: $0; 2003: $6,203; 2004: $6,250; 2005: $8,295; 2006: $0.
Biggest contracts:
$6,250 with Department of Defense for Miscellaneous Ship and Marine Equipment. Signed on 2004-10-29. Completion date: 2004-12-15.
$5,375 with Navy for Miscellaneous Engine Accessories, Nonaircraft. Taking place in VA. Signed on 2005-09-06. Completion date: 2005-10-13.
$3,253 with Navy for Tool and Hardware Boxes. Signed on 2003-09-19. Completion date: 2003-10-10.
$2,950 with Navy for Miscellaneous Special Industry Machinery. Signed on 2003-02-05. Completion date: 2003-02-26.
C J B ENTERPRISES INC (14040 LAKE TILDEN BLVD in WINTER GARDEN, FL; small business)
$11,682 with Army for Lease or Rental of Equipment -- Ground Effect Vehicles, Motor Vehicles, Trailers, and Cycles. Signed on 2005-07-18. Completion date: 2005-08-12.
CENTRAL SWEEPING SERVICE INC (771 BUSINESS PARK BLVD in WINTER GARDEN, FL; small business) : $10,664 in 4 contractsfrom 2003 to 2006
$3,978 with Army for Maintenance, Repair or Alteration of Real Property -- Airport Runways. Signed on 2004-11-24. Completion date: 2004-10-31.
$3,504, same as above.Signed on 2006-02-05. Completion date: 2007-01-31.
$3,182, same as above.Signed on 2003-11-01. Completion date: 2004-10-31.
$0, same as above.Signed on 2003-11-01. Completion date: 2004-10-31.
MEDTEXX MEDICAL CORPORATION (12200 W COLONIAL DR STE 30 in WINTER GARDEN, FL; small business)
$3,400 with Army for Other Education and Training Services. Signed on 2005-10-04. Completion date: 2005-10-28.
Top industries in this zip code by the number of employees in 2005:
Construction: Water and Sewer Line and Related Structures Construction (250-499 employees: 1 establishment, 10-19 employees: 1 establishment, 1-4 employees: 1 establishment)
Construction: Power and Communication Line and Related Structures Construction (250-499: 1)
2003 - 2018 National Fire Incident Reporting System (NFIRS) incidents
Based on the data from the years 2003 - 2018 the average number of fire incidents per year is 167. The highest number of reported fires - 241 took place in 2006, and the least - 131 in 2010. The data has a decreasing trend.
When looking into fire subcategories, the most reports belonged to: Structure Fires (43.4%), and Outside Fires (32.2%).
Fire incident types reported to NFIRS in Zip Code 34787


 Nearest zip codes: 34786, 34760, 32830, 34734, 34756, 32836.


 Based on the data from the years 2003 - 2018 the average number of fire incidents per year is 167. The highest number of reported fires - 241 took place in 2006, and the least - 131 in 2010. The data has a decreasing trend.
 When looking into fire subcategories, the most reports belonged to: Structure Fires (43.4%), and Outside Fires (32.2%).