Estimated zip code population in 2022: 42,957 Zip code population in 2010: 38,285 Zip code population in 2000: 31,367
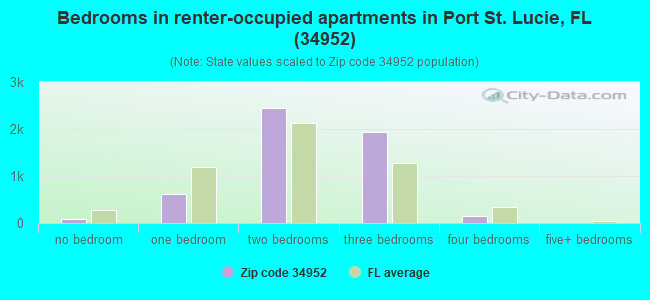
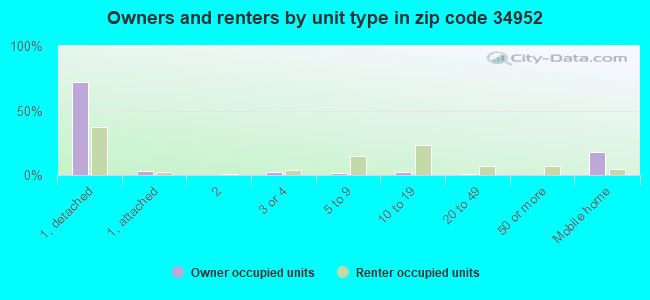
Houses and condos: 22,336 Renter-occupied apartments: 5,297
% of renters here:
29%
State:
33%
March 2022 cost of living index in zip code 34952: 90.4 (less than average, U.S. average is 100)
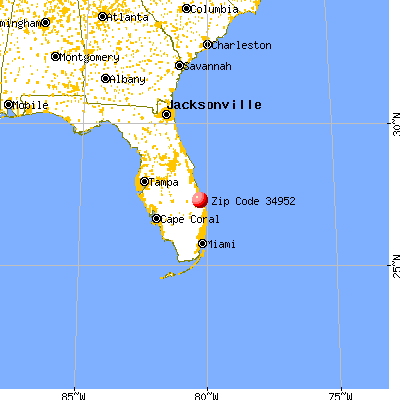
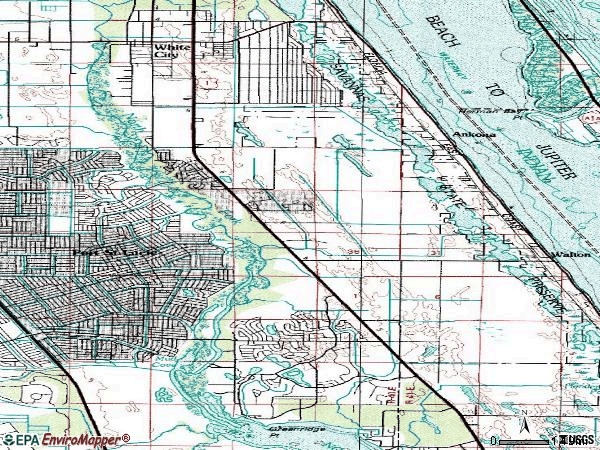
Land area: 23.3 sq. mi. Water area: 1.7 sq. mi.
Population density: 1,846 people per square mile
(low).
OSM Map
General Map
Google Map
MSN Map
OSM Map
General Map
Google Map
MSN Map
OSM Map
General Map
Google Map
MSN Map
OSM Map
General Map
Google Map
MSN Map
Please wait while loading the map...
Real estate property taxes paid for housing units in 2022:
This zip code:
0.8% ($2,258)
Florida:
0.7% ($2,529)
Median real estate property taxes paid for housing units with mortgages in 2022: $2,611 (0.9%) Median real estate property taxes paid for housing units with no mortgage in 2022: $1,936 (0.9%)
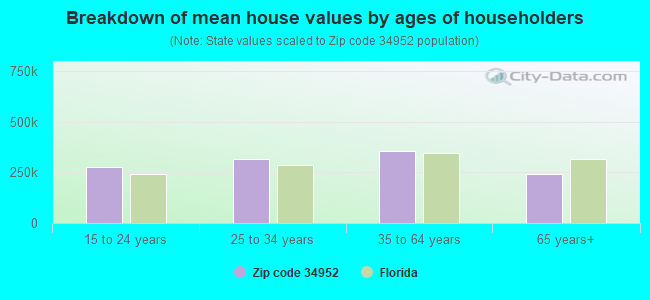
Estimated median house/condo value in 2022: $268,302
34952:
$268,302
Florida:
$354,100
According to our research of Florida and other state lists, there were 40 registered sex offenders living in 34952 zip code as of April 27, 2024. The ratio of all residents to sex offenders in zip code 34952 is 988 to 1. The ratio of registered sex offenders to all residents in this zip code is lower than the state average.
Median resident age:
This zip code:
49.7 years
Florida median age:
42.7 years
Average household size:
This zip code:
2.3 people
Florida:
2.5 people
Averages for the 2020 tax year for zip code 34952, filed in 2021:
Average Adjusted Gross Income (AGI) in 2020: $51,424 (Individual Income Tax Returns)
Here:
$51,424
State:
$82,200
Salary/wage: $41,446 (reported on 72.3% of returns)
Here:
$41,446
State:
$58,347
(% of AGI for various income ranges: 1099.3% for AGIs below $25k, 3468.6% for AGIs $25k-50k, 5984.3% for AGIs $50k-75k, 8173.7% for AGIs $75k-100k, 14127.6% for AGIs $100k-200k, 58856.0% for AGIs over 200k)
Taxable interest for individuals: $1,818 (reported on 23.3% of returns)
This zip code:
$1,818
Florida:
$4,272
(% of AGI for various income ranges: 21.1% for AGIs below $25k, 21.2% for AGIs $25k-50k, 50.7% for AGIs $50k-75k, 91.7% for AGIs $75k-100k, 220.7% for AGIs $100k-200k, 2690.0% for AGIs over 200k)
Ordinary dividends: $5,946 (reported on 17.3% of returns)
Here:
$5,946
State:
$15,863
(% of AGI for various income ranges: 35.4% for AGIs below $25k, 46.5% for AGIs $25k-50k, 132.1% for AGIs $50k-75k, 247.4% for AGIs $75k-100k, 493.5% for AGIs $100k-200k, 7637.0% for AGIs over 200k)
Net capital gain/loss in AGI: +$18,889 (reported on 15.9% of returns)
Here:
+$18,889
State:
+$62,983
(% of AGI for various income ranges: 13.9% for AGIs below $25k, 28.7% for AGIs $25k-50k, 167.5% for AGIs $50k-75k, 290.2% for AGIs $75k-100k, 896.3% for AGIs $100k-200k, 47761.0% for AGIs over 200k)
Profit/loss from business: +$8,057 (reported on 17.3% of returns)
Here:
+$8,057
State:
+$9,719
(% of AGI for various income ranges: 141.9% for AGIs below $25k, 123.5% for AGIs $25k-50k, 184.1% for AGIs $50k-75k, 223.8% for AGIs $75k-100k, 456.0% for AGIs $100k-200k, 4809.0% for AGIs over 200k)
Taxable individual retirement arrangement distribution: $16,922 (reported on 11.8% of returns)
34952:
$16,922
Florida:
$24,823
(% of AGI for various income ranges: 86.5% for AGIs below $25k, 125.3% for AGIs $25k-50k, 318.3% for AGIs $50k-75k, 655.6% for AGIs $75k-100k, 1231.8% for AGIs $100k-200k, 6291.0% for AGIs over 200k)
Self-employed (Keogh) retirement plans: $10,400 (reported on 0.1% of returns)
34952:
$10,400
Florida:
$29,694
(% of AGI for various income ranges: 28.6% for AGIs $75k-100k)
Total itemized deductions: $28,882 (reported on 4.5% of returns)
Here:
$28,882
State:
$45,393
(% of AGI for various income ranges: 42.4% for AGIs below $25k, 101.1% for AGIs $25k-50k, 268.9% for AGIs $50k-75k, 363.1% for AGIs $75k-100k, 613.9% for AGIs $100k-200k, 4916.0% for AGIs over 200k)
Charity contributions: $6,886 (reported on 3.3% of returns)
Here:
$6,886
State:
$20,178
(% of AGI for various income ranges: 1.9% for AGIs below $25k, 13.0% for AGIs $25k-50k, 34.1% for AGIs $50k-75k, 71.0% for AGIs $75k-100k, 118.5% for AGIs $100k-200k, 1598.0% for AGIs over 200k)
Taxes paid: $5,722 (reported on 4.3% of returns)
34952:
$5,722
State:
$6,967
(% of AGI for various income ranges: 5.9% for AGIs below $25k, 17.9% for AGIs $25k-50k, 49.0% for AGIs $50k-75k, 85.6% for AGIs $75k-100k, 137.1% for AGIs $100k-200k, 799.0% for AGIs over 200k)
Earned income credit: $2,145 (reported on 18.4% of returns)
Here:
$2,145
State:
$2,306
(% of AGI for various income ranges: 93.6% for AGIs below $25k, 58.6% for AGIs $25k-50k, 0.8% for AGIs $50k-75k)
Percentage of individuals using paid preparers for their 2020 taxes: 93.2%
Here:
93%
State:
92%
(% for various income ranges: 92.3% for AGIs below $25k, 93.9% for AGIs $25k-50k, 93.8% for AGIs $50k-75k, 93.6% for AGIs $75k-100k, 93.3% for AGIs $100k-200k, 95.0% for AGIs over 200k)
Averages for the 2012 tax year for zip code 34952, filed in 2013:
Average Adjusted Gross Income (AGI) in 2012: $42,952 (Individual Income Tax Returns)
Here:
$42,952
State:
$60,316
Salary/wage: $33,777 (reported on 72.0% of returns)
Here:
$33,777
State:
$45,277
(% of AGI for various income ranges: 65.7% for AGIs below $25k, 69.4% for AGIs $25k-50k, 61.4% for AGIs $50k-75k, 57.2% for AGIs $75k-100k, 55.3% for AGIs $100k-200k, 26.9% for AGIs over 200k)
Taxable interest for individuals: $2,347 (reported on 30.7% of returns)
This zip code:
$2,347
Florida:
$3,587
(% of AGI for various income ranges: 2.3% for AGIs below $25k, 1.0% for AGIs $25k-50k, 1.4% for AGIs $50k-75k, 1.5% for AGIs $75k-100k, 1.6% for AGIs $100k-200k, 2.5% for AGIs over 200k)
Ordinary dividends: $7,199 (reported on 20.6% of returns)
Here:
$7,199
State:
$12,831
(% of AGI for various income ranges: 2.4% for AGIs below $25k, 1.9% for AGIs $25k-50k, 2.1% for AGIs $50k-75k, 2.9% for AGIs $75k-100k, 3.6% for AGIs $100k-200k, 8.4% for AGIs over 200k)
Net capital gain/loss in AGI: +$12,601 (reported on 16.4% of returns)
Here:
+$12,601
State:
+$33,493
(% of AGI for various income ranges: 0.2% for AGIs $25k-50k, 0.7% for AGIs $50k-75k, 1.2% for AGIs $75k-100k, 2.4% for AGIs $100k-200k, 25.5% for AGIs over 200k)
Profit/loss from business: +$9,323 (reported on 13.7% of returns)
Here:
+$9,323
State:
+$10,012
(% of AGI for various income ranges: 7.8% for AGIs below $25k, 2.5% for AGIs $25k-50k, 1.5% for AGIs $50k-75k, 1.4% for AGIs $75k-100k, 1.8% for AGIs $100k-200k, 3.5% for AGIs over 200k)
Taxable individual retirement arrangement distribution: $15,136 (reported on 15.0% of returns)
34952:
$15,136
Florida:
$21,544
(% of AGI for various income ranges: 4.8% for AGIs below $25k, 3.6% for AGIs $25k-50k, 4.4% for AGIs $50k-75k, 6.2% for AGIs $75k-100k, 7.1% for AGIs $100k-200k, 6.4% for AGIs over 200k)
Self-employment retirement plans: $11,700 (reported on 0.2% of returns)
34952:
$11,700
Florida:
$20,611
Total itemized deductions: $20,203 (23% of AGI, reported on 20.2% of returns)
Here:
$20,203
State:
$25,533
Here:
22.9% of AGI
State:
18.0% of AGI
(% of AGI for various income ranges: 8.3% for AGIs below $25k, 9.5% for AGIs $25k-50k, 10.5% for AGIs $50k-75k, 10.8% for AGIs $75k-100k, 10.3% for AGIs $100k-200k, 7.6% for AGIs over 200k)
Charity contributions: $3,449 (reported on 16.2% of returns)
Here:
$3,449
State:
$5,698
(% of AGI for various income ranges: 0.6% for AGIs below $25k, 0.9% for AGIs $25k-50k, 1.1% for AGIs $50k-75k, 1.3% for AGIs $75k-100k, 1.4% for AGIs $100k-200k, 2.6% for AGIs over 200k)
Taxes paid: $4,623 (reported on 19.6% of returns)
34952:
$4,623
State:
$6,203
(% of AGI for various income ranges: 1.4% for AGIs below $25k, 1.7% for AGIs $25k-50k, 2.0% for AGIs $50k-75k, 2.3% for AGIs $75k-100k, 2.6% for AGIs $100k-200k, 2.8% for AGIs over 200k)
Earned income credit: $2,153 (reported on 21.2% of returns)
Here:
$2,153
State:
$2,372
(% of AGI for various income ranges: 5.9% for AGIs below $25k, 1.0% for AGIs $25k-50k)
Percentage of individuals using paid preparers for their 2012 taxes: 52.3%
Here:
52%
State:
54%
(% for various income ranges: 49.7% for AGIs below $25k, 50.4% for AGIs $25k-50k, 55.8% for AGIs $50k-75k, 58.3% for AGIs $75k-100k, 63.3% for AGIs $100k-200k, 80.0% for AGIs over 200k)
Averages for the 2004 tax year for zip code 34952, filed in 2005:
Average Adjusted Gross Income (AGI) in 2004: $39,044 (Individual Income Tax Returns)
Here:
$39,044
State:
$50,523
Salary/wage: $31,323 (reported on 72.3% of returns)
Here:
$31,323
State:
$39,563
(% of AGI for various income ranges: 101.3% for AGIs below $10k, 64.4% for AGIs $10k-25k, 68.5% for AGIs $25k-50k, 64.6% for AGIs $50k-75k, 61.8% for AGIs $75k-100k, 37.0% for AGIs over 100k)
Taxable interest for individuals: $3,132 (reported on 45.3% of returns)
This zip code:
$3,132
Florida:
$3,211
(% of AGI for various income ranges: 10.7% for AGIs below $10k, 3.9% for AGIs $10k-25k, 2.4% for AGIs $25k-50k, 2.4% for AGIs $50k-75k, 2.3% for AGIs $75k-100k, 5.6% for AGIs over 100k)
Taxable dividends: $3,419 (reported on 28.3% of returns)
Here:
$3,419
State:
$6,129
(% of AGI for various income ranges: 10.4% for AGIs below $10k, 2.8% for AGIs $10k-25k, 2.0% for AGIs $25k-50k, 1.9% for AGIs $50k-75k, 1.8% for AGIs $75k-100k, 3.0% for AGIs over 100k)
Net capital gain/loss: +$13,123 (reported on 19.9% of returns)
Here:
+$13,123
State:
+$27,205
(% of AGI for various income ranges: 8.0% for AGIs below $10k, 1.2% for AGIs $10k-25k, 1.1% for AGIs $25k-50k, 1.9% for AGIs $50k-75k, 4.4% for AGIs $75k-100k, 18.4% for AGIs over 100k)
Profit/loss from business: +$10,752 (reported on 12.7% of returns)
Here:
+$10,752
State:
+$10,634
(% of AGI for various income ranges: 9.4% for AGIs below $10k, 4.1% for AGIs $10k-25k, 2.3% for AGIs $25k-50k, 1.9% for AGIs $50k-75k, 3.3% for AGIs $75k-100k, 5.0% for AGIs over 100k)
IRA payment deduction: $3,083 (reported on 2.5% of returns)
34952:
$3,083
Florida:
$3,082
(% of AGI for various income ranges: 0.4% for AGIs below $10k, 0.2% for AGIs $10k-25k, 0.2% for AGIs $25k-50k, 0.2% for AGIs $50k-75k, 0.2% for AGIs $75k-100k, 0.1% for AGIs over 100k)
Self-employed pension: $13,446 (reported on 0.4% of returns)
Here:
$13,446
Florida:
$15,857
Total itemized deductions: $17,431 (26% of AGI, reported on 29.3% of returns)
Here:
$17,431
State:
$20,370
Here:
25.8% of AGI
State:
20.7% of AGI
(% of AGI for various income ranges: 23.3% for AGIs below $10k, 14.2% for AGIs $10k-25k, 14.3% for AGIs $25k-50k, 14.5% for AGIs $50k-75k, 14.3% for AGIs $75k-100k, 9.4% for AGIs over 100k)
Charity contributions deductions: $2,409 (3% of AGI, reported on 24.9% of returns)
Here:
$2,409
State:
$4,064
Here:
3.3% of AGI
State:
3.8% of AGI
(% of AGI for various income ranges: 1.2% for AGIs below $10k, 1.1% for AGIs $10k-25k, 1.4% for AGIs $25k-50k, 1.6% for AGIs $50k-75k, 1.8% for AGIs $75k-100k, 1.7% for AGIs over 100k)
Total tax: $5,841 (reported on 72.9% of returns)
34952:
$5,841
State:
$9,431
(% of AGI for various income ranges: 3.4% for AGIs below $10k, 3.6% for AGIs $10k-25k, 6.6% for AGIs $25k-50k, 9.0% for AGIs $50k-75k, 11.1% for AGIs $75k-100k, 19.9% for AGIs over 100k)
Earned income credit: $1,681 (reported on 15.2% of returns)
Here:
$1,681
State:
$1,808
Percentage of individuals using paid preparers for their 2004 taxes: 60.5%
Here:
61%
State:
60%
(% for various income ranges: 55.0% for AGIs below $10k, 60.3% for AGIs $10k-25k, 59.6% for AGIs $25k-50k, 63.9% for AGIs $50k-75k, 62.8% for AGIs $75k-100k, 76.3% for AGIs over 100k)
Likely homosexual households (counted as self-reported same-sex unmarried-partner households)
Lesbian couples: 0.1% of all households
Gay men: 0.3% of all households
Household received Food Stamps/SNAP in the past 12 months: 2,448 Household did not receive Food Stamps/SNAP in the past 12 months: 16,025
Women who had a birth in the past 12 months: 282 (151 now married, 126 unmarried) Women who did not have a birth in the past 12 months: 8,277 (2,817 now married, 5,458 unmarried)
Housing units in zip code 34952 with a mortgage: 6,070 (389 second mortgage, 23 home equity loan, 327 both second mortgage and home equity loan) Houses without a mortgage: 223
Median monthly owner costs for units with a mortgage: $1,522 Median monthly owner costs for units without a mortgage: $577
Residents with income below the poverty level in 2022:
This zip code:
12.3%
Whole state:
12.7%
Residents with income below 50% of the poverty level in 2022:
This zip code:
7.4%
Whole state:
6.6%
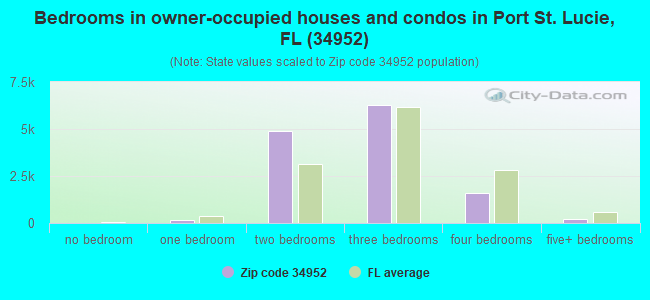
Median number of rooms in houses and condos:
Here:
5.9
State:
5.9
Median number of rooms in apartments:
Here:
5.2
State:
4.2
Notable locations in this zip code not listed on our city pages
Notable locations in zip code 34952: Springtree Country Club (A), Saint Lucie County Library System Morningside Branch Library (B), Saint Lucie County Fire District Station 5 (C), Saint Lucie County Fire District Station 12 (D), Port Saint Lucie Volunteer Ambulance (E), Port Saint Lucie Civic Center (F). Display/hide their locations on the map
Churches in zip code 34952 include: Walton Road Baptist Church (A), United Pentecostal Church (B), Morningside Church (C), Holy Family Catholic Church (D), Holy Faith Episcopal Church (E), Heritage Baptist Church (F), Fort Pierce Christian Centers (G), First Presbyterian Church of Port Saint Lucie (H), Berean Church of God (I). Display/hide their locations on the map
Tourist attractions (not listed on the city page) : Bingo Emporium (Amusement & Theme Parks; 8441 South USHighway 1) (1), Airport & Limo Connection (Tours & Charters; 2717 SE Morningside Blvd) (2). Display/hide their approximate locations on the map
3,394 married couples with children.
2,580 single-parent households (896 men, 1,684 women).
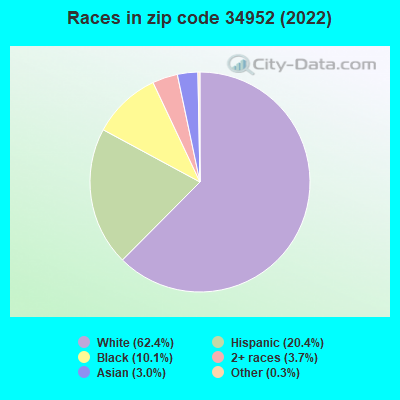
76.5% of residents of 34952 zip code speak English at home.
15.7% of residents speak Spanish at home (74% very well, 9% well, 14% not well, 3% not at all).
5.0% of residents speak other Indo-European language at home (74% very well, 20% well, 3% not well, 2% not at all).
2.5% of residents speak Asian or Pacific Island language at home (71% very well, 11% well, 14% not well, 3% not at all).
0.4% of residents speak other language at home (91% very well, 7% well, 3% not well).
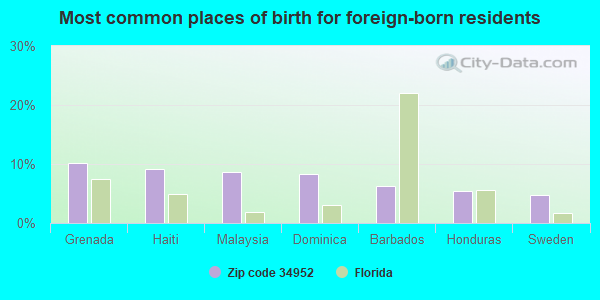
Foreign born population: 7,434 (17.3%) (62.6% of them are naturalized citizens)
This zip code:
17.3%
Whole state:
21.7%
10%Grenada
9%Haiti
9%Malaysia
8%Dominica
6%Barbados
5%Honduras
5%Sweden
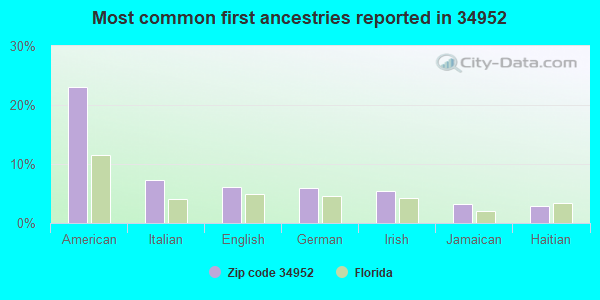
23%American
7%Italian
6%English
6%German
5%Irish
3%Jamaican
3%Haitian
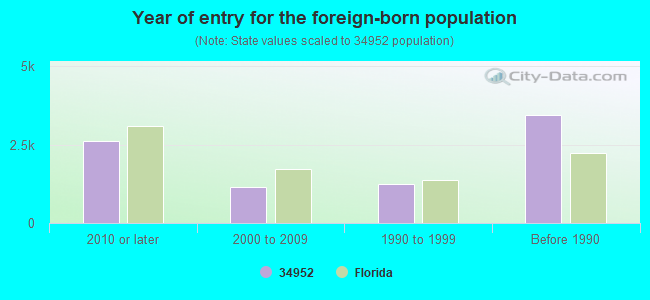
Year of entry for the foreign-born population
2,6042010 or later
1,1472000 to 2009
1,2491990 to 1999
3,446Before 1990
Major facilities with environmental interests located in this zip code:
MORNINGSIDE ELEMENTARY SCHOOL (2300 SE GOWIN DR in PORT ST. LUCIE, FL)
(Geographic Names Information System) (National Center for Education Statistics) - STATE ID-0221 Organizations: ST. LUCIE COUNTY SCHOOL DISTRICT (SCHOOL DISTRICT)
PORT ST. LUCIE HIGH SCHOOL (1201 SE LENNARD RD in PORT ST. LUCIE, FL)
(National Center for Education Statistics) - STATE ID-0301 Organizations: ST. LUCIE COUNTY SCHOOL DISTRICT (SCHOOL DISTRICT)
MARIPOSA ELEMENTARY SCHOOL (2620 SE MARIPOSA AVE in PORT ST. LUCIE, FL)
(National Center for Education Statistics) - STATE ID-0341 Organizations: ST. LUCIE COUNTY SCHOOL DISTRICT (SCHOOL DISTRICT)
SAVANNA RIDGE ELEMENTARY SCHOOL (6801 LENNARD ROAD in PORT ST. LUCIE, FL)
(National Center for Education Statistics) - STATE ID-0091 Organizations: ST. LUCIE COUNTY SCHOOL DISTRICT (SCHOOL DISTRICT)
SOUTHPORT MIDDLE SCHOOL (2420 SE MORNINGSIDE BLVD in PORT ST. LUCIE, FL)
(National Center for Education Statistics) - STATE ID-0331 Organizations: ST. LUCIE COUNTY SCHOOL DISTRICT (SCHOOL DISTRICT)
CUMBERLAND FARMS #1097 (1498 SE LENNARD in PORT ST LUCIE, FL)
National Pollutant Discharge Elimination System NON-MAJOR (Tracking pollutant discharge elimination systems) - permit Small Quantity Generators, between 100 kg and 1000 kg of hazardous waste/month (Resource Conservation and Recovery Act (tracking hazardous waste)) - notification Business SIC classification: GASOLINE SERVICE STATIONS Organizations: JOYCE SCHULTZ, DEALER (CONTACT/OWNER)
, DONNA POLLEYS (CONTACT/OWNER)
Alternative names: SPEEDWAY #6886
DECO CLEANERS LLC (6666 S US HWY 1 in PORT ST LUCIE, FL)
AIR MINOR (AIRS/AFS) Small Quantity Generators, between 100 kg and 1000 kg of hazardous waste/month (Resource Conservation and Recovery Act (tracking hazardous waste)) Business SIC classification: DRYCLEANING PLANTS, EXCEPT RUG CLEANING
SAVANNA CLUB, PHASES 6-8 & LEN (SAVANNA CLUB SUBDIVISION in PORT ST. LUCIE, FL)
National Pollutant Discharge Elimination System NON-MAJOR (Tracking pollutant discharge elimination systems) - permit Organizations: NICK FIDUCCIA (CONTACT/OWNER)
SOUTHPORT WATER REPUMP STATION (2760 SE OVERHILL DR. in PORT ST. LUCIE, FL)
National Pollutant Discharge Elimination System NON-MAJOR (Tracking pollutant discharge elimination systems) - permit Organizations: STEPHEN POLK (CONTACT/OWNER)
SOUTHPORT WWTF (1615 SE SUNSHINE AVE. in PORT ST. LUCIE, FL)
National Pollutant Discharge Elimination System NON-MAJOR (Tracking pollutant discharge elimination systems) - permit Organizations: DONALD COOPER (CONTACT/OWNER)
AIROSO CLEANERS INC (295 SE PORT ST LUCIE BLVD in PORT ST LUCIE, FL)
(Resource Conservation and Recovery Act (tracking hazardous waste)) Organizations: FRIEDLEY EDWARD, PRESIDENT (CONTACT/OWNER)
Alternative names: ALROSO CLEANERS INC
NIEMEYER CENTER (1669 SE NIEMEYER CIRCLE in PORT SAINT LUCIE, FL)
National Pollutant Discharge Elimination System NON-MAJOR (Tracking pollutant discharge elimination systems) - permit Organizations: TERRY SHAHRABANI (CONTACT/OWNER)
ALS CONCRETE SPECIALTIES INCOPORATED (7790 SOUTH US 1 in PORT ST LUCIE, FL)
(Resource Conservation and Recovery Act (tracking hazardous waste)) Business NAICS classification: VITREOUS CHINA, FINE EARTHENWARE, AND OTHER POTTERY PRODUCT MANUFACTURING. Organizations: AL POLIZZI (CONTACT/OWNER)
Housing units lacking complete plumbing facilities: 0.6% Housing units lacking complete kitchen facilities: 0.8%
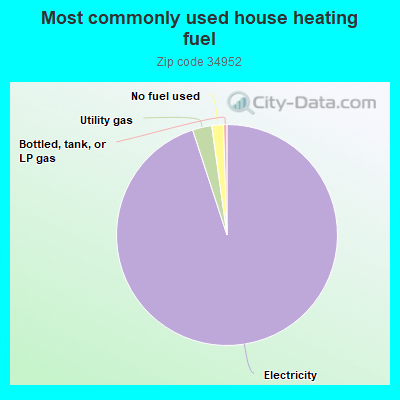
94.6%Electricity
2.8%Utility gas
1.7%No fuel used
0.5%Bottled, tank, or LP gas
Population in 1990: 23,437. Population change in the 1990s: +7,930 (+33.8%).
Place of birth for U.S.-born residents:
This state: 10,989
Northeast: 13,618
Midwest: 4,983
South: 3,280
West: 1,580
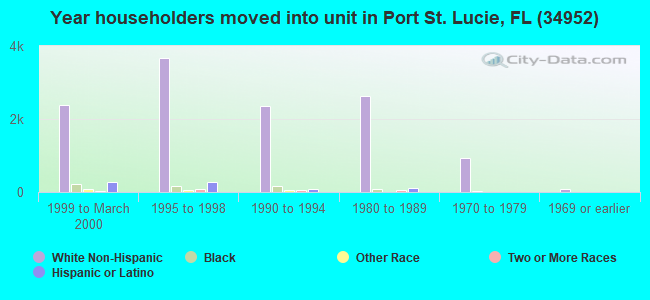
48% of the 34952 zip code residents lived in the same house 5 years ago. Out of people who lived in different houses, 41% lived in this county. Out of people who lived in different counties, 50% lived in Florida.
92% of the 34952 zip code residents lived in the same house 1 year ago. Out of people who lived in different houses, 31% moved from this county. Out of people who lived in different houses, 32% moved from different county within same state. Out of people who lived in different houses, 34% moved from different state. Out of people who lived in different houses, 8% moved from abroad.
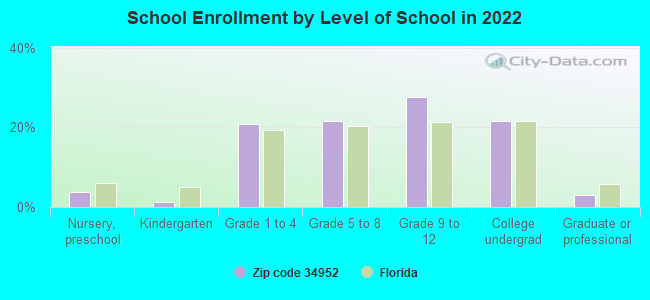
Private vs. public school enrollment:
Students in private schools in grades 1 to 8 (elementary and middle school): 460
Here:
13.8%
Florida:
15.8%
Students in private schools in grades 9 to 12 (high school): 209
Here:
9.6%
Florida:
12.9%
Students in private undergraduate colleges: 601
Here:
34.9%
Florida:
23.6%
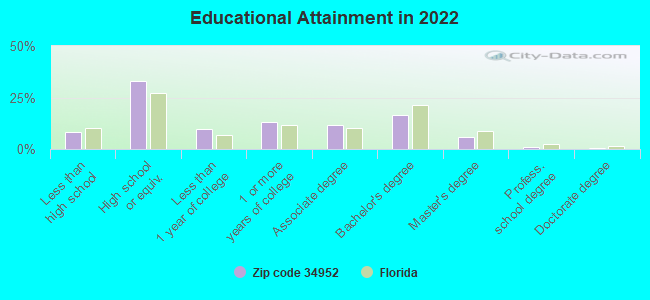
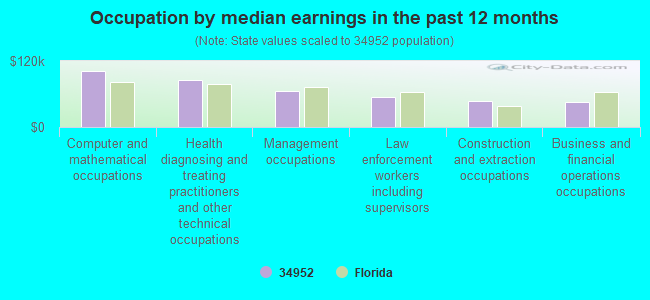
Occupation by median earnings in the past 12 months ($)
102,420Computer and mathematical occupations
84,682Health diagnosing and treating practitioners and other technical occupations
65,171Management occupations
54,762Law enforcement workers including supervisors
46,810Construction and extraction occupations
45,446Business and financial operations occupations
Companies with federal contracts located in this zip code:
SOLSTICE TECHNOLOGIES INC (10302 S FEDERAL HWY # 336 in PORT SAINT LUC, FL) : $81,322 in 5 contractsfrom 2004 to 2005
Contracts for ADP Central Processing Unit (CPU, Computer), Digital, ADP Software, ADP Support Equipment, Video Recording and Reproducing Equipment by Navy, Federal Technology Service, Department of State, Army, and others Signed by year:2000: $0; 2001: $0; 2002: $0; 2003: $0; 2004: $44,492; 2005: $36,830; 2006: $0.
Biggest contracts:
$37,830 with Navy for ADP Central Processing Unit (CPU, Computer), Digital. Signed on 2005-08-25. Completion date: 2005-09-19.
$24,834 with Federal Technology Service for ADP Software. Signed on 2004-08-03. Completion date: 2004-08-26.
$12,659 with Department of State for ADP Support Equipment. Signed on 2004-07-08. Completion date: 2004-07-08.
$6,999 with Army for Video Recording and Reproducing Equipment. Signed on 2004-08-05. Completion date: 2004-09-15.
C & L TOOL & DIE INC (1702 SE VILLAGE GREEN DR in PORT SAINT LUC, FL; small business) : $21,945 in 3 contractsfrom 2005 to 2006
$12,245 with Army for Coil, Flat, Leaf, and Wire Springs. Signed on 2005-08-03. Completion date: 2011-06-30.
$10,000, same as above.Signed on 2005-11-22. Completion date: 2011-06-30.
-$300, same as above.Signed on 2006-03-23. Completion date: 2011-06-30.
ENVIROSEAL CORPORATION (1019 SE HOLBROOK CT in PORT SAINT LUC, FL; small business)
$3,020 with Army for Chemicals. Signed on 2003-05-14. Completion date: 2003-06-02.
Top industries in this zip code by the number of employees in 2005:
Health Care and Social Assistance: Nursing Care Facilities (100-249 employees: 5 establishments)
Health Care and Social Assistance: Offices of Physicians (except Mental Health Specialists) (100-249: 1, 50-99: 1, 20-49: 4, 10-19: 10, 5-9: 26, 1-4: 24)
Health Care and Social Assistance: General Medical and Surgical Hospitals (500-999: 1)
Administrative and Support and Waste Management and Remediation Services: Temporary Help Services (250-499: 1, 100-249: 1, 50-99: 1, 20-49: 1, 1-4: 1)
2002 - 2018 National Fire Incident Reporting System (NFIRS) incidents
Based on the data from the years 2002 - 2018 the average number of fire incidents per year is 69. The highest number of reported fires - 121 took place in 2003, and the least - 1 in 2009. The data has an increasing trend.
When looking into fire subcategories, the most reports belonged to: Outside Fires (57.0%), and Structure Fires (24.7%).
Fire incident types reported to NFIRS in Zip Code 34952


 Nearest zip codes: 34984, 34983, 34957, 34982, 34953, 34994.
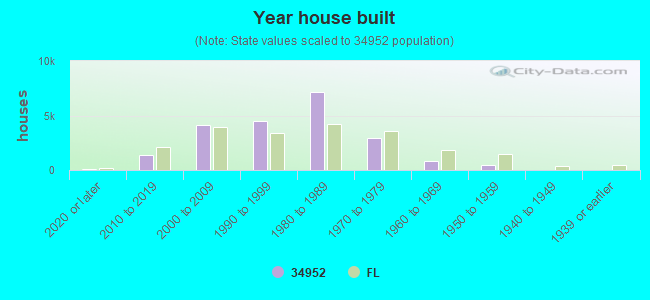


 Based on the data from the years 2002 - 2018 the average number of fire incidents per year is 69. The highest number of reported fires - 121 took place in 2003, and the least - 1 in 2009. The data has an increasing trend.
 When looking into fire subcategories, the most reports belonged to: Outside Fires (57.0%), and Structure Fires (24.7%).