Estimated zip code population in 2022: 23,158 Zip code population in 2010: 22,257 Zip code population in 2000: 19,161
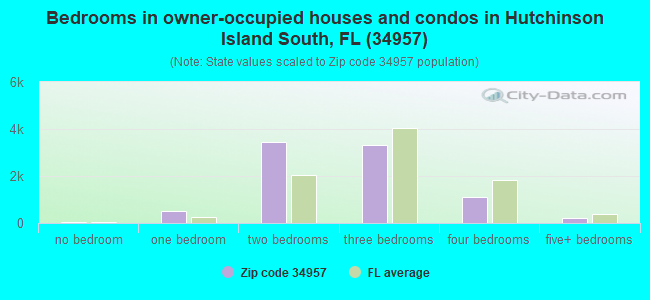
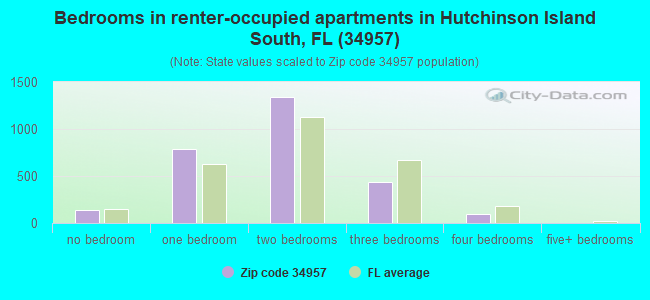
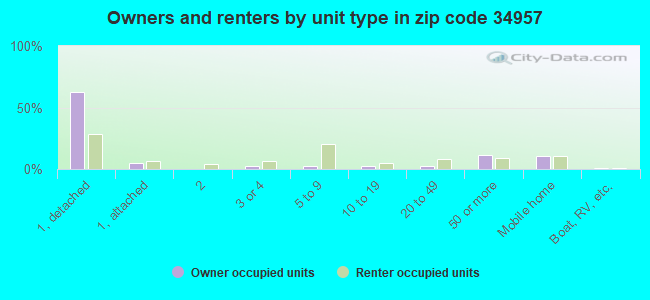
Houses and condos: 17,681 Renter-occupied apartments: 2,776
% of renters here:
24%
State:
33%
March 2022 cost of living index in zip code 34957: 91.8 (less than average, U.S. average is 100)
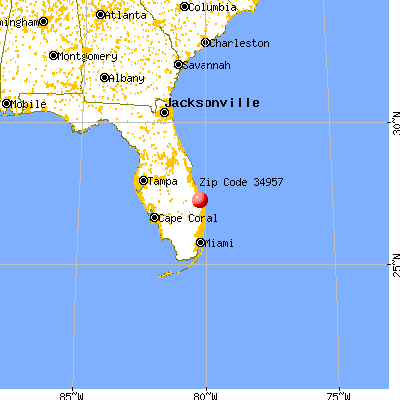
Land area: 16.4 sq. mi. Water area: 18.8 sq. mi.
Population density: 1,409 people per square mile
(low).
OSM Map
General Map
Google Map
MSN Map
OSM Map
General Map
Google Map
MSN Map
OSM Map
General Map
Google Map
MSN Map
OSM Map
General Map
Google Map
MSN Map
Please wait while loading the map...
Real estate property taxes paid for housing units in 2022:
This zip code:
0.8% ($3,386)
Florida:
0.7% ($2,529)
Median real estate property taxes paid for housing units with mortgages in 2022: $3,867 (0.8%) Median real estate property taxes paid for housing units with no mortgage in 2022: $3,095 (0.8%)
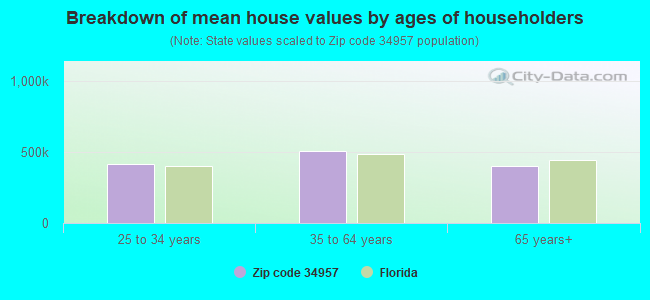
Estimated median house/condo value in 2022: $420,630
34957:
$420,630
Florida:
$354,100
According to our research of Florida and other state lists, there were 21 registered sex offenders living in 34957 zip code as of April 27, 2024. The ratio of all residents to sex offenders in zip code 34957 is 1,066 to 1. The ratio of registered sex offenders to all residents in this zip code is lower than the state average.
Median resident age:
This zip code:
58.6 years
Florida median age:
42.7 years
Average household size:
This zip code:
2.0 people
Florida:
2.5 people
Averages for the 2020 tax year for zip code 34957, filed in 2021:
Average Adjusted Gross Income (AGI) in 2020: $116,181 (Individual Income Tax Returns)
Here:
$116,181
State:
$82,200
Salary/wage: $66,425 (reported on 64.2% of returns)
Here:
$66,425
State:
$58,347
(% of AGI for various income ranges: 1085.1% for AGIs below $25k, 3240.6% for AGIs $25k-50k, 5534.7% for AGIs $50k-75k, 8004.5% for AGIs $75k-100k, 14765.9% for AGIs $100k-200k, 74693.8% for AGIs over 200k)
Taxable interest for individuals: $3,940 (reported on 38.9% of returns)
This zip code:
$3,940
Florida:
$4,272
(% of AGI for various income ranges: 39.4% for AGIs below $25k, 65.2% for AGIs $25k-50k, 132.4% for AGIs $50k-75k, 225.5% for AGIs $75k-100k, 429.5% for AGIs $100k-200k, 3910.4% for AGIs over 200k)
Ordinary dividends: $12,478 (reported on 33.6% of returns)
Here:
$12,478
State:
$15,863
(% of AGI for various income ranges: 85.6% for AGIs below $25k, 142.1% for AGIs $25k-50k, 331.1% for AGIs $50k-75k, 608.1% for AGIs $75k-100k, 1264.8% for AGIs $100k-200k, 10958.8% for AGIs over 200k)
Net capital gain/loss in AGI: +$69,986 (reported on 31.9% of returns)
Here:
+$69,986
State:
+$62,983
(% of AGI for various income ranges: 24.2% for AGIs below $25k, 73.8% for AGIs $25k-50k, 275.4% for AGIs $50k-75k, 495.2% for AGIs $75k-100k, 1817.1% for AGIs $100k-200k, 100893.8% for AGIs over 200k)
Profit/loss from business: +$16,982 (reported on 17.0% of returns)
Here:
+$16,982
State:
+$9,719
(% of AGI for various income ranges: 169.2% for AGIs below $25k, 200.2% for AGIs $25k-50k, 274.2% for AGIs $50k-75k, 432.4% for AGIs $75k-100k, 820.6% for AGIs $100k-200k, 5695.4% for AGIs over 200k)
Taxable individual retirement arrangement distribution: $26,193 (reported on 18.4% of returns)
34957:
$26,193
Florida:
$24,823
(% of AGI for various income ranges: 116.8% for AGIs below $25k, 244.9% for AGIs $25k-50k, 596.9% for AGIs $50k-75k, 1053.5% for AGIs $75k-100k, 2175.4% for AGIs $100k-200k, 7184.2% for AGIs over 200k)
Self-employed (Keogh) retirement plans: $41,125 (reported on 0.7% of returns)
34957:
$41,125
Florida:
$29,694
(% of AGI for various income ranges: 9.5% for AGIs below $25k, 74.2% for AGIs $100k-200k, 979.2% for AGIs over 200k)
Total itemized deductions: $38,343 (reported on 9.7% of returns)
Here:
$38,343
State:
$45,393
(% of AGI for various income ranges: 106.0% for AGIs below $25k, 201.4% for AGIs $25k-50k, 345.8% for AGIs $50k-75k, 594.7% for AGIs $75k-100k, 1170.2% for AGIs $100k-200k, 8293.8% for AGIs over 200k)
Charity contributions: $13,800 (reported on 8.0% of returns)
Here:
$13,800
State:
$20,178
(% of AGI for various income ranges: 4.6% for AGIs below $25k, 22.5% for AGIs $25k-50k, 41.6% for AGIs $50k-75k, 84.5% for AGIs $75k-100k, 239.2% for AGIs $100k-200k, 3955.0% for AGIs over 200k)
Taxes paid: $7,500 (reported on 9.4% of returns)
34957:
$7,500
State:
$6,967
(% of AGI for various income ranges: 18.2% for AGIs below $25k, 35.3% for AGIs $25k-50k, 74.7% for AGIs $50k-75k, 131.1% for AGIs $75k-100k, 270.4% for AGIs $100k-200k, 1350.4% for AGIs over 200k)
Earned income credit: $1,795 (reported on 10.9% of returns)
Here:
$1,795
State:
$2,306
(% of AGI for various income ranges: 69.0% for AGIs below $25k, 38.0% for AGIs $25k-50k)
Percentage of individuals using paid preparers for their 2020 taxes: 92.1%
Here:
92%
State:
92%
(% for various income ranges: 90.8% for AGIs below $25k, 92.8% for AGIs $25k-50k, 92.1% for AGIs $50k-75k, 92.2% for AGIs $75k-100k, 92.8% for AGIs $100k-200k, 93.4% for AGIs over 200k)
Averages for the 2012 tax year for zip code 34957, filed in 2013:
Average Adjusted Gross Income (AGI) in 2012: $66,370 (Individual Income Tax Returns)
Here:
$66,370
State:
$60,316
Salary/wage: $47,854 (reported on 66.2% of returns)
Here:
$47,854
State:
$45,277
(% of AGI for various income ranges: 59.0% for AGIs below $25k, 63.0% for AGIs $25k-50k, 51.9% for AGIs $50k-75k, 50.2% for AGIs $75k-100k, 53.3% for AGIs $100k-200k, 32.3% for AGIs over 200k)
Taxable interest for individuals: $3,428 (reported on 42.8% of returns)
This zip code:
$3,428
Florida:
$3,587
(% of AGI for various income ranges: 2.8% for AGIs below $25k, 1.8% for AGIs $25k-50k, 2.1% for AGIs $50k-75k, 1.9% for AGIs $75k-100k, 1.9% for AGIs $100k-200k, 2.7% for AGIs over 200k)
Ordinary dividends: $10,020 (reported on 32.9% of returns)
Here:
$10,020
State:
$12,831
(% of AGI for various income ranges: 5.5% for AGIs below $25k, 3.4% for AGIs $25k-50k, 3.7% for AGIs $50k-75k, 3.6% for AGIs $75k-100k, 4.6% for AGIs $100k-200k, 6.8% for AGIs over 200k)
Net capital gain/loss in AGI: +$13,386 (reported on 28.2% of returns)
Here:
+$13,386
State:
+$33,493
(% of AGI for various income ranges: 1.4% for AGIs $50k-75k, 1.8% for AGIs $75k-100k, 2.7% for AGIs $100k-200k, 15.1% for AGIs over 200k)
Profit/loss from business: +$13,137 (reported on 15.6% of returns)
Here:
+$13,137
State:
+$10,012
(% of AGI for various income ranges: 10.1% for AGIs below $25k, 3.8% for AGIs $25k-50k, 2.7% for AGIs $50k-75k, 2.2% for AGIs $75k-100k, 2.0% for AGIs $100k-200k, 2.7% for AGIs over 200k)
Taxable individual retirement arrangement distribution: $22,118 (reported on 21.7% of returns)
34957:
$22,118
Florida:
$21,544
(% of AGI for various income ranges: 6.6% for AGIs below $25k, 5.8% for AGIs $25k-50k, 6.9% for AGIs $50k-75k, 7.8% for AGIs $75k-100k, 8.3% for AGIs $100k-200k, 7.0% for AGIs over 200k)
Self-employment retirement plans: $18,560 (reported on 0.5% of returns)
34957:
$18,560
Florida:
$20,611
Total itemized deductions: $24,619 (19% of AGI, reported on 32.0% of returns)
Here:
$24,619
State:
$25,533
Here:
19.5% of AGI
State:
18.0% of AGI
(% of AGI for various income ranges: 15.6% for AGIs below $25k, 12.1% for AGIs $25k-50k, 12.9% for AGIs $50k-75k, 12.8% for AGIs $75k-100k, 12.1% for AGIs $100k-200k, 10.0% for AGIs over 200k)
Charity contributions: $4,100 (reported on 26.5% of returns)
Here:
$4,100
State:
$5,698
(% of AGI for various income ranges: 0.9% for AGIs below $25k, 1.0% for AGIs $25k-50k, 1.4% for AGIs $50k-75k, 1.3% for AGIs $75k-100k, 1.7% for AGIs $100k-200k, 2.2% for AGIs over 200k)
Taxes paid: $7,293 (reported on 31.6% of returns)
34957:
$7,293
State:
$6,203
(% of AGI for various income ranges: 3.2% for AGIs below $25k, 2.6% for AGIs $25k-50k, 3.1% for AGIs $50k-75k, 3.5% for AGIs $75k-100k, 3.6% for AGIs $100k-200k, 3.8% for AGIs over 200k)
Earned income credit: $1,774 (reported on 13.7% of returns)
Here:
$1,774
State:
$2,372
(% of AGI for various income ranges: 4.2% for AGIs below $25k, 0.6% for AGIs $25k-50k)
Percentage of individuals using paid preparers for their 2012 taxes: 56.6%
Here:
57%
State:
54%
(% for various income ranges: 50.8% for AGIs below $25k, 51.9% for AGIs $25k-50k, 57.6% for AGIs $50k-75k, 67.8% for AGIs $75k-100k, 66.9% for AGIs $100k-200k, 78.6% for AGIs over 200k)
Averages for the 2004 tax year for zip code 34957, filed in 2005:
Average Adjusted Gross Income (AGI) in 2004: $53,155 (Individual Income Tax Returns)
Here:
$53,155
State:
$50,523
Salary/wage: $40,305 (reported on 68.2% of returns)
Here:
$40,305
State:
$39,563
(% of AGI for various income ranges: 59.8% for AGIs $10k-25k, 63.0% for AGIs $25k-50k, 55.7% for AGIs $50k-75k, 55.2% for AGIs $75k-100k, 41.0% for AGIs over 100k)
Taxable interest for individuals: $3,868 (reported on 54.5% of returns)
This zip code:
$3,868
Florida:
$3,211
(% of AGI for various income ranges: 5.5% for AGIs $10k-25k, 3.6% for AGIs $25k-50k, 3.4% for AGIs $50k-75k, 3.3% for AGIs $75k-100k, 3.9% for AGIs over 100k)
Taxable dividends: $5,289 (reported on 39.4% of returns)
Here:
$5,289
State:
$6,129
(% of AGI for various income ranges: 4.6% for AGIs $10k-25k, 3.5% for AGIs $25k-50k, 3.7% for AGIs $50k-75k, 3.2% for AGIs $75k-100k, 3.8% for AGIs over 100k)
Net capital gain/loss: +$15,472 (reported on 34.2% of returns)
Here:
+$15,472
State:
+$27,205
(% of AGI for various income ranges: 0.9% for AGIs $10k-25k, 0.7% for AGIs $25k-50k, 1.7% for AGIs $50k-75k, 4.1% for AGIs $75k-100k, 19.3% for AGIs over 100k)
Profit/loss from business: +$12,046 (reported on 15.0% of returns)
Here:
+$12,046
State:
+$10,634
(% of AGI for various income ranges: 5.2% for AGIs $10k-25k, 3.6% for AGIs $25k-50k, 3.5% for AGIs $50k-75k, 3.0% for AGIs $75k-100k, 2.8% for AGIs over 100k)
IRA payment deduction: $3,373 (reported on 3.2% of returns)
34957:
$3,373
Florida:
$3,082
(% of AGI for various income ranges: 0.3% for AGIs $10k-25k, 0.4% for AGIs $25k-50k, 0.3% for AGIs $50k-75k, 0.2% for AGIs $75k-100k, 0.1% for AGIs over 100k)
Self-employed pension: $18,375 (reported on 0.7% of returns)
Here:
$18,375
Florida:
$15,857
(% of AGI for various income ranges: 0.1% for AGIs $50k-75k, 0.2% for AGIs $75k-100k, 0.4% for AGIs over 100k)
Total itemized deductions: $21,335 (24% of AGI, reported on 36.4% of returns)
Here:
$21,335
State:
$20,370
Here:
23.8% of AGI
State:
20.7% of AGI
(% of AGI for various income ranges: 19.7% for AGIs $10k-25k, 16.6% for AGIs $25k-50k, 16.8% for AGIs $50k-75k, 16.2% for AGIs $75k-100k, 11.0% for AGIs over 100k)
Charity contributions deductions: $3,370 (4% of AGI, reported on 31.5% of returns)
Here:
$3,370
State:
$4,064
Here:
3.6% of AGI
State:
3.8% of AGI
(% of AGI for various income ranges: 1.1% for AGIs $10k-25k, 1.4% for AGIs $25k-50k, 1.7% for AGIs $50k-75k, 1.9% for AGIs $75k-100k, 2.4% for AGIs over 100k)
Total tax: $9,282 (reported on 77.2% of returns)
34957:
$9,282
State:
$9,431
(% of AGI for various income ranges: 4.1% for AGIs $10k-25k, 7.2% for AGIs $25k-50k, 9.4% for AGIs $50k-75k, 10.9% for AGIs $75k-100k, 19.1% for AGIs over 100k)
Earned income credit: $1,391 (reported on 10.1% of returns)
Here:
$1,391
State:
$1,808
Percentage of individuals using paid preparers for their 2004 taxes: 60.6%
Here:
61%
State:
60%
(% for various income ranges: 53.9% for AGIs below $10k, 58.4% for AGIs $10k-25k, 58.9% for AGIs $25k-50k, 66.3% for AGIs $50k-75k, 63.0% for AGIs $75k-100k, 71.0% for AGIs over 100k)
Likely homosexual households (counted as self-reported same-sex unmarried-partner households)
Lesbian couples: 0.2% of all households
Gay men: 0.5% of all households
Household received Food Stamps/SNAP in the past 12 months: 538 Household did not receive Food Stamps/SNAP in the past 12 months: 10,908
Women who had a birth in the past 12 months: 64 (68 now married, 0 unmarried) Women who did not have a birth in the past 12 months: 3,464 (1,433 now married, 2,032 unmarried)
Housing units in zip code 34957 with a mortgage: 3,717 (311 second mortgage, 293 both second mortgage and home equity loan) Houses without a mortgage: 195
Median monthly owner costs for units with a mortgage: $2,019 Median monthly owner costs for units without a mortgage: $748
Residents with income below the poverty level in 2022:
This zip code:
11.0%
Whole state:
12.7%
Residents with income below 50% of the poverty level in 2022:
This zip code:
7.7%
Whole state:
6.6%
Median number of rooms in houses and condos:
Here:
5.5
State:
5.9
Median number of rooms in apartments:
Here:
4.1
State:
4.2
Notable locations in this zip code not listed on our city pages
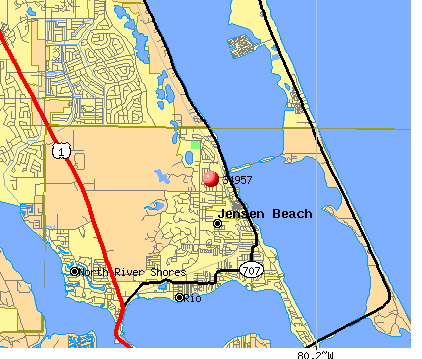
Notable locations in zip code 34957: Highland Woods Golf and Country Club (A), Saint Lucie Power Plant (B), Hutchinson Island Nuclear Power Plant (C), Jensen Beach Plaza (D), The Savannahs Shopping Plaza (E), Ocean Breeze Plaza (F), Martin County Public Library System Hoke Branch Library (G), Vince Bocchino Community Center (H), Martin County Fire / Rescue Station 12 (I), Martin County Fire Rescue Station 16 (J), Saint Lucie County Fire District Station 8 (K), Martin County Fire Rescue Station 18 (L). Display/hide their locations on the map
Churches in zip code 34957 include: Saint Martin De Porres Catholic Church (A), Jensen Beach Church of God (B), First Baptist Church of Jensen Beach (C), Church of God (D), All Saints Episcopal Church (E). Display/hide their locations on the map
2,115 married couples with children.
758 single-parent households (52 men, 706 women).
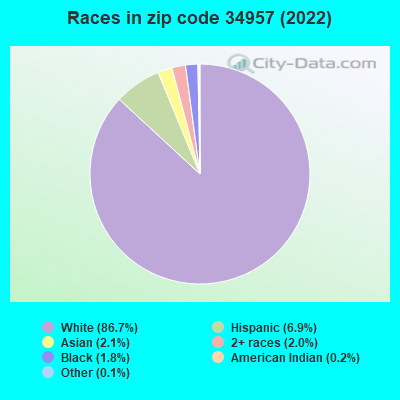
91.1% of residents of 34957 zip code speak English at home.
4.5% of residents speak Spanish at home (41% very well, 20% well, 27% not well, 13% not at all).
3.0% of residents speak other Indo-European language at home (96% very well, 3% well, 1% not well).
1.3% of residents speak Asian or Pacific Island language at home (85% very well, 7% well, 9% not well).
0.5% of residents speak other language at home (100% very well).
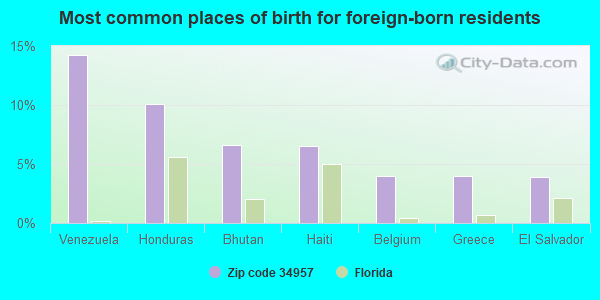
Foreign born population: 2,225 (9.6%) (67.3% of them are naturalized citizens)
This zip code:
9.6%
Whole state:
21.7%
14%Venezuela
10%Honduras
7%Bhutan
7%Haiti
4%Belgium
4%Greece
4%El Salvador
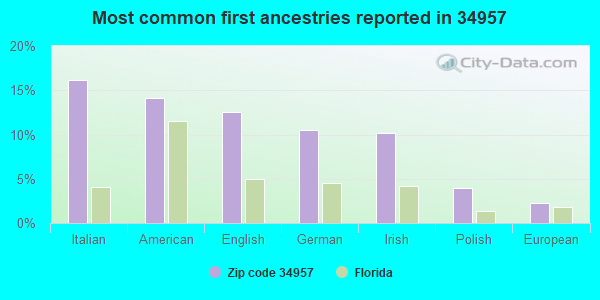
16%Italian
14%American
13%English
10%German
10%Irish
4%Polish
2%European
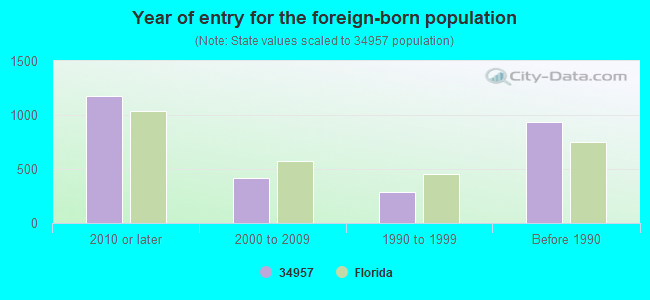
Year of entry for the foreign-born population
1,1742010 or later
4132000 to 2009
2871990 to 1999
934Before 1990
Major facilities with environmental interests located in this zip code:
JENSEN BEACH ELEMENTARY SCHOOL (2525 NE SAVANNAH ROAD in JENSEN BEACH, FL)
(Geographic Names Information System) (National Center for Education Statistics) - STATE ID-0211 Organizations: MARTIN COUNTY SCHOOL DISTRICT (SCHOOL DISTRICT)
SHORT GUYS SMALL BOATS (887 NE DIXIE HWY in JENSEN BEACH, FL)
(Integrated Compliance Information System) - ICIS-04-1998-0405, FORMAL ENFORCEMENT ACTION, ICIS-04-1998-0596, Business SIC classification: BOAT BUILDING AND REPAIRING
RENAR RIVER PLACE (INDIAN RIVER DR, JENSEN BCH CS in PALM CITY, FL)
National Pollutant Discharge Elimination System NON-MAJOR (Tracking pollutant discharge elimination systems) - permit Organizations: ARDEN DOSS (CONTACT/OWNER)
SAVANNAH CENTRE (SE BRAILLE PLACE in JENSEN BEACH, FL)
National Pollutant Discharge Elimination System NON-MAJOR (Tracking pollutant discharge elimination systems) - permit Organizations: THEODORE GLASRUD (CONTACT/OWNER)
ANCHORS AWEIGH MARINE (2225 NE INDIAN RIVER DR in JENSEN BEACH, FL)
HOME DEPOT #221 (3451 NW FEDERAL HWY in JENSEN BEACH, FL)
(Resource Conservation and Recovery Act (tracking hazardous waste)) Organizations: KEITH ROSENBLUM, SAFETY DIR (CONTACT/OWNER)
JENSEN BEACH AUTOMOTIVE (969 NE INDUSTRIAL BLVD in JENSEN BEACH, FL)
(Resource Conservation and Recovery Act (tracking hazardous waste)) Business NAICS classification: OTHER AUTOMOTIVE MECHANICAL AND ELECTRICAL REPAIR AND MAINTENANCE. Organizations: TIM RYAN (CONTACT/OWNER)
JENSEN BEACH CLUB (NE CAUSEWAY BLVD SR-732 in JENSEN BEACH, FL)
National Pollutant Discharge Elimination System NON-MAJOR (Tracking pollutant discharge elimination systems) - permit Organizations: JEFFREY DOUGHERTY (CONTACT/OWNER)
JENSEN BEACH FIRE STATION # 16 (2710 NE SAVANNAH RD in JENSEN BCH, FL)
National Pollutant Discharge Elimination System NON-MAJOR (Tracking pollutant discharge elimination systems) - permit Organizations: RUSS BLACKBURN (CONTACT/OWNER)
MILLERS REFINISHING SHOP (1000 NE DIXIE HWY in JENSEN BEACH, FL)
(Resource Conservation and Recovery Act (tracking hazardous waste)) Business NAICS classification: NONUPHOLSTERED WOOD HOUSEHOLD FURNITURE MANUFACTURING. Organizations: RICHARD MILLER, OWNER (CONTACT/OWNER)
RENAR PLATS 9/10 ( in JENSEN BEACH, FL)
National Pollutant Discharge Elimination System NON-MAJOR (Tracking pollutant discharge elimination systems) - permit Organizations: ARDEN DOSS (CONTACT/OWNER)
BJS GAS (4150 NW FEDERAL HWY in JENSEN BEACH, FL)
(Resource Conservation and Recovery Act (tracking hazardous waste)) Organizations: BJS WHOLESALE CLUB INC (CONTACT/OWNER)
Housing units lacking complete plumbing facilities: 0.1% Housing units lacking complete kitchen facilities: 1.0%
93.5%Electricity
3.0%Utility gas
2.7%No fuel used
0.6%Bottled, tank, or LP gas
Population in 1990: 13,656. Population change in the 1990s: +5,505 (+40.3%).
Place of birth for U.S.-born residents:
This state: 5,163
Northeast: 9,020
Midwest: 3,505
South: 2,077
West: 635
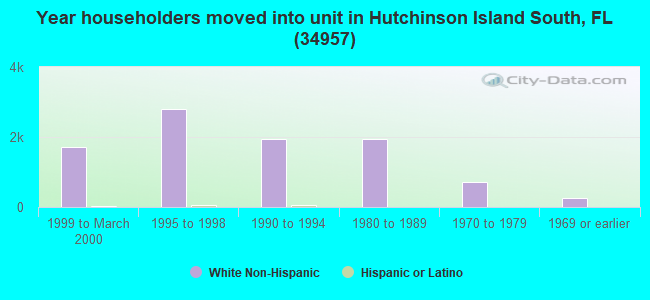
55% of the 34957 zip code residents lived in the same house 5 years ago. Out of people who lived in different houses, 33% lived in this county. Out of people who lived in different counties, 50% lived in Florida.
88% of the 34957 zip code residents lived in the same house 1 year ago. Out of people who lived in different houses, 22% moved from this county. Out of people who lived in different houses, 20% moved from different county within same state. Out of people who lived in different houses, 53% moved from different state. Out of people who lived in different houses, 13% moved from abroad.
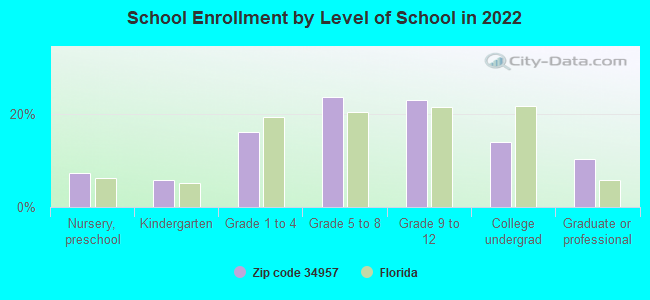
Private vs. public school enrollment:
Students in private schools in grades 1 to 8 (elementary and middle school): 404
Here:
27.5%
Florida:
15.8%
Students in private schools in grades 9 to 12 (high school): 58
Here:
6.9%
Florida:
12.9%
Students in private undergraduate colleges: 12
Here:
2.4%
Florida:
23.6%
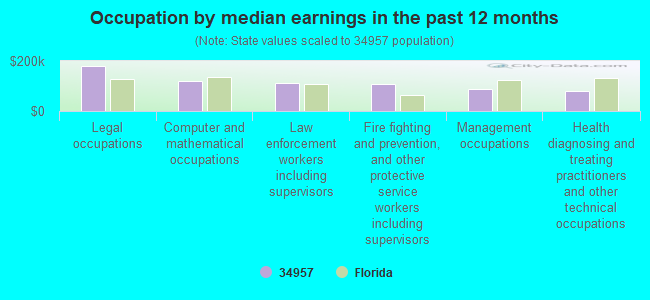
Occupation by median earnings in the past 12 months ($)
180,861Legal occupations
120,079Computer and mathematical occupations
113,782Law enforcement workers including supervisors
109,155Fire fighting and prevention, and other protective service workers including supervisors
87,722Management occupations
78,476Health diagnosing and treating practitioners and other technical occupations
Companies with federal contracts located in this zip code:
PROPANE DISCOUNTERS LLC (1108 NE INDUSTRIAL BLVD in JENSEN BEACH, FL) : $183,000 in 4 contractsin 2005
$50,000 with U.S. Army Corps of Engineers - civil program financing only for Gases: Compressed and Liquefied. Signed on 2005-03-03. Completion date: 2005-04-29.
$50,000 with Army for Gases: Compressed and Liquefied. Signed on 2005-03-03. Completion date: 2005-04-29.
$41,500, same as above.Signed on 2005-08-10. Completion date: 2005-12-31.
$41,500 with U.S. Army Corps of Engineers - civil program financing only for Gases: Compressed and Liquefied. Signed on 2005-08-10. Completion date: 2005-12-31.
NORTHEAST TV ENTERPRISES INC (12 OCEAN BREEZE DRIVE in JENSEN BEACH, FL; small business) : $20,125 in 7 contractsin 2005
Contracts for Miscellaneous Items, Visible and Invisible Light Communication Equipment, ADP Support Equipment, ADP Components, and moreby Army, Navy Signed by year:2000: $0; 2001: $0; 2002: $0; 2003: $0; 2004: $0; 2005: $20,125; 2006: $0.
Biggest contracts:
$41,589 with Army for Miscellaneous Items. Taking place in AZ. Signed on 2005-08-24. Completion date: 2005-09-22.
$8,850 with Army for Visible and Invisible Light Communication Equipment. Signed on 2005-07-19. Completion date: 2005-08-29.
$5,670 with Army for ADP Support Equipment. Signed on 2005-09-17. Completion date: 2005-09-26.
$5,605 with Army for ADP Components. Signed on 2005-09-09. Completion date: 2005-10-16.
NATIONSRENT INC (4102 NW FEDERAL HWY in JENSEN BEACH, FL) : $7,800 in 3 contractsin 2004
$2,600 with U.S. Army Corps of Engineers - civil program financing only for Other Professional Services. Signed on 2004-11-10. Completion date: 2004-11-30.
$2,600 with Army for Other Professional Services. Signed on 2004-11-10. Completion date: 2004-11-30.
$2,600, same as above.Signed on 2004-09-27. Completion date: 2004-11-30.
Top industries in this zip code by the number of employees in 2005:
Other Services (except Public Administration): Other Similar Organizations (except Business, Professional, Labor, and Political Organizations) (50-99: 1, 20-49: 1, 10-19: 2, 5-9: 4, 1-4: 22)
Administrative and Support and Waste Management and Remediation Services: Security Guards and Patrol Services (100-249: 1)
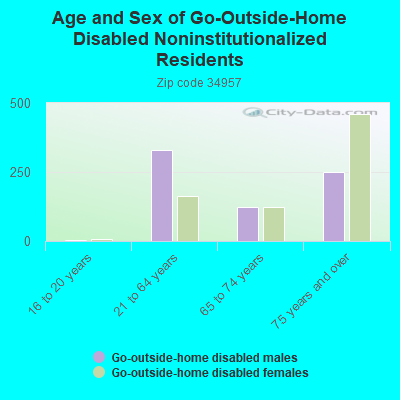
People in group quarters in 2010:
106 people in other noninstitutional facilities
16 people in group homes intended for adults
10 people in group homes for juveniles (non-correctional)
People in group quarters in 2000:
11 people in other noninstitutional group quarters
2 people in religious group quarters
Fatal accident statistics in 2014:
Fatal accident count: 4
Vehicles involved in fatal accidents: 8
Fatal accidents caused by drunken drivers: 0
Fatalities: 4
Persons involved in fatal accidents: 12
Pedestrians involved in fatal accidents: 2
Fatal accident statistics in 2013:
Fatal accident count: 3
Vehicles involved in fatal accidents: 3
Fatal accidents caused by drunken drivers: 2
Fatalities: 3
Persons involved in fatal accidents: 5
Pedestrians involved in fatal accidents: 2
Home Mortgage Disclosure Act Aggregated Statistics For Year 2009 (Based on 2 full and 12 partial tracts)
A) FHA, FSA/RHS & VA Home Purchase Loans
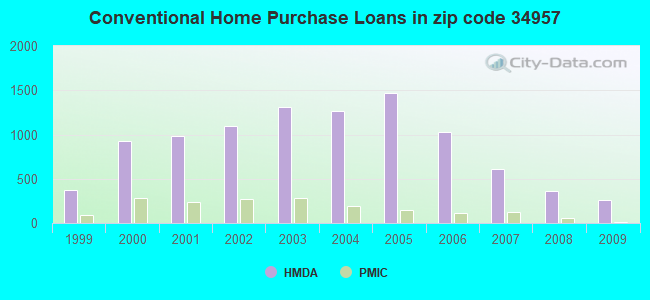
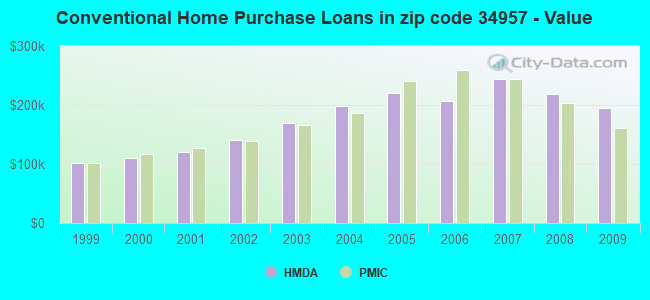
B) Conventional Home Purchase Loans
C) Refinancings
D) Home Improvement Loans
F) Non-occupant Loans on < 5 Family Dwellings (A B C & D)
G) Loans On Manufactured Home Dwelling (A B C & D)
Number
Average Value
Number
Average Value
Number
Average Value
Number
Average Value
Number
Average Value
Number
Average Value
LOANS ORIGINATED
132
$138,167
260
$194,555
389
$176,469
37
$85,306
228
$165,752
6
$51,812
APPLICATIONS APPROVED, NOT ACCEPTED
7
$123,027
32
$305,908
60
$159,915
5
$90,088
20
$203,128
0
$0
APPLICATIONS DENIED
25
$173,370
72
$236,374
296
$208,103
22
$18,466
105
$223,426
8
$24,769
APPLICATIONS WITHDRAWN
12
$203,186
37
$237,841
117
$198,299
3
$143,113
41
$203,371
2
$574,170
FILES CLOSED FOR INCOMPLETENESS
6
$140,958
9
$171,761
49
$215,686
3
$46,307
6
$54,393
0
$0
Aggregated Statistics For Year 2008 (Based on 2 full and 12 partial tracts)
A) FHA, FSA/RHS & VA Home Purchase Loans
B) Conventional Home Purchase Loans
C) Refinancings
D) Home Improvement Loans
E) Loans on Dwellings For 5+ Families
F) Non-occupant Loans on < 5 Family Dwellings (A B C & D)
G) Loans On Manufactured Home Dwelling (A B C & D)
Number
Average Value
Number
Average Value
Number
Average Value
Number
Average Value
Number
Average Value
Number
Average Value
Number
Average Value
LOANS ORIGINATED
88
$176,084
361
$218,230
310
$175,803
63
$54,669
2
$583,700
234
$190,053
20
$61,448
APPLICATIONS APPROVED, NOT ACCEPTED
2
$146,840
41
$172,470
98
$204,840
15
$45,225
0
$0
45
$164,378
2
$50,000
APPLICATIONS DENIED
21
$159,461
86
$278,961
258
$213,546
57
$176,781
0
$0
79
$193,887
7
$44,250
APPLICATIONS WITHDRAWN
4
$186,335
43
$260,828
99
$220,943
14
$144,044
0
$0
29
$192,856
3
$47,890
FILES CLOSED FOR INCOMPLETENESS
0
$0
15
$333,575
34
$242,540
2
$103,485
0
$0
8
$176,340
0
$0
Aggregated Statistics For Year 2007 (Based on 2 full and 12 partial tracts)
A) FHA, FSA/RHS & VA Home Purchase Loans
B) Conventional Home Purchase Loans
C) Refinancings
D) Home Improvement Loans
F) Non-occupant Loans on < 5 Family Dwellings (A B C & D)
G) Loans On Manufactured Home Dwelling (A B C & D)
Number
Average Value
Number
Average Value
Number
Average Value
Number
Average Value
Number
Average Value
Number
Average Value
LOANS ORIGINATED
20
$186,314
606
$244,754
767
$195,540
103
$78,476
403
$243,116
29
$61,604
APPLICATIONS APPROVED, NOT ACCEPTED
1
$124,760
79
$254,139
189
$194,126
32
$65,904
58
$224,249
4
$106,162
APPLICATIONS DENIED
6
$164,407
145
$289,375
544
$227,801
101
$83,278
114
$232,710
26
$75,638
APPLICATIONS WITHDRAWN
1
$109,100
65
$294,265
274
$215,212
15
$144,242
51
$257,642
1
$47,650
FILES CLOSED FOR INCOMPLETENESS
2
$195,000
13
$233,745
76
$226,798
5
$145,584
8
$274,518
0
$0
Aggregated Statistics For Year 2006 (Based on 2 full and 12 partial tracts)
A) FHA, FSA/RHS & VA Home Purchase Loans
B) Conventional Home Purchase Loans
C) Refinancings
D) Home Improvement Loans
E) Loans on Dwellings For 5+ Families
F) Non-occupant Loans on < 5 Family Dwellings (A B C & D)
G) Loans On Manufactured Home Dwelling (A B C & D)
Number
Average Value
Number
Average Value
Number
Average Value
Number
Average Value
Number
Average Value
Number
Average Value
Number
Average Value
LOANS ORIGINATED
7
$202,336
1,027
$206,880
990
$190,392
163
$93,244
1
$604,010
618
$206,304
28
$87,077
APPLICATIONS APPROVED, NOT ACCEPTED
1
$109,620
134
$189,505
185
$186,100
27
$71,090
1
$374,800
70
$208,030
8
$45,018
APPLICATIONS DENIED
3
$216,630
265
$170,927
416
$221,540
78
$82,209
0
$0
137
$220,865
15
$40,649
APPLICATIONS WITHDRAWN
1
$239,180
111
$184,729
349
$193,213
24
$126,412
2
$242,320
70
$209,522
10
$55,592
FILES CLOSED FOR INCOMPLETENESS
0
$0
50
$198,766
111
$206,770
3
$166,667
0
$0
21
$233,417
0
$0
Aggregated Statistics For Year 2005 (Based on 2 full and 12 partial tracts)
A) FHA, FSA/RHS & VA Home Purchase Loans
B) Conventional Home Purchase Loans
C) Refinancings
D) Home Improvement Loans
E) Loans on Dwellings For 5+ Families
F) Non-occupant Loans on < 5 Family Dwellings (A B C & D)
G) Loans On Manufactured Home Dwelling (A B C & D)
Number
Average Value
Number
Average Value
Number
Average Value
Number
Average Value
Number
Average Value
Number
Average Value
Number
Average Value
LOANS ORIGINATED
8
$159,886
1,469
$220,821
1,131
$193,395
185
$106,202
8
$611,435
861
$214,808
41
$91,328
APPLICATIONS APPROVED, NOT ACCEPTED
1
$92,920
176
$194,679
170
$170,920
21
$117,585
1
$26,100
86
$211,252
19
$45,551
APPLICATIONS DENIED
5
$104,076
307
$215,927
423
$193,716
85
$82,898
0
$0
139
$225,184
19
$80,352
APPLICATIONS WITHDRAWN
4
$172,048
184
$227,896
314
$182,477
48
$131,087
0
$0
75
$226,192
14
$81,331
FILES CLOSED FOR INCOMPLETENESS
0
$0
36
$191,740
248
$186,095
16
$73,036
0
$0
18
$182,172
0
$0
Aggregated Statistics For Year 2004 (Based on 2 full and 12 partial tracts)
A) FHA, FSA/RHS & VA Home Purchase Loans
B) Conventional Home Purchase Loans
C) Refinancings
D) Home Improvement Loans
E) Loans on Dwellings For 5+ Families
F) Non-occupant Loans on < 5 Family Dwellings (A B C & D)
G) Loans On Manufactured Home Dwelling (A B C & D)
Number
Average Value
Number
Average Value
Number
Average Value
Number
Average Value
Number
Average Value
Number
Average Value
Number
Average Value
LOANS ORIGINATED
29
$144,563
1,269
$197,642
1,151
$150,503
169
$82,274
12
$446,374
749
$194,354
38
$61,145
APPLICATIONS APPROVED, NOT ACCEPTED
3
$157,870
145
$169,319
196
$154,966
21
$73,297
0
$0
76
$173,963
5
$59,714
APPLICATIONS DENIED
3
$108,907
190
$164,597
396
$145,739
105
$60,412
0
$0
104
$148,406
20
$52,048
APPLICATIONS WITHDRAWN
3
$142,137
116
$202,368
292
$142,106
36
$80,159
2
$1,283,555
68
$171,140
4
$86,165
FILES CLOSED FOR INCOMPLETENESS
1
$91,870
25
$176,394
190
$135,201
18
$68,800
0
$0
13
$157,349
1
$79,700
Aggregated Statistics For Year 2003 (Based on 2 full and 12 partial tracts)
A) FHA, FSA/RHS & VA Home Purchase Loans
B) Conventional Home Purchase Loans
C) Refinancings
D) Home Improvement Loans
E) Loans on Dwellings For 5+ Families
F) Non-occupant Loans on < 5 Family Dwellings (A B C & D)
Number
Average Value
Number
Average Value
Number
Average Value
Number
Average Value
Number
Average Value
Number
Average Value
LOANS ORIGINATED
33
$126,626
1,307
$168,994
2,378
$130,747
68
$39,519
2
$566,780
980
$153,190
APPLICATIONS APPROVED, NOT ACCEPTED
1
$129,980
104
$172,767
298
$130,564
35
$32,421
0
$0
79
$150,070
APPLICATIONS DENIED
9
$111,508
168
$153,442
685
$122,271
63
$32,467
0
$0
95
$140,968
APPLICATIONS WITHDRAWN
3
$126,620
119
$169,583
367
$129,317
16
$29,031
2
$846,600
77
$133,049
FILES CLOSED FOR INCOMPLETENESS
1
$168,880
34
$122,497
79
$130,138
4
$75,818
0
$0
19
$98,541
Aggregated Statistics For Year 2002 (Based on 2 full and 12 partial tracts)
A) FHA, FSA/RHS & VA Home Purchase Loans
B) Conventional Home Purchase Loans
C) Refinancings
D) Home Improvement Loans
E) Loans on Dwellings For 5+ Families
F) Non-occupant Loans on < 5 Family Dwellings (A B C & D)
Number
Average Value
Number
Average Value
Number
Average Value
Number
Average Value
Number
Average Value
Number
Average Value
LOANS ORIGINATED
82
$108,659
1,093
$140,406
1,426
$121,012
103
$24,956
4
$1,256,025
645
$123,706
APPLICATIONS APPROVED, NOT ACCEPTED
7
$86,159
85
$126,207
211
$122,810
17
$29,502
2
$355,570
39
$93,323
APPLICATIONS DENIED
12
$109,151
109
$123,797
398
$91,111
62
$21,439
0
$0
58
$111,044
APPLICATIONS WITHDRAWN
4
$137,932
98
$158,225
246
$114,793
21
$11,310
0
$0
44
$107,862
FILES CLOSED FOR INCOMPLETENESS
2
$65,510
23
$128,092
117
$103,325
2
$28,775
0
$0
14
$125,299
Aggregated Statistics For Year 2001 (Based on 2 full and 12 partial tracts)
A) FHA, FSA/RHS & VA Home Purchase Loans
B) Conventional Home Purchase Loans
C) Refinancings
D) Home Improvement Loans
F) Non-occupant Loans on < 5 Family Dwellings (A B C & D)
Number
Average Value
Number
Average Value
Number
Average Value
Number
Average Value
Number
Average Value
LOANS ORIGINATED
126
$96,188
988
$119,965
958
$105,081
85
$25,898
454
$105,609
APPLICATIONS APPROVED, NOT ACCEPTED
2
$187,760
95
$109,722
117
$90,128
25
$23,112
40
$94,146
APPLICATIONS DENIED
10
$92,739
116
$94,293
330
$81,149
74
$18,955
51
$79,505
APPLICATIONS WITHDRAWN
3
$34,530
66
$153,462
229
$88,635
15
$18,464
15
$105,215
FILES CLOSED FOR INCOMPLETENESS
0
$0
15
$102,753
64
$105,991
3
$19,307
8
$114,965
Aggregated Statistics For Year 2000 (Based on 2 full and 12 partial tracts)
A) FHA, FSA/RHS & VA Home Purchase Loans
B) Conventional Home Purchase Loans
C) Refinancings
D) Home Improvement Loans
E) Loans on Dwellings For 5+ Families
F) Non-occupant Loans on < 5 Family Dwellings (A B C & D)
Number
Average Value
Number
Average Value
Number
Average Value
Number
Average Value
Number
Average Value
Number
Average Value
LOANS ORIGINATED
57
$84,302
931
$110,454
237
$81,409
109
$18,439
6
$170,688
280
$99,139
APPLICATIONS APPROVED, NOT ACCEPTED
1
$46,980
91
$89,604
44
$68,928
24
$30,931
0
$0
21
$83,517
APPLICATIONS DENIED
14
$84,031
132
$95,501
230
$66,953
91
$17,939
1
$129,730
32
$78,968
APPLICATIONS WITHDRAWN
5
$88,770
75
$122,198
123
$68,832
16
$37,877
0
$0
22
$139,978
FILES CLOSED FOR INCOMPLETENESS
1
$36,540
18
$112,528
45
$79,265
5
$27,456
0
$0
7
$117,681
Aggregated Statistics For Year 1999 (Based on 7 partial tracts)
A) FHA, FSA/RHS & VA Home Purchase Loans
B) Conventional Home Purchase Loans
C) Refinancings
D) Home Improvement Loans
F) Non-occupant Loans on < 5 Family Dwellings (A B C & D)
2002 - 2018 National Fire Incident Reporting System (NFIRS) incidents
Based on the data from the years 2002 - 2018 the average number of fire incidents per year is 38. The highest number of reported fires - 73 took place in 2006, and the least - 12 in 2002. The data has an increasing trend.
When looking into fire subcategories, the most reports belonged to: Outside Fires (55.0%), and Structure Fires (27.5%).
Fire incident types reported to NFIRS in Zip Code 34957


 Nearest zip codes: 34952, 34994, 34984, 34996, 34982, 34983.


 Based on the data from the years 2002 - 2018 the average number of fire incidents per year is 38. The highest number of reported fires - 73 took place in 2006, and the least - 12 in 2002. The data has an increasing trend.
 When looking into fire subcategories, the most reports belonged to: Outside Fires (55.0%), and Structure Fires (27.5%).