Estimated zip code population in 2022: 30,146 Zip code population in 2010: 23,297 Zip code population in 2000: 6,143
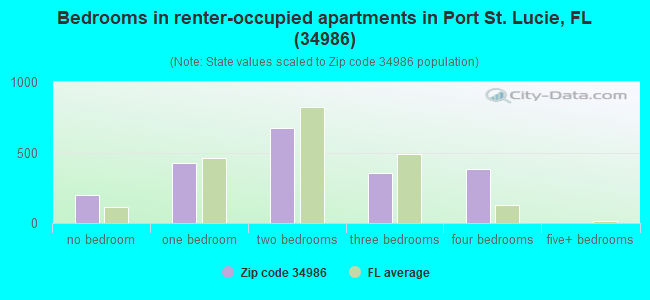
Houses and condos: 14,530 Renter-occupied apartments: 2,006
% of renters here:
16%
State:
33%
March 2022 cost of living index in zip code 34986: 91.5 (less than average, U.S. average is 100)
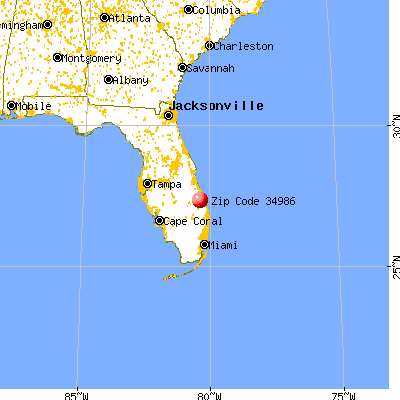
Land area: 19.5 sq. mi. Water area: 0.1 sq. mi.
Population density: 1,549 people per square mile
(low).
OSM Map
General Map
Google Map
MSN Map
OSM Map
General Map
Google Map
MSN Map
OSM Map
General Map
Google Map
MSN Map
OSM Map
General Map
Google Map
MSN Map
Please wait while loading the map...
Real estate property taxes paid for housing units in 2022:
This zip code:
1.1% ($4,692)
Florida:
0.7% ($2,529)
Median real estate property taxes paid for housing units with mortgages in 2022: $4,967 (1.2%) Median real estate property taxes paid for housing units with no mortgage in 2022: $4,113 (1.0%)
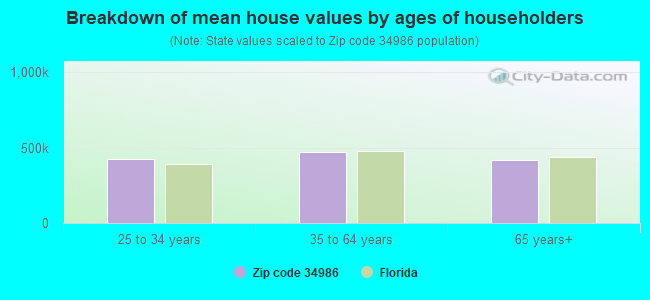
Estimated median house/condo value in 2022: $422,448
34986:
$422,448
Florida:
$354,100
According to our research of Florida and other state lists, there were 10 registered sex offenders living in 34986 zip code as of April 27, 2024. The ratio of all residents to sex offenders in zip code 34986 is 2,445 to 1. The ratio of registered sex offenders to all residents in this zip code is much lower than the state average.
Median resident age:
This zip code:
57.7 years
Florida median age:
42.7 years
Average household size:
This zip code:
2.4 people
Florida:
2.5 people
Averages for the 2020 tax year for zip code 34986, filed in 2021:
Average Adjusted Gross Income (AGI) in 2020: $78,889 (Individual Income Tax Returns)
Here:
$78,889
State:
$82,200
Salary/wage: $59,368 (reported on 64.0% of returns)
Here:
$59,368
State:
$58,347
(% of AGI for various income ranges: 1111.2% for AGIs below $25k, 3091.9% for AGIs $25k-50k, 5174.0% for AGIs $50k-75k, 7166.3% for AGIs $75k-100k, 13160.3% for AGIs $100k-200k, 60777.6% for AGIs over 200k)
Taxable interest for individuals: $2,798 (reported on 37.4% of returns)
This zip code:
$2,798
Florida:
$4,272
(% of AGI for various income ranges: 39.6% for AGIs below $25k, 53.4% for AGIs $25k-50k, 111.6% for AGIs $50k-75k, 167.0% for AGIs $75k-100k, 312.2% for AGIs $100k-200k, 2460.4% for AGIs over 200k)
Ordinary dividends: $9,775 (reported on 29.5% of returns)
Here:
$9,775
State:
$15,863
(% of AGI for various income ranges: 63.1% for AGIs below $25k, 112.4% for AGIs $25k-50k, 241.6% for AGIs $50k-75k, 397.9% for AGIs $75k-100k, 839.2% for AGIs $100k-200k, 8475.2% for AGIs over 200k)
Net capital gain/loss in AGI: +$23,665 (reported on 27.4% of returns)
Here:
+$23,665
State:
+$62,983
(% of AGI for various income ranges: 6.9% for AGIs below $25k, 69.5% for AGIs $25k-50k, 157.8% for AGIs $50k-75k, 272.8% for AGIs $75k-100k, 1238.5% for AGIs $100k-200k, 30933.2% for AGIs over 200k)
Profit/loss from business: +$11,681 (reported on 18.2% of returns)
Here:
+$11,681
State:
+$9,719
(% of AGI for various income ranges: 124.0% for AGIs below $25k, 137.4% for AGIs $25k-50k, 216.3% for AGIs $50k-75k, 246.3% for AGIs $75k-100k, 392.1% for AGIs $100k-200k, 5994.4% for AGIs over 200k)
Taxable individual retirement arrangement distribution: $24,132 (reported on 19.7% of returns)
34986:
$24,132
Florida:
$24,823
(% of AGI for various income ranges: 133.7% for AGIs below $25k, 256.7% for AGIs $25k-50k, 604.9% for AGIs $50k-75k, 972.9% for AGIs $75k-100k, 1963.5% for AGIs $100k-200k, 7148.0% for AGIs over 200k)
Self-employed (Keogh) retirement plans: $34,900 (reported on 0.3% of returns)
34986:
$34,900
Florida:
$29,694
(% of AGI for various income ranges: 21.5% for AGIs $50k-75k, 572.4% for AGIs over 200k)
Total itemized deductions: $34,971 (reported on 10.4% of returns)
Here:
$34,971
State:
$45,393
(% of AGI for various income ranges: 107.9% for AGIs below $25k, 225.9% for AGIs $25k-50k, 457.5% for AGIs $50k-75k, 724.0% for AGIs $75k-100k, 1119.2% for AGIs $100k-200k, 7386.0% for AGIs over 200k)
Charity contributions: $10,300 (reported on 8.6% of returns)
Here:
$10,300
State:
$20,178
(% of AGI for various income ranges: 7.9% for AGIs below $25k, 31.6% for AGIs $25k-50k, 69.5% for AGIs $50k-75k, 108.3% for AGIs $75k-100k, 244.4% for AGIs $100k-200k, 2956.4% for AGIs over 200k)
Taxes paid: $6,957 (reported on 10.3% of returns)
34986:
$6,957
State:
$6,967
(% of AGI for various income ranges: 22.1% for AGIs below $25k, 51.4% for AGIs $25k-50k, 103.8% for AGIs $50k-75k, 156.4% for AGIs $75k-100k, 251.8% for AGIs $100k-200k, 1050.8% for AGIs over 200k)
Earned income credit: $2,305 (reported on 12.0% of returns)
Here:
$2,305
State:
$2,306
(% of AGI for various income ranges: 88.6% for AGIs below $25k, 62.3% for AGIs $25k-50k, 1.0% for AGIs $50k-75k)
Percentage of individuals using paid preparers for their 2020 taxes: 92.4%
Here:
92%
State:
92%
(% for various income ranges: 91.4% for AGIs below $25k, 93.8% for AGIs $25k-50k, 93.0% for AGIs $50k-75k, 91.6% for AGIs $75k-100k, 92.2% for AGIs $100k-200k, 93.4% for AGIs over 200k)
Averages for the 2012 tax year for zip code 34986, filed in 2013:
Average Adjusted Gross Income (AGI) in 2012: $66,146 (Individual Income Tax Returns)
Here:
$66,146
State:
$60,316
Salary/wage: $49,757 (reported on 65.6% of returns)
Here:
$49,757
State:
$45,277
(% of AGI for various income ranges: 58.9% for AGIs below $25k, 59.0% for AGIs $25k-50k, 53.6% for AGIs $50k-75k, 48.0% for AGIs $75k-100k, 50.9% for AGIs $100k-200k, 39.8% for AGIs over 200k)
Taxable interest for individuals: $2,751 (reported on 43.3% of returns)
This zip code:
$2,751
Florida:
$3,587
(% of AGI for various income ranges: 3.3% for AGIs below $25k, 1.8% for AGIs $25k-50k, 1.4% for AGIs $50k-75k, 1.7% for AGIs $75k-100k, 1.6% for AGIs $100k-200k, 1.9% for AGIs over 200k)
Ordinary dividends: $7,698 (reported on 31.4% of returns)
Here:
$7,698
State:
$12,831
(% of AGI for various income ranges: 4.4% for AGIs below $25k, 3.1% for AGIs $25k-50k, 2.9% for AGIs $50k-75k, 3.1% for AGIs $75k-100k, 3.1% for AGIs $100k-200k, 5.0% for AGIs over 200k)
Net capital gain/loss in AGI: +$10,963 (reported on 27.8% of returns)
Here:
+$10,963
State:
+$33,493
(% of AGI for various income ranges: 0.8% for AGIs $50k-75k, 0.7% for AGIs $75k-100k, 2.6% for AGIs $100k-200k, 14.0% for AGIs over 200k)
Profit/loss from business: +$12,015 (reported on 15.3% of returns)
Here:
+$12,015
State:
+$10,012
(% of AGI for various income ranges: 7.7% for AGIs below $25k, 2.2% for AGIs $25k-50k, 2.0% for AGIs $50k-75k, 1.4% for AGIs $75k-100k, 1.9% for AGIs $100k-200k, 3.8% for AGIs over 200k)
Taxable individual retirement arrangement distribution: $18,139 (reported on 22.9% of returns)
34986:
$18,139
Florida:
$21,544
(% of AGI for various income ranges: 7.4% for AGIs below $25k, 5.8% for AGIs $25k-50k, 6.3% for AGIs $50k-75k, 7.7% for AGIs $75k-100k, 8.7% for AGIs $100k-200k, 3.2% for AGIs over 200k)
Self-employment retirement plans: $25,483 (reported on 0.5% of returns)
34986:
$25,483
Florida:
$20,611
Total itemized deductions: $23,509 (21% of AGI, reported on 37.1% of returns)
Here:
$23,509
State:
$25,533
Here:
21.1% of AGI
State:
18.0% of AGI
(% of AGI for various income ranges: 18.6% for AGIs below $25k, 15.2% for AGIs $25k-50k, 14.5% for AGIs $50k-75k, 13.5% for AGIs $75k-100k, 13.1% for AGIs $100k-200k, 10.1% for AGIs over 200k)
Charity contributions: $3,442 (reported on 31.8% of returns)
Here:
$3,442
State:
$5,698
(% of AGI for various income ranges: 1.2% for AGIs below $25k, 1.5% for AGIs $25k-50k, 1.6% for AGIs $50k-75k, 1.7% for AGIs $75k-100k, 1.7% for AGIs $100k-200k, 1.7% for AGIs over 200k)
Taxes paid: $6,616 (reported on 36.6% of returns)
34986:
$6,616
State:
$6,203
(% of AGI for various income ranges: 4.3% for AGIs below $25k, 3.4% for AGIs $25k-50k, 3.8% for AGIs $50k-75k, 3.5% for AGIs $75k-100k, 3.9% for AGIs $100k-200k, 3.4% for AGIs over 200k)
Earned income credit: $2,334 (reported on 14.6% of returns)
Here:
$2,334
State:
$2,372
(% of AGI for various income ranges: 5.9% for AGIs below $25k, 0.9% for AGIs $25k-50k)
Percentage of individuals using paid preparers for their 2012 taxes: 59.3%
Here:
59%
State:
54%
(% for various income ranges: 56.7% for AGIs below $25k, 56.0% for AGIs $25k-50k, 60.7% for AGIs $50k-75k, 61.6% for AGIs $75k-100k, 62.4% for AGIs $100k-200k, 81.4% for AGIs over 200k)
Averages for the 2004 tax year for zip code 34986, filed in 2005:
Average Adjusted Gross Income (AGI) in 2004: $61,498 (Individual Income Tax Returns)
Here:
$61,498
State:
$50,523
Salary/wage: $46,889 (reported on 67.8% of returns)
Here:
$46,889
State:
$39,563
(% of AGI for various income ranges: 109.5% for AGIs below $10k, 53.6% for AGIs $10k-25k, 54.6% for AGIs $25k-50k, 52.9% for AGIs $50k-75k, 56.5% for AGIs $75k-100k, 47.9% for AGIs over 100k)
Taxable interest for individuals: $3,260 (reported on 62.2% of returns)
This zip code:
$3,260
Florida:
$3,211
(% of AGI for various income ranges: 18.4% for AGIs below $10k, 6.5% for AGIs $10k-25k, 4.0% for AGIs $25k-50k, 2.9% for AGIs $50k-75k, 2.9% for AGIs $75k-100k, 2.7% for AGIs over 100k)
Taxable dividends: $4,365 (reported on 40.8% of returns)
Here:
$4,365
State:
$6,129
(% of AGI for various income ranges: 11.4% for AGIs below $10k, 4.8% for AGIs $10k-25k, 3.2% for AGIs $25k-50k, 2.6% for AGIs $50k-75k, 2.4% for AGIs $75k-100k, 2.7% for AGIs over 100k)
Net capital gain/loss: +$13,153 (reported on 37.1% of returns)
Here:
+$13,153
State:
+$27,205
(% of AGI for various income ranges: -10.1% for AGIs below $10k, 0.0% for AGIs $10k-25k, 1.1% for AGIs $25k-50k, 2.1% for AGIs $50k-75k, 4.0% for AGIs $75k-100k, 14.3% for AGIs over 100k)
Profit/loss from business: +$14,940 (reported on 16.2% of returns)
Here:
+$14,940
State:
+$10,634
(% of AGI for various income ranges: 8.6% for AGIs below $10k, 4.7% for AGIs $10k-25k, 2.8% for AGIs $25k-50k, 2.1% for AGIs $50k-75k, 2.2% for AGIs $75k-100k, 5.3% for AGIs over 100k)
IRA payment deduction: $3,690 (reported on 3.2% of returns)
34986:
$3,690
Florida:
$3,082
(% of AGI for various income ranges: 0.3% for AGIs $10k-25k, 0.3% for AGIs $25k-50k, 0.2% for AGIs $50k-75k, 0.2% for AGIs $75k-100k, 0.1% for AGIs over 100k)
Self-employed pension: $17,806 (reported on 0.8% of returns)
Here:
$17,806
Florida:
$15,857
Total itemized deductions: $20,464 (24% of AGI, reported on 49.5% of returns)
Here:
$20,464
State:
$20,370
Here:
23.6% of AGI
State:
20.7% of AGI
(% of AGI for various income ranges: 53.8% for AGIs below $10k, 24.2% for AGIs $10k-25k, 22.3% for AGIs $25k-50k, 19.8% for AGIs $50k-75k, 18.6% for AGIs $75k-100k, 11.5% for AGIs over 100k)
Charity contributions deductions: $3,020 (3% of AGI, reported on 44.1% of returns)
Here:
$3,020
State:
$4,064
Here:
3.4% of AGI
State:
3.8% of AGI
(% of AGI for various income ranges: 2.9% for AGIs below $10k, 1.9% for AGIs $10k-25k, 2.2% for AGIs $25k-50k, 2.5% for AGIs $50k-75k, 2.5% for AGIs $75k-100k, 2.0% for AGIs over 100k)
Total tax: $10,492 (reported on 79.3% of returns)
34986:
$10,492
State:
$9,431
(% of AGI for various income ranges: 4.3% for AGIs below $10k, 3.5% for AGIs $10k-25k, 6.1% for AGIs $25k-50k, 8.7% for AGIs $50k-75k, 10.2% for AGIs $75k-100k, 19.7% for AGIs over 100k)
Earned income credit: $1,644 (reported on 8.6% of returns)
Here:
$1,644
State:
$1,808
Percentage of individuals using paid preparers for their 2004 taxes: 65.1%
Here:
65%
State:
60%
(% for various income ranges: 57.6% for AGIs below $10k, 64.9% for AGIs $10k-25k, 63.5% for AGIs $25k-50k, 65.9% for AGIs $50k-75k, 67.6% for AGIs $75k-100k, 72.3% for AGIs over 100k)
Likely homosexual households (counted as self-reported same-sex unmarried-partner households)
Lesbian couples: 0.1% of all households
Gay men: 0.7% of all households
Household received Food Stamps/SNAP in the past 12 months: 608 Household did not receive Food Stamps/SNAP in the past 12 months: 11,997
Women who had a birth in the past 12 months: 347 (70 now married, 256 unmarried) Women who did not have a birth in the past 12 months: 4,629 (1,830 now married, 2,798 unmarried)
Housing units in zip code 34986 with a mortgage: 5,790 (366 second mortgage, 357 both second mortgage and home equity loan) Houses without a mortgage: 141
Median monthly owner costs for units with a mortgage: $1,951 Median monthly owner costs for units without a mortgage: $754
Residents with income below the poverty level in 2022:
This zip code:
5.2%
Whole state:
12.7%
Residents with income below 50% of the poverty level in 2022:
This zip code:
2.2%
Whole state:
6.6%
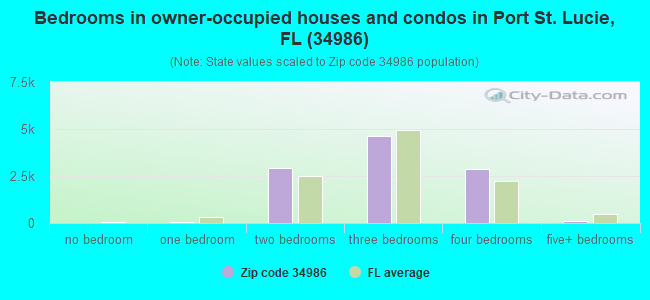
Median number of rooms in houses and condos:
Here:
6.7
State:
5.9
Median number of rooms in apartments:
Here:
4.3
State:
4.2
Notable locations in this zip code not listed on our city pages
Notable locations in zip code 34986: Spring Run Golf Club (A), Service Area Number 3 (B), Indian River Community College Saint Lucie West Library (C), Saint Lucie County Fire District Station 14 (D). Display/hide their locations on the map
Churches in zip code 34986 include: Temple Beth El Israel (A), Sunlight Community Church (B), Saint Bernadette Catholic Church (C), All Villages Presbyterian Church (D). Display/hide their locations on the map
Tourist attraction (not listed on the city page) : Indian River Community College - St Lucie West Campus- St Lucie West Lib (Cultural Attractions- Events- & Facilities; 500 Northwest California Boulevard).
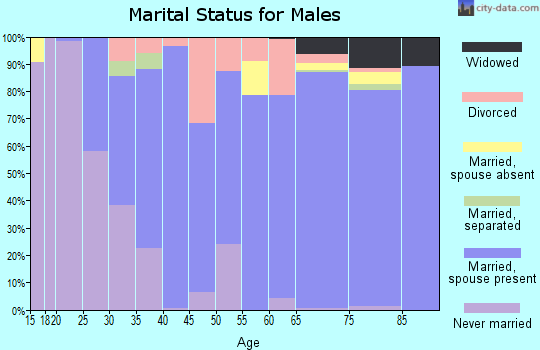
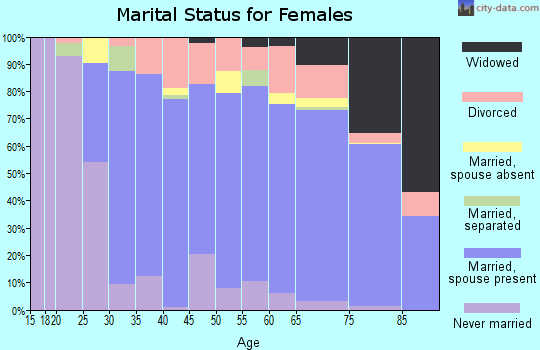
2,676 married couples with children.
1,980 single-parent households (309 men, 1,671 women).
82.8% of residents of 34986 zip code speak English at home.
12.0% of residents speak Spanish at home (76% very well, 13% well, 10% not well, 1% not at all).
4.6% of residents speak other Indo-European language at home (93% very well, 6% well, 1% not well).
0.3% of residents speak Asian or Pacific Island language at home (8% very well, 78% well, 14% not well).
0.5% of residents speak other language at home (100% very well).
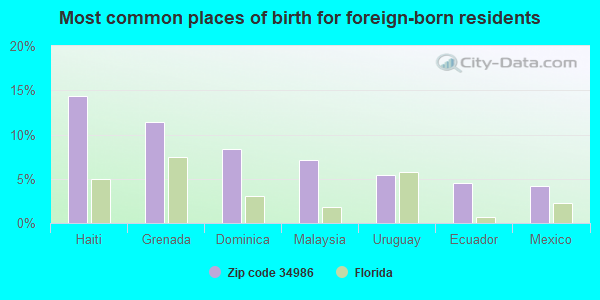
Foreign born population: 4,585 (15.2%) (85.3% of them are naturalized citizens)
This zip code:
15.2%
Whole state:
21.7%
14%Haiti
11%Grenada
8%Dominica
7%Malaysia
5%Uruguay
5%Ecuador
4%Mexico
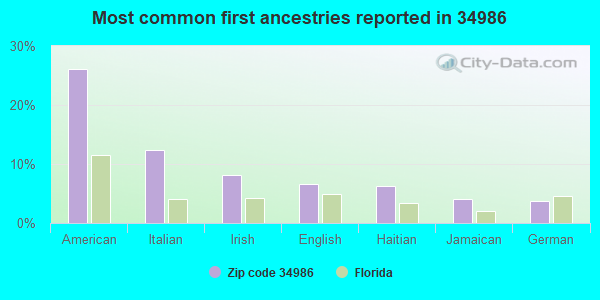
26%American
12%Italian
8%Irish
7%English
6%Haitian
4%Jamaican
4%German
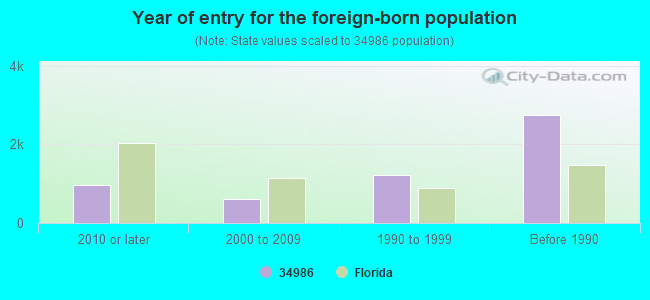
Year of entry for the foreign-born population
9742010 or later
6052000 to 2009
1,2141990 to 1999
2,743Before 1990
Major facilities with environmental interests located in this zip code:
MANATEE ELEMENTARY SCHOOL (1450 SW HEATHERWOOD BLVD in PORT ST LUCIE, FL)
(National Center for Education Statistics) - STATE ID-0361 Organizations: ST. LUCIE COUNTY SCHOOL DISTRICT (SCHOOL DISTRICT)
LOT 3, ST. LUCIE WEST PLAT NO. (INTERSECTION OF NW MERCANTILE in PORT ST. LUCIE, FL)
National Pollutant Discharge Elimination System NON-MAJOR (Tracking pollutant discharge elimination systems) - permit Organizations: SEAN LEDER (CONTACT/OWNER)
RESERVE 18 - CLUBSIDE (E. END OF CROOKED STICK LANE,T in PORT ST. LUCIE, FL)
National Pollutant Discharge Elimination System NON-MAJOR (Tracking pollutant discharge elimination systems) - permit Organizations: JOHN CSAPO (CONTACT/OWNER)
LAKE FOREST POINTE (WEST OF S.W CASHMERE BLVD. AND in PORT ST. LUCIE, FL)
National Pollutant Discharge Elimination System NON-MAJOR (Tracking pollutant discharge elimination systems) - permit Organizations: ROBERT TRAUTMAN (CONTACT/OWNER)
MAIDSTON E@ PGA VILLAGE (N. ST. LUCIE W. BLVD., W, I-95 in PORT ST. LUCIE, FL)
National Pollutant Discharge Elimination System NON-MAJOR (Tracking pollutant discharge elimination systems) - permit Organizations: SCOTT MORTON (CONTACT/OWNER)
AIROSO CLEANERS INC (1593 VILLAGE GREEN DRIVE in PORT SAINT LUCIE, FL)
AIR MINOR (AIRS/AFS) Small Quantity Generators, between 100 kg and 1000 kg of hazardous waste/month (Resource Conservation and Recovery Act (tracking hazardous waste)) - notification Business SIC classification: DRYCLEANING PLANTS, EXCEPT RUG CLEANING
PARADISE VILLAS AT ST.LUCIE WE (CASHMERE BLVD. in PORT ST. LUCIE, FL)
National Pollutant Discharge Elimination System NON-MAJOR (Tracking pollutant discharge elimination systems) - permit Organizations: WILLIAM STODDARD (CONTACT/OWNER)
SHOPPES AT TRADITION (NW CORNER OF VILLAGE PARKWAY A in PORT ST LUCIE, FL)
National Pollutant Discharge Elimination System NON-MAJOR (Tracking pollutant discharge elimination systems) - permit Organizations: MATTHEW AMMAN (CONTACT/OWNER)
RIVERSIDE BANK (SW CALIFORNIA BLVD & ST LUCIE in PORT ST LUCIE, FL)
National Pollutant Discharge Elimination System NON-MAJOR (Tracking pollutant discharge elimination systems) - permit Organizations: GERRY GROOTHOUSE (CONTACT/OWNER)
RESERVE 20C - CASTLE PINES (W. OF COMMERCE CENTER DRIVE in PORT ST. LUCIE, FL)
National Pollutant Discharge Elimination System NON-MAJOR (Tracking pollutant discharge elimination systems) - permit Organizations: JOHN CSAPO (CONTACT/OWNER)
RESERVE 6 - WILLOW PINES WEST (INTERSECTION OF LEGENDS DR. &W in PORT ST. LUCIE, FL)
National Pollutant Discharge Elimination System NON-MAJOR (Tracking pollutant discharge elimination systems) - permit Organizations: JOHN CSAPO (CONTACT/OWNER)
RIVERSIDE NATIONAL BANK - ST L (1670 SW ST LUCIE W BLVD in PORT ST LUCIE, FL)
National Pollutant Discharge Elimination System NON-MAJOR (Tracking pollutant discharge elimination systems) - permit Organizations: MICHAEL WILLIAMS (CONTACT/OWNER)
D&B TILE DISTRIBUTORS (N W PEACOCK BLVD AND LAKE WHIT in PORT ST LUCIE, FL)
National Pollutant Discharge Elimination System NON-MAJOR (Tracking pollutant discharge elimination systems) - permit Organizations: HAROLD YARBOROUGH (CONTACT/OWNER)
Housing units lacking complete plumbing facilities: 0.3% Housing units lacking complete kitchen facilities: 0.4%
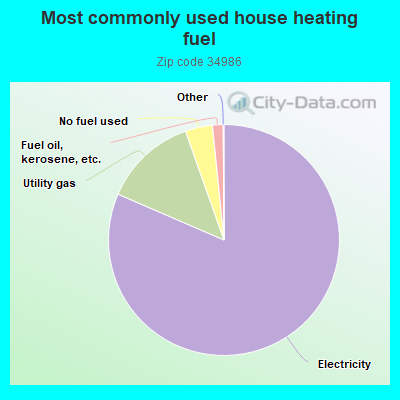
81.5%Electricity
13.1%Utility gas
3.8%No fuel used
1.5%Fuel oil, kerosene, etc.
Population in 1990: 610. Population change in the 1990s: +5,533 (+907.0%).
Place of birth for U.S.-born residents:
This state: 7,677
Northeast: 10,855
Midwest: 2,238
South: 2,314
West: 1,320
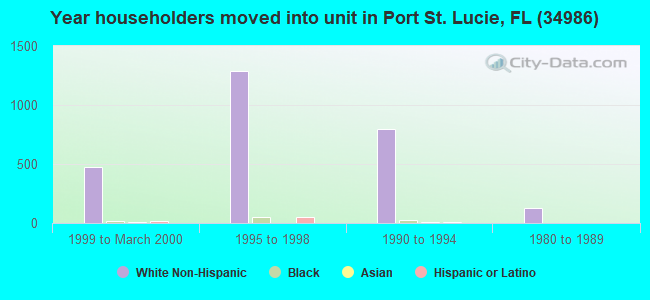
39% of the 34986 zip code residents lived in the same house 5 years ago. Out of people who lived in different houses, 27% lived in this county. Out of people who lived in different counties, 50% lived in Florida.
91% of the 34986 zip code residents lived in the same house 1 year ago. Out of people who lived in different houses, 47% moved from this county. Out of people who lived in different houses, 23% moved from different county within same state. Out of people who lived in different houses, 30% moved from different state. Out of people who lived in different houses, 0% moved from abroad.
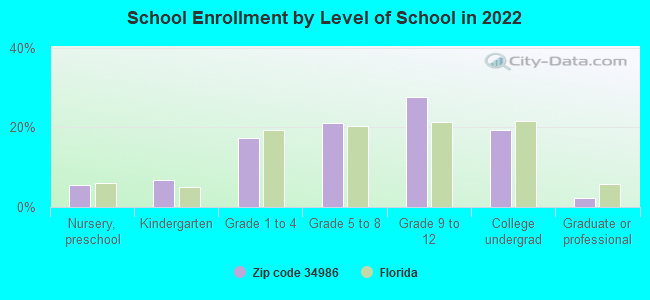
Private vs. public school enrollment:
Students in private schools in grades 1 to 8 (elementary and middle school): 149
Here:
7.0%
Florida:
15.8%
Students in private schools in grades 9 to 12 (high school): 145
Here:
9.5%
Florida:
12.9%
Students in private undergraduate colleges: 377
Here:
34.3%
Florida:
23.6%
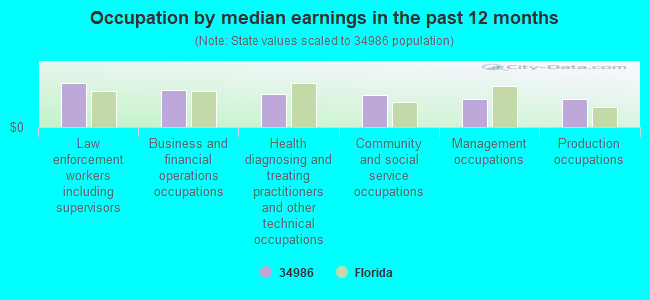
Occupation by median earnings in the past 12 months ($)
102,230Law enforcement workers including supervisors
85,959Business and financial operations occupations
76,008Health diagnosing and treating practitioners and other technical occupations
73,232Community and social service occupations
64,754Management occupations
64,652Production occupations
Top industries in this zip code by the number of employees in 2005:
Information: Cable and Other Program Distribution (500-999 employees: 1 establishment)
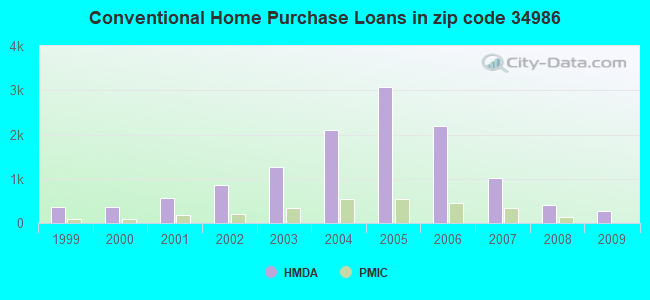
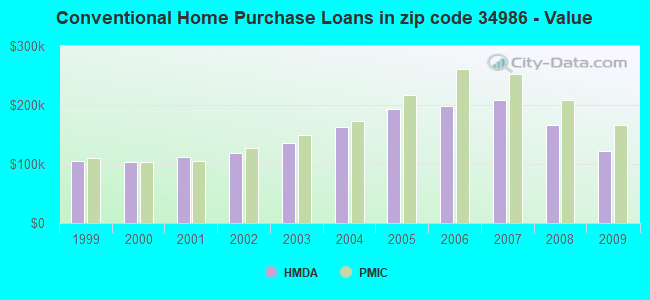
Detailed PMIC statistics for the following Tracts:0021.02
2002 - 2018 National Fire Incident Reporting System (NFIRS) incidents
Based on the data from the years 2002 - 2018 the average number of fire incidents per year is 38. The highest number of reported fires - 67 took place in 2006, and the least - 0 in 2009. The data has an increasing trend.
When looking into fire subcategories, the most reports belonged to: Outside Fires (58.4%), and Mobile Property/Vehicle Fires (24.9%).
Fire incident types reported to NFIRS in Zip Code 34986


 Nearest zip codes: 34983, 34981, 34953, 34982, 34984, 34952.


 Based on the data from the years 2002 - 2018 the average number of fire incidents per year is 38. The highest number of reported fires - 67 took place in 2006, and the least - 0 in 2009. The data has an increasing trend.
 When looking into fire subcategories, the most reports belonged to: Outside Fires (58.4%), and Mobile Property/Vehicle Fires (24.9%).