Estimated zip code population in 2022: 14,916
Zip code population in 2010: 6,118
Zip code population in 2000: 1,175
Houses and condos: 7,373
Renter-occupied apartments: 1,289
% of renters here:
19%State:
33%
March 2022 cost of living index in zip code 34987: 92.2
(less than average, U.S. average is 100)
Land area: 102.3
sq. mi.
Water area: 0.0
sq. mi.
Population density: 146 people per square mile (very low).
OSM Map
General Map
Google Map
MSN Map
OSM Map
General Map
Google Map
MSN Map
OSM Map
General Map
Google Map
MSN Map
OSM Map
General Map
Google Map
MSN Map
Please wait while loading the map...
Real estate property taxes paid for housing units in 2022:
This zip code:
1.1% ($4,765)Florida:
0.7% ($2,529)
Median real estate property taxes paid for housing units with mortgages in 2022: $3,927 (0.9%)
Median real estate property taxes paid for housing units with no mortgage in 2022: $5,207 (1.3%)
Profiles of local businesses
Business Search - 14 Million verified businesses
Males: 7,352 Females: 7,563
For population 25 years and over in 34987:
High school or higher: 97.3%Bachelor's degree or higher: 42.9%Graduate or professional degree: 17.6%Unemployed: 2.9%Mean travel time to work (commute): 27.9 minutes
For population 15 years and over in 34987:
Never married: 15.0%Now married: 67.3%Separated: 1.7%Widowed: 7.7%Divorced: 8.3%
Zip code 34987 compared to state average:
Hispanic race population percentage below state average. Median age significantly above state average. Renting percentage below state average. Length of stay since moving in significantly below state average. House age significantly below state average. 10,690 71.7% White 2,365 15.9% Black 1,439 9.6% Hispanic or Latino 242 1.6% Asian 142 1.0% Two or more races 23 0.2% American Indian 11 0.07% Native Hawaiian and Other
Data:
Median household income ($)
Median household income (% change since 2000)
Household income diversity
Ratio of average income to average house value (%)
Ratio of average income to average rent
Median household income ($) - White
Median household income ($) - Black or African American
Median household income ($) - Asian
Median household income ($) - Hispanic or Latino
Median household income ($) - American Indian and Alaska Native
Median household income ($) - Multirace
Median household income ($) - Other Race
Median household income for houses/condos with a mortgage ($)
Median household income for apartments without a mortgage ($)
Races - White alone (%)
Races - White alone (% change since 2000)
Races - Black alone (%)
Races - Black alone (% change since 2000)
Races - American Indian alone (%)
Races - American Indian alone (% change since 2000)
Races - Asian alone (%)
Races - Asian alone (% change since 2000)
Races - Hispanic (%)
Races - Hispanic (% change since 2000)
Races - Native Hawaiian and Other Pacific Islander alone (%)
Races - Native Hawaiian and Other Pacific Islander alone (% change since 2000)
Races - Two or more races (%)
Races - Two or more races (% change since 2000)
Races - Other race alone (%)
Races - Other race alone (% change since 2000)
Racial diversity
Unemployment (%)
Unemployment (% change since 2000)
Unemployment (%) - White
Unemployment (%) - Black or African American
Unemployment (%) - Asian
Unemployment (%) - Hispanic or Latino
Unemployment (%) - American Indian and Alaska Native
Unemployment (%) - Multirace
Unemployment (%) - Other Race
Population density (people per square mile)
Population - Males (%)
Population - Females (%)
Population - Males (%) - White
Population - Males (%) - Black or African American
Population - Males (%) - Asian
Population - Males (%) - Hispanic or Latino
Population - Males (%) - American Indian and Alaska Native
Population - Males (%) - Multirace
Population - Males (%) - Other Race
Population - Females (%) - White
Population - Females (%) - Black or African American
Population - Females (%) - Asian
Population - Females (%) - Hispanic or Latino
Population - Females (%) - American Indian and Alaska Native
Population - Females (%) - Multirace
Population - Females (%) - Other Race
Coronavirus confirmed cases (Apr 26, 2024)
Deaths caused by coronavirus (Apr 26, 2024)
Coronavirus confirmed cases (per 100k population) (Apr 26, 2024)
Deaths caused by coronavirus (per 100k population) (Apr 26, 2024)
Daily increase in number of cases (Apr 26, 2024)
Weekly increase in number of cases (Apr 26, 2024)
Cases doubled (in days) (Apr 26, 2024)
Hospitalized patients (Apr 18, 2022)
Negative test results (Apr 18, 2022)
Total test results (Apr 18, 2022)
COVID Vaccine doses distributed (per 100k population) (Sep 19, 2023)
COVID Vaccine doses administered (per 100k population) (Sep 19, 2023)
COVID Vaccine doses distributed (Sep 19, 2023)
COVID Vaccine doses administered (Sep 19, 2023)
Likely homosexual households (%)
Likely homosexual households (% change since 2000)
Likely homosexual households - Lesbian couples (%)
Likely homosexual households - Lesbian couples (% change since 2000)
Likely homosexual households - Gay men (%)
Likely homosexual households - Gay men (% change since 2000)
Cost of living index
Median gross rent ($)
Median contract rent ($)
Median monthly housing costs ($)
Median house or condo value ($)
Median house or condo value ($ change since 2000)
Mean house or condo value by units in structure - 1, detached ($)
Mean house or condo value by units in structure - 1, attached ($)
Mean house or condo value by units in structure - 2 ($)
Mean house or condo value by units in structure by units in structure - 3 or 4 ($)
Mean house or condo value by units in structure - 5 or more ($)
Mean house or condo value by units in structure - Boat, RV, van, etc. ($)
Mean house or condo value by units in structure - Mobile home ($)
Median house or condo value ($) - White
Median house or condo value ($) - Black or African American
Median house or condo value ($) - Asian
Median house or condo value ($) - Hispanic or Latino
Median house or condo value ($) - American Indian and Alaska Native
Median house or condo value ($) - Multirace
Median house or condo value ($) - Other Race
Median resident age
Resident age diversity
Median resident age - Males
Median resident age - Females
Median resident age - White
Median resident age - Black or African American
Median resident age - Asian
Median resident age - Hispanic or Latino
Median resident age - American Indian and Alaska Native
Median resident age - Multirace
Median resident age - Other Race
Median resident age - Males - White
Median resident age - Males - Black or African American
Median resident age - Males - Asian
Median resident age - Males - Hispanic or Latino
Median resident age - Males - American Indian and Alaska Native
Median resident age - Males - Multirace
Median resident age - Males - Other Race
Median resident age - Females - White
Median resident age - Females - Black or African American
Median resident age - Females - Asian
Median resident age - Females - Hispanic or Latino
Median resident age - Females - American Indian and Alaska Native
Median resident age - Females - Multirace
Median resident age - Females - Other Race
Commute - mean travel time to work (minutes)
Travel time to work - Less than 5 minutes (%)
Travel time to work - Less than 5 minutes (% change since 2000)
Travel time to work - 5 to 9 minutes (%)
Travel time to work - 5 to 9 minutes (% change since 2000)
Travel time to work - 10 to 19 minutes (%)
Travel time to work - 10 to 19 minutes (% change since 2000)
Travel time to work - 20 to 29 minutes (%)
Travel time to work - 20 to 29 minutes (% change since 2000)
Travel time to work - 30 to 39 minutes (%)
Travel time to work - 30 to 39 minutes (% change since 2000)
Travel time to work - 40 to 59 minutes (%)
Travel time to work - 40 to 59 minutes (% change since 2000)
Travel time to work - 60 to 89 minutes (%)
Travel time to work - 60 to 89 minutes (% change since 2000)
Travel time to work - 90 or more minutes (%)
Travel time to work - 90 or more minutes (% change since 2000)
Marital status - Never married (%)
Marital status - Now married (%)
Marital status - Separated (%)
Marital status - Widowed (%)
Marital status - Divorced (%)
Median family income ($)
Median family income (% change since 2000)
Median non-family income ($)
Median non-family income (% change since 2000)
Median per capita income ($)
Median per capita income (% change since 2000)
Median family income ($) - White
Median family income ($) - Black or African American
Median family income ($) - Asian
Median family income ($) - Hispanic or Latino
Median family income ($) - American Indian and Alaska Native
Median family income ($) - Multirace
Median family income ($) - Other Race
Median year house/condo built
Median year apartment built
Year house built - Built 2005 or later (%)
Year house built - Built 2000 to 2004 (%)
Year house built - Built 1990 to 1999 (%)
Year house built - Built 1980 to 1989 (%)
Year house built - Built 1970 to 1979 (%)
Year house built - Built 1960 to 1969 (%)
Year house built - Built 1950 to 1959 (%)
Year house built - Built 1940 to 1949 (%)
Year house built - Built 1939 or earlier (%)
Average household size
Household density (households per square mile)
Average household size - White
Average household size - Black or African American
Average household size - Asian
Average household size - Hispanic or Latino
Average household size - American Indian and Alaska Native
Average household size - Multirace
Average household size - Other Race
Occupied housing units (%)
Vacant housing units (%)
Owner occupied housing units (%)
Renter occupied housing units (%)
Vacancy status - For rent (%)
Vacancy status - For sale only (%)
Vacancy status - Rented or sold, not occupied (%)
Vacancy status - For seasonal, recreational, or occasional use (%)
Vacancy status - For migrant workers (%)
Vacancy status - Other vacant (%)
Residents with income below the poverty level (%)
Residents with income below 50% of the poverty level (%)
Children below poverty level (%)
Poor families by family type - Married-couple family (%)
Poor families by family type - Male, no wife present (%)
Poor families by family type - Female, no husband present (%)
Poverty status for native-born residents (%)
Poverty status for foreign-born residents (%)
Poverty among high school graduates not in families (%)
Poverty among people who did not graduate high school not in families (%)
Residents with income below the poverty level (%) - White
Residents with income below the poverty level (%) - Black or African American
Residents with income below the poverty level (%) - Asian
Residents with income below the poverty level (%) - Hispanic or Latino
Residents with income below the poverty level (%) - American Indian and Alaska Native
Residents with income below the poverty level (%) - Multirace
Residents with income below the poverty level (%) - Other Race
Air pollution - Air Quality Index (AQI)
Air pollution - CO
Air pollution - NO2
Air pollution - SO2
Air pollution - Ozone
Air pollution - PM10
Air pollution - PM25
Air pollution - Pb
Crime - Murders per 100,000 population
Crime - Rapes per 100,000 population
Crime - Robberies per 100,000 population
Crime - Assaults per 100,000 population
Crime - Burglaries per 100,000 population
Crime - Thefts per 100,000 population
Crime - Auto thefts per 100,000 population
Crime - Arson per 100,000 population
Crime - City-data.com crime index
Crime - Violent crime index
Crime - Property crime index
Crime - Murders per 100,000 population (5 year average)
Crime - Rapes per 100,000 population (5 year average)
Crime - Robberies per 100,000 population (5 year average)
Crime - Assaults per 100,000 population (5 year average)
Crime - Burglaries per 100,000 population (5 year average)
Crime - Thefts per 100,000 population (5 year average)
Crime - Auto thefts per 100,000 population (5 year average)
Crime - Arson per 100,000 population (5 year average)
Crime - City-data.com crime index (5 year average)
Crime - Violent crime index (5 year average)
Crime - Property crime index (5 year average)
1996 Presidential Elections Results (%) - Democratic Party (Clinton)
1996 Presidential Elections Results (%) - Republican Party (Dole)
1996 Presidential Elections Results (%) - Other
2000 Presidential Elections Results (%) - Democratic Party (Gore)
2000 Presidential Elections Results (%) - Republican Party (Bush)
2000 Presidential Elections Results (%) - Other
2004 Presidential Elections Results (%) - Democratic Party (Kerry)
2004 Presidential Elections Results (%) - Republican Party (Bush)
2004 Presidential Elections Results (%) - Other
2008 Presidential Elections Results (%) - Democratic Party (Obama)
2008 Presidential Elections Results (%) - Republican Party (McCain)
2008 Presidential Elections Results (%) - Other
2012 Presidential Elections Results (%) - Democratic Party (Obama)
2012 Presidential Elections Results (%) - Republican Party (Romney)
2012 Presidential Elections Results (%) - Other
2016 Presidential Elections Results (%) - Democratic Party (Clinton)
2016 Presidential Elections Results (%) - Republican Party (Trump)
2016 Presidential Elections Results (%) - Other
2020 Presidential Elections Results (%) - Democratic Party (Biden)
2020 Presidential Elections Results (%) - Republican Party (Trump)
2020 Presidential Elections Results (%) - Other
Ancestries Reported - Arab (%)
Ancestries Reported - Czech (%)
Ancestries Reported - Danish (%)
Ancestries Reported - Dutch (%)
Ancestries Reported - English (%)
Ancestries Reported - French (%)
Ancestries Reported - French Canadian (%)
Ancestries Reported - German (%)
Ancestries Reported - Greek (%)
Ancestries Reported - Hungarian (%)
Ancestries Reported - Irish (%)
Ancestries Reported - Italian (%)
Ancestries Reported - Lithuanian (%)
Ancestries Reported - Norwegian (%)
Ancestries Reported - Polish (%)
Ancestries Reported - Portuguese (%)
Ancestries Reported - Russian (%)
Ancestries Reported - Scotch-Irish (%)
Ancestries Reported - Scottish (%)
Ancestries Reported - Slovak (%)
Ancestries Reported - Subsaharan African (%)
Ancestries Reported - Swedish (%)
Ancestries Reported - Swiss (%)
Ancestries Reported - Ukrainian (%)
Ancestries Reported - United States (%)
Ancestries Reported - Welsh (%)
Ancestries Reported - West Indian (%)
Ancestries Reported - Other (%)
Educational Attainment - No schooling completed (%)
Educational Attainment - Less than high school (%)
Educational Attainment - High school or equivalent (%)
Educational Attainment - Less than 1 year of college (%)
Educational Attainment - 1 or more years of college (%)
Educational Attainment - Associate degree (%)
Educational Attainment - Bachelor's degree (%)
Educational Attainment - Master's degree (%)
Educational Attainment - Professional school degree (%)
Educational Attainment - Doctorate degree (%)
School Enrollment - Nursery, preschool (%)
School Enrollment - Kindergarten (%)
School Enrollment - Grade 1 to 4 (%)
School Enrollment - Grade 5 to 8 (%)
School Enrollment - Grade 9 to 12 (%)
School Enrollment - College undergrad (%)
School Enrollment - Graduate or professional (%)
School Enrollment - Not enrolled in school (%)
School enrollment - Public schools (%)
School enrollment - Private schools (%)
School enrollment - Not enrolled (%)
Median number of rooms in houses and condos
Median number of rooms in apartments
Housing units lacking complete plumbing facilities (%)
Housing units lacking complete kitchen facilities (%)
Density of houses
Urban houses (%)
Rural houses (%)
Households with people 60 years and over (%)
Households with people 65 years and over (%)
Households with people 75 years and over (%)
Households with one or more nonrelatives (%)
Households with no nonrelatives (%)
Population in households (%)
Family households (%)
Nonfamily households (%)
Population in families (%)
Family households with own children (%)
Median number of bedrooms in owner occupied houses
Mean number of bedrooms in owner occupied houses
Median number of bedrooms in renter occupied houses
Mean number of bedrooms in renter occupied houses
Median number of vehichles in owner occupied houses
Mean number of vehichles in owner occupied houses
Median number of vehichles in renter occupied houses
Mean number of vehichles in renter occupied houses
Mortgage status - with mortgage (%)
Mortgage status - with second mortgage (%)
Mortgage status - with home equity loan (%)
Mortgage status - with both second mortgage and home equity loan (%)
Mortgage status - without a mortgage (%)
Average family size
Average family size - White
Average family size - Black or African American
Average family size - Asian
Average family size - Hispanic or Latino
Average family size - American Indian and Alaska Native
Average family size - Multirace
Average family size - Other Race
Geographical mobility - Same house 1 year ago (%)
Geographical mobility - Moved within same county (%)
Geographical mobility - Moved from different county within same state (%)
Geographical mobility - Moved from different state (%)
Geographical mobility - Moved from abroad (%)
Place of birth - Born in state of residence (%)
Place of birth - Born in other state (%)
Place of birth - Native, outside of US (%)
Place of birth - Foreign born (%)
Housing units in structures - 1, detached (%)
Housing units in structures - 1, attached (%)
Housing units in structures - 2 (%)
Housing units in structures - 3 or 4 (%)
Housing units in structures - 5 to 9 (%)
Housing units in structures - 10 to 19 (%)
Housing units in structures - 20 to 49 (%)
Housing units in structures - 50 or more (%)
Housing units in structures - Mobile home (%)
Housing units in structures - Boat, RV, van, etc. (%)
House/condo owner moved in on average (years ago)
Renter moved in on average (years ago)
Year householder moved into unit - Moved in 1999 to March 2000 (%)
Year householder moved into unit - Moved in 1995 to 1998 (%)
Year householder moved into unit - Moved in 1990 to 1994 (%)
Year householder moved into unit - Moved in 1980 to 1989 (%)
Year householder moved into unit - Moved in 1970 to 1979 (%)
Year householder moved into unit - Moved in 1969 or earlier (%)
Means of transportation to work - Drove car alone (%)
Means of transportation to work - Carpooled (%)
Means of transportation to work - Public transportation (%)
Means of transportation to work - Bus or trolley bus (%)
Means of transportation to work - Streetcar or trolley car (%)
Means of transportation to work - Subway or elevated (%)
Means of transportation to work - Railroad (%)
Means of transportation to work - Ferryboat (%)
Means of transportation to work - Taxicab (%)
Means of transportation to work - Motorcycle (%)
Means of transportation to work - Bicycle (%)
Means of transportation to work - Walked (%)
Means of transportation to work - Other means (%)
Working at home (%)
Industry diversity
Most Common Industries - Agriculture, forestry, fishing and hunting, and mining (%)
Most Common Industries - Agriculture, forestry, fishing and hunting (%)
Most Common Industries - Mining, quarrying, and oil and gas extraction (%)
Most Common Industries - Construction (%)
Most Common Industries - Manufacturing (%)
Most Common Industries - Wholesale trade (%)
Most Common Industries - Retail trade (%)
Most Common Industries - Transportation and warehousing, and utilities (%)
Most Common Industries - Transportation and warehousing (%)
Most Common Industries - Utilities (%)
Most Common Industries - Information (%)
Most Common Industries - Finance and insurance, and real estate and rental and leasing (%)
Most Common Industries - Finance and insurance (%)
Most Common Industries - Real estate and rental and leasing (%)
Most Common Industries - Professional, scientific, and management, and administrative and waste management services (%)
Most Common Industries - Professional, scientific, and technical services (%)
Most Common Industries - Management of companies and enterprises (%)
Most Common Industries - Administrative and support and waste management services (%)
Most Common Industries - Educational services, and health care and social assistance (%)
Most Common Industries - Educational services (%)
Most Common Industries - Health care and social assistance (%)
Most Common Industries - Arts, entertainment, and recreation, and accommodation and food services (%)
Most Common Industries - Arts, entertainment, and recreation (%)
Most Common Industries - Accommodation and food services (%)
Most Common Industries - Other services, except public administration (%)
Most Common Industries - Public administration (%)
Occupation diversity
Most Common Occupations - Management, business, science, and arts occupations (%)
Most Common Occupations - Management, business, and financial occupations (%)
Most Common Occupations - Management occupations (%)
Most Common Occupations - Business and financial operations occupations (%)
Most Common Occupations - Computer, engineering, and science occupations (%)
Most Common Occupations - Computer and mathematical occupations (%)
Most Common Occupations - Architecture and engineering occupations (%)
Most Common Occupations - Life, physical, and social science occupations (%)
Most Common Occupations - Education, legal, community service, arts, and media occupations (%)
Most Common Occupations - Community and social service occupations (%)
Most Common Occupations - Legal occupations (%)
Most Common Occupations - Education, training, and library occupations (%)
Most Common Occupations - Arts, design, entertainment, sports, and media occupations (%)
Most Common Occupations - Healthcare practitioners and technical occupations (%)
Most Common Occupations - Health diagnosing and treating practitioners and other technical occupations (%)
Most Common Occupations - Health technologists and technicians (%)
Most Common Occupations - Service occupations (%)
Most Common Occupations - Healthcare support occupations (%)
Most Common Occupations - Protective service occupations (%)
Most Common Occupations - Fire fighting and prevention, and other protective service workers including supervisors (%)
Most Common Occupations - Law enforcement workers including supervisors (%)
Most Common Occupations - Food preparation and serving related occupations (%)
Most Common Occupations - Building and grounds cleaning and maintenance occupations (%)
Most Common Occupations - Personal care and service occupations (%)
Most Common Occupations - Sales and office occupations (%)
Most Common Occupations - Sales and related occupations (%)
Most Common Occupations - Office and administrative support occupations (%)
Most Common Occupations - Natural resources, construction, and maintenance occupations (%)
Most Common Occupations - Farming, fishing, and forestry occupations (%)
Most Common Occupations - Construction and extraction occupations (%)
Most Common Occupations - Installation, maintenance, and repair occupations (%)
Most Common Occupations - Production, transportation, and material moving occupations (%)
Most Common Occupations - Production occupations (%)
Most Common Occupations - Transportation occupations (%)
Most Common Occupations - Material moving occupations (%)
People in Group quarters - Institutionalized population (%)
People in Group quarters - Correctional institutions (%)
People in Group quarters - Federal prisons and detention centers (%)
People in Group quarters - Halfway houses (%)
People in Group quarters - Local jails and other confinement facilities (including police lockups) (%)
People in Group quarters - Military disciplinary barracks (%)
People in Group quarters - State prisons (%)
People in Group quarters - Other types of correctional institutions (%)
People in Group quarters - Nursing homes (%)
People in Group quarters - Hospitals/wards, hospices, and schools for the handicapped (%)
People in Group quarters - Hospitals/wards and hospices for chronically ill (%)
People in Group quarters - Hospices or homes for chronically ill (%)
People in Group quarters - Military hospitals or wards for chronically ill (%)
People in Group quarters - Other hospitals or wards for chronically ill (%)
People in Group quarters - Hospitals or wards for drug/alcohol abuse (%)
People in Group quarters - Mental (Psychiatric) hospitals or wards (%)
People in Group quarters - Schools, hospitals, or wards for the mentally retarded (%)
People in Group quarters - Schools, hospitals, or wards for the physically handicapped (%)
People in Group quarters - Institutions for the deaf (%)
People in Group quarters - Institutions for the blind (%)
People in Group quarters - Orthopedic wards and institutions for the physically handicapped (%)
People in Group quarters - Wards in general hospitals for patients who have no usual home elsewhere (%)
People in Group quarters - Wards in military hospitals for patients who have no usual home elsewhere (%)
People in Group quarters - Juvenile institutions (%)
People in Group quarters - Long-term care (%)
People in Group quarters - Homes for abused, dependent, and neglected children (%)
People in Group quarters - Residential treatment centers for emotionally disturbed children (%)
People in Group quarters - Training schools for juvenile delinquents (%)
People in Group quarters - Short-term care, detention or diagnostic centers for delinquent children (%)
People in Group quarters - Type of juvenile institution unknown (%)
People in Group quarters - Noninstitutionalized population (%)
People in Group quarters - College dormitories (includes college quarters off campus) (%)
People in Group quarters - Military quarters (%)
People in Group quarters - On base (%)
People in Group quarters - Barracks, unaccompanied personnel housing (UPH), (Enlisted/Officer), ;and similar group living quarters for military personnel (%)
People in Group quarters - Transient quarters for temporary residents (%)
People in Group quarters - Military ships (%)
People in Group quarters - Group homes (%)
People in Group quarters - Homes or halfway houses for drug/alcohol abuse (%)
People in Group quarters - Homes for the mentally ill (%)
People in Group quarters - Homes for the mentally retarded (%)
People in Group quarters - Homes for the physically handicapped (%)
People in Group quarters - Other group homes (%)
People in Group quarters - Religious group quarters (%)
People in Group quarters - Dormitories (%)
People in Group quarters - Agriculture workers' dormitories on farms (%)
People in Group quarters - Job Corps and vocational training facilities (%)
People in Group quarters - Other workers' dormitories (%)
People in Group quarters - Crews of maritime vessels (%)
People in Group quarters - Other nonhousehold living situations (%)
People in Group quarters - Other noninstitutional group quarters (%)
Residents speaking English at home (%)
Residents speaking English at home - Born in the United States (%)
Residents speaking English at home - Native, born elsewhere (%)
Residents speaking English at home - Foreign born (%)
Residents speaking Spanish at home (%)
Residents speaking Spanish at home - Born in the United States (%)
Residents speaking Spanish at home - Native, born elsewhere (%)
Residents speaking Spanish at home - Foreign born (%)
Residents speaking other language at home (%)
Residents speaking other language at home - Born in the United States (%)
Residents speaking other language at home - Native, born elsewhere (%)
Residents speaking other language at home - Foreign born (%)
Class of Workers - Employee of private company (%)
Class of Workers - Self-employed in own incorporated business (%)
Class of Workers - Private not-for-profit wage and salary workers (%)
Class of Workers - Local government workers (%)
Class of Workers - State government workers (%)
Class of Workers - Federal government workers (%)
Class of Workers - Self-employed workers in own not incorporated business and Unpaid family workers (%)
House heating fuel used in houses and condos - Utility gas (%)
House heating fuel used in houses and condos - Bottled, tank, or LP gas (%)
House heating fuel used in houses and condos - Electricity (%)
House heating fuel used in houses and condos - Fuel oil, kerosene, etc. (%)
House heating fuel used in houses and condos - Coal or coke (%)
House heating fuel used in houses and condos - Wood (%)
House heating fuel used in houses and condos - Solar energy (%)
House heating fuel used in houses and condos - Other fuel (%)
House heating fuel used in houses and condos - No fuel used (%)
House heating fuel used in apartments - Utility gas (%)
House heating fuel used in apartments - Bottled, tank, or LP gas (%)
House heating fuel used in apartments - Electricity (%)
House heating fuel used in apartments - Fuel oil, kerosene, etc. (%)
House heating fuel used in apartments - Coal or coke (%)
House heating fuel used in apartments - Wood (%)
House heating fuel used in apartments - Solar energy (%)
House heating fuel used in apartments - Other fuel (%)
House heating fuel used in apartments - No fuel used (%)
Armed forces status - In Armed Forces (%)
Armed forces status - Civilian (%)
Armed forces status - Civilian - Veteran (%)
Armed forces status - Civilian - Nonveteran (%)
Fatal accidents locations in years 2005-2021
Fatal accidents locations in 2005
Fatal accidents locations in 2006
Fatal accidents locations in 2007
Fatal accidents locations in 2008
Fatal accidents locations in 2009
Fatal accidents locations in 2010
Fatal accidents locations in 2011
Fatal accidents locations in 2012
Fatal accidents locations in 2013
Fatal accidents locations in 2014
Fatal accidents locations in 2015
Fatal accidents locations in 2016
Fatal accidents locations in 2017
Fatal accidents locations in 2018
Fatal accidents locations in 2019
Fatal accidents locations in 2020
Fatal accidents locations in 2021
Alcohol use - People drinking some alcohol every month (%)
Alcohol use - People not drinking at all (%)
Alcohol use - Average days/month drinking alcohol
Alcohol use - Average drinks/week
Alcohol use - Average days/year people drink much
Audiometry - Average condition of hearing (%)
Audiometry - People that can hear a whisper from across a quiet room (%)
Audiometry - People that can hear normal voice from across a quiet room (%)
Audiometry - Ears ringing, roaring, buzzing (%)
Audiometry - Had a job exposure to loud noise (%)
Audiometry - Had off-work exposure to loud noise (%)
Blood Pressure & Cholesterol - Has high blood pressure (%)
Blood Pressure & Cholesterol - Checking blood pressure at home (%)
Blood Pressure & Cholesterol - Frequently checking blood cholesterol (%)
Blood Pressure & Cholesterol - Has high cholesterol level (%)
Consumer Behavior - Money monthly spent on food at supermarket/grocery store
Consumer Behavior - Money monthly spent on food at other stores
Consumer Behavior - Money monthly spent on eating out
Consumer Behavior - Money monthly spent on carryout/delivered foods
Consumer Behavior - Income spent on food at supermarket/grocery store (%)
Consumer Behavior - Income spent on food at other stores (%)
Consumer Behavior - Income spent on eating out (%)
Consumer Behavior - Income spent on carryout/delivered foods (%)
Current Health Status - General health condition (%)
Current Health Status - Blood donors (%)
Current Health Status - Has blood ever tested for HIV virus (%)
Current Health Status - Left-handed people (%)
Dermatology - People using sunscreen (%)
Diabetes - Diabetics (%)
Diabetes - Had a blood test for high blood sugar (%)
Diabetes - People taking insulin (%)
Diet Behavior & Nutrition - Diet health (%)
Diet Behavior & Nutrition - Milk product consumption (# of products/month)
Diet Behavior & Nutrition - Meals not home prepared (#/week)
Diet Behavior & Nutrition - Meals from fast food or pizza place (#/week)
Diet Behavior & Nutrition - Ready-to-eat foods (#/month)
Diet Behavior & Nutrition - Frozen meals/pizza (#/month)
Drug Use - People that ever used marijuana or hashish (%)
Drug Use - Ever used hard drugs (%)
Drug Use - Ever used any form of cocaine (%)
Drug Use - Ever used heroin (%)
Drug Use - Ever used methamphetamine (%)
Health Insurance - People covered by health insurance (%)
Kidney Conditions-Urology - Avg. # of times urinating at night
Medical Conditions - People with asthma (%)
Medical Conditions - People with anemia (%)
Medical Conditions - People with psoriasis (%)
Medical Conditions - People with overweight (%)
Medical Conditions - Elderly people having difficulties in thinking or remembering (%)
Medical Conditions - People who ever received blood transfusion (%)
Medical Conditions - People having trouble seeing even with glass/contacts (%)
Medical Conditions - People with arthritis (%)
Medical Conditions - People with gout (%)
Medical Conditions - People with congestive heart failure (%)
Medical Conditions - People with coronary heart disease (%)
Medical Conditions - People with angina pectoris (%)
Medical Conditions - People who ever had heart attack (%)
Medical Conditions - People who ever had stroke (%)
Medical Conditions - People with emphysema (%)
Medical Conditions - People with thyroid problem (%)
Medical Conditions - People with chronic bronchitis (%)
Medical Conditions - People with any liver condition (%)
Medical Conditions - People who ever had cancer or malignancy (%)
Mental Health - People who have little interest in doing things (%)
Mental Health - People feeling down, depressed, or hopeless (%)
Mental Health - People who have trouble sleeping or sleeping too much (%)
Mental Health - People feeling tired or having little energy (%)
Mental Health - People with poor appetite or overeating (%)
Mental Health - People feeling bad about themself (%)
Mental Health - People who have trouble concentrating on things (%)
Mental Health - People moving or speaking slowly or too fast (%)
Mental Health - People having thoughts they would be better off dead (%)
Oral Health - Average years since last visit a dentist
Oral Health - People embarrassed because of mouth (%)
Oral Health - People with gum disease (%)
Oral Health - General health of teeth and gums (%)
Oral Health - Average days a week using dental floss/device
Oral Health - Average days a week using mouthwash for dental problem
Oral Health - Average number of teeth
Pesticide Use - Households using pesticides to control insects (%)
Pesticide Use - Households using pesticides to kill weeds (%)
Physical Activity - People doing vigorous-intensity work activities (%)
Physical Activity - People doing moderate-intensity work activities (%)
Physical Activity - People walking or bicycling (%)
Physical Activity - People doing vigorous-intensity recreational activities (%)
Physical Activity - People doing moderate-intensity recreational activities (%)
Physical Activity - Average hours a day doing sedentary activities
Physical Activity - Average hours a day watching TV or videos
Physical Activity - Average hours a day using computer
Physical Functioning - People having limitations keeping them from working (%)
Physical Functioning - People limited in amount of work they can do (%)
Physical Functioning - People that need special equipment to walk (%)
Physical Functioning - People experiencing confusion/memory problems (%)
Physical Functioning - People requiring special healthcare equipment (%)
Prescription Medications - Average number of prescription medicines taking
Preventive Aspirin Use - Adults 40+ taking low-dose aspirin (%)
Reproductive Health - Vaginal deliveries (%)
Reproductive Health - Cesarean deliveries (%)
Reproductive Health - Deliveries resulted in a live birth (%)
Reproductive Health - Pregnancies resulted in a delivery (%)
Reproductive Health - Women breastfeeding newborns (%)
Reproductive Health - Women that had a hysterectomy (%)
Reproductive Health - Women that had both ovaries removed (%)
Reproductive Health - Women that have ever taken birth control pills (%)
Reproductive Health - Women taking birth control pills (%)
Reproductive Health - Women that have ever used Depo-Provera or injectables (%)
Reproductive Health - Women that have ever used female hormones (%)
Sexual Behavior - People 18+ that ever had sex (vaginal, anal, or oral) (%)
Sexual Behavior - Males 18+ that ever had vaginal sex with a woman (%)
Sexual Behavior - Males 18+ that ever performed oral sex on a woman (%)
Sexual Behavior - Males 18+ that ever had anal sex with a woman (%)
Sexual Behavior - Males 18+ that ever had any sex with a man (%)
Sexual Behavior - Females 18+ that ever had vaginal sex with a man (%)
Sexual Behavior - Females 18+ that ever performed oral sex on a man (%)
Sexual Behavior - Females 18+ that ever had anal sex with a man (%)
Sexual Behavior - Females 18+ that ever had any kind of sex with a woman (%)
Sexual Behavior - Average age people first had sex
Sexual Behavior - Average number of female sex partners in lifetime (males 18+)
Sexual Behavior - Average number of female vaginal sex partners in lifetime (males 18+)
Sexual Behavior - Average age people first performed oral sex on a woman (18+)
Sexual Behavior - Average number of woman performed oral sex on in lifetime (18+)
Sexual Behavior - Average number of male sex partners in lifetime (males 18+)
Sexual Behavior - Average number of male anal sex partners in lifetime (males 18+)
Sexual Behavior - Average age people first performed oral sex on a man (18+)
Sexual Behavior - Average number of male oral sex partners in lifetime (18+)
Sexual Behavior - People using protection when performing oral sex (%)
Sexual Behavior - Average number of times people have vaginal or anal sex a year
Sexual Behavior - People having sex without condom (%)
Sexual Behavior - Average number of male sex partners in lifetime (females 18+)
Sexual Behavior - Average number of male vaginal sex partners in lifetime (females 18+)
Sexual Behavior - Average number of female sex partners in lifetime (females 18+)
Sexual Behavior - Circumcised males 18+ (%)
Sleep Disorders - Average hours sleeping at night
Sleep Disorders - People that has trouble sleeping (%)
Smoking-Cigarette Use - People smoking cigarettes (%)
Taste & Smell - People 40+ having problems with smell (%)
Taste & Smell - People 40+ having problems with taste (%)
Taste & Smell - People 40+ that ever had wisdom teeth removed (%)
Taste & Smell - People 40+ that ever had tonsils teeth removed (%)
Taste & Smell - People 40+ that ever had a loss of consciousness because of a head injury (%)
Taste & Smell - People 40+ that ever had a broken nose or other serious injury to face or skull (%)
Taste & Smell - People 40+ that ever had two or more sinus infections (%)
Weight - Average height (inches)
Weight - Average weight (pounds)
Weight - Average BMI
Weight - People that are obese (%)
Weight - People that ever were obese (%)
Weight - People trying to lose weight (%)
Urban population: 4,316
Rural population: 10,599
Estimated median house/condo value in 2022: $426,205
34987:
$426,205Florida:
$354,100
Median resident age: This zip code:
60.2 yearsFlorida median age:
42.7 years
Average household size: This zip code:
2.2 peopleFlorida:
2.5 people
Averages for the 2020 tax year for zip code 34987, filed in 2021:
Average Adjusted Gross Income (AGI) in 2020: $88,457 (Individual Income Tax Returns) Here:
$88,457State:
$82,200
Salary/wage: $70,881 (reported on 66.7% of returns )Here:
$70,881State:
$58,347
(% of AGI for various income ranges: 1044.0% for AGIs below $25k , 3034.3% for AGIs $25k-50k , 5329.7% for AGIs $50k-75k , 7510.5% for AGIs $75k-100k , 13560.2% for AGIs $100k-200k , 56109.1% for AGIs over 200k ) Taxable interest for individuals: $2,111 (reported on 41.7% of returns )This zip code:
$2,111Florida:
$4,272
(% of AGI for various income ranges: 45.6% for AGIs below $25k , 67.0% for AGIs $25k-50k , 105.3% for AGIs $50k-75k , 122.0% for AGIs $75k-100k , 218.5% for AGIs $100k-200k , 1031.7% for AGIs over 200k ) Ordinary dividends: $7,214 (reported on 32.1% of returns )(% of AGI for various income ranges: 80.1% for AGIs below $25k , 140.6% for AGIs $25k-50k , 236.8% for AGIs $50k-75k , 280.3% for AGIs $75k-100k , 562.2% for AGIs $100k-200k , 3520.9% for AGIs over 200k ) Net capital gain/loss in AGI: +$16,355 (reported on 30.6% of returns )Here:
+$16,355State:
+$62,983
(% of AGI for various income ranges: 17.0% for AGIs below $25k , 63.8% for AGIs $25k-50k , 154.4% for AGIs $50k-75k , 302.6% for AGIs $75k-100k , 849.3% for AGIs $100k-200k , 14303.9% for AGIs over 200k ) Profit/loss from business: +$12,142 (reported on 19.3% of returns )Here:
+$12,142State:
+$9,719
(% of AGI for various income ranges: 138.0% for AGIs below $25k , 96.9% for AGIs $25k-50k , 220.8% for AGIs $50k-75k , 218.4% for AGIs $75k-100k , 537.3% for AGIs $100k-200k , 3913.0% for AGIs over 200k ) Taxable individual retirement arrangement distribution: $26,719 (reported on 20.5% of returns )34987:
$26,719Florida:
$24,823
(% of AGI for various income ranges: 153.1% for AGIs below $25k , 320.9% for AGIs $25k-50k , 528.7% for AGIs $50k-75k , 921.1% for AGIs $75k-100k , 1835.2% for AGIs $100k-200k , 5259.6% for AGIs over 200k ) Self-employed (Keogh) retirement plans: $19,240 (reported on 0.5% of returns )34987:
$19,240Florida:
$29,694
(% of AGI for various income ranges: 36.9% for AGIs $100k-200k , 223.9% for AGIs over 200k ) Total itemized deductions: $31,981 (reported on 12.3% of returns )Here:
$31,981State:
$45,393
(% of AGI for various income ranges: 125.4% for AGIs below $25k , 281.8% for AGIs $25k-50k , 585.7% for AGIs $50k-75k , 647.6% for AGIs $75k-100k , 1032.4% for AGIs $100k-200k , 4153.9% for AGIs over 200k ) Charity contributions: $8,190 (reported on 10.2% of returns )(% of AGI for various income ranges: 7.7% for AGIs below $25k , 32.3% for AGIs $25k-50k , 80.2% for AGIs $50k-75k , 127.7% for AGIs $75k-100k , 219.9% for AGIs $100k-200k , 1367.8% for AGIs over 200k ) Taxes paid: $7,234 (reported on 12.1% of returns )(% of AGI for various income ranges: 27.0% for AGIs below $25k , 60.5% for AGIs $25k-50k , 130.6% for AGIs $50k-75k , 143.6% for AGIs $75k-100k , 266.3% for AGIs $100k-200k , 747.0% for AGIs over 200k ) Earned income credit: $1,936 (reported on 8.0% of returns )(% of AGI for various income ranges: 59.7% for AGIs below $25k , 48.9% for AGIs $25k-50k ) Percentage of individuals using paid preparers for their 2020 taxes: 92.8%(% for various income ranges: 91.9% for AGIs below $25k , 93.5% for AGIs $25k-50k , 93.1% for AGIs $50k-75k , 92.5% for AGIs $75k-100k , 92.5% for AGIs $100k-200k , 94.4% for AGIs over 200k )
Averages for the 2012 tax year for zip code 34987, filed in 2013:
Average Adjusted Gross Income (AGI) in 2012: $67,637 (Individual Income Tax Returns) Here:
$67,637State:
$60,316
Salary/wage: $56,108 (reported on 75.6% of returns )Here:
$56,108State:
$45,277
(% of AGI for various income ranges: 61.8% for AGIs below $25k , 72.8% for AGIs $25k-50k , 66.3% for AGIs $50k-75k , 67.5% for AGIs $75k-100k , 68.0% for AGIs $100k-200k , 42.7% for AGIs over 200k ) Taxable interest for individuals: $2,159 (reported on 38.5% of returns )This zip code:
$2,159Florida:
$3,587
(% of AGI for various income ranges: 1.9% for AGIs below $25k , 1.6% for AGIs $25k-50k , 1.0% for AGIs $50k-75k , 1.2% for AGIs $75k-100k , 1.1% for AGIs $100k-200k , 1.3% for AGIs over 200k ) Ordinary dividends: $5,701 (reported on 26.3% of returns )(% of AGI for various income ranges: 3.7% for AGIs below $25k , 2.4% for AGIs $25k-50k , 1.9% for AGIs $50k-75k , 1.9% for AGIs $75k-100k , 1.5% for AGIs $100k-200k , 3.3% for AGIs over 200k ) Net capital gain/loss in AGI: +$7,631 (reported on 23.1% of returns )Here:
+$7,631State:
+$33,493
(% of AGI for various income ranges: 0.6% for AGIs $50k-75k , 2.0% for AGIs $100k-200k , 10.0% for AGIs over 200k ) Profit/loss from business: +$12,523 (reported on 18.3% of returns )Here:
+$12,523State:
+$10,012
(% of AGI for various income ranges: 11.9% for AGIs below $25k , 4.2% for AGIs $25k-50k , 1.6% for AGIs $50k-75k , 1.8% for AGIs $75k-100k , 1.3% for AGIs $100k-200k , 6.4% for AGIs over 200k ) Taxable individual retirement arrangement distribution: $24,552 (reported on 14.7% of returns )34987:
$24,552Florida:
$21,544
(% of AGI for various income ranges: 5.6% for AGIs below $25k , 3.2% for AGIs $25k-50k , 4.7% for AGIs $50k-75k , 3.7% for AGIs $75k-100k , 5.0% for AGIs $100k-200k , 8.8% for AGIs over 200k ) Total itemized deductions: $22,826 (23% of AGI, reported on 38.8% of returns )Here:
$22,826State:
$25,533
Here:
23.0% of AGIState:
18.0% of AGI
(% of AGI for various income ranges: 18.8% for AGIs below $25k , 15.3% for AGIs $25k-50k , 13.6% for AGIs $50k-75k , 12.7% for AGIs $75k-100k , 13.5% for AGIs $100k-200k , 9.6% for AGIs over 200k ) Charity contributions: $3,307 (reported on 33.0% of returns )(% of AGI for various income ranges: 1.1% for AGIs below $25k , 1.5% for AGIs $25k-50k , 1.4% for AGIs $50k-75k , 1.5% for AGIs $75k-100k , 1.7% for AGIs $100k-200k , 1.8% for AGIs over 200k ) Taxes paid: $5,783 (reported on 38.1% of returns )(% of AGI for various income ranges: 3.6% for AGIs below $25k , 3.5% for AGIs $25k-50k , 3.2% for AGIs $50k-75k , 3.2% for AGIs $75k-100k , 3.6% for AGIs $100k-200k , 2.8% for AGIs over 200k ) Earned income credit: $2,173 (reported on 14.1% of returns )(% of AGI for various income ranges: 6.3% for AGIs below $25k , 1.0% for AGIs $25k-50k ) Percentage of individuals using paid preparers for their 2012 taxes: 60.3%(% for various income ranges: 54.3% for AGIs below $25k , 62.1% for AGIs $25k-50k , 62.7% for AGIs $50k-75k , 57.5% for AGIs $75k-100k , 64.0% for AGIs $100k-200k , 81.8% for AGIs over 200k )
Averages for the 2004 tax year for zip code 34987, filed in 2005:
Average Adjusted Gross Income (AGI) in 2004: $57,341 (Individual Income Tax Returns) Here:
$57,341State:
$50,523
Salary/wage: $46,551 (reported on 84.2% of returns )Here:
$46,551State:
$39,563
(% of AGI for various income ranges: 125.6% for AGIs below $10k , 81.8% for AGIs $10k-25k , 81.7% for AGIs $25k-50k , 79.9% for AGIs $50k-75k , 78.2% for AGIs $75k-100k , 52.9% for AGIs over 100k ) Taxable interest for individuals: $1,966 (reported on 46.0% of returns )This zip code:
$1,966Florida:
$3,211
(% of AGI for various income ranges: 6.9% for AGIs below $10k , 3.0% for AGIs $10k-25k , 1.6% for AGIs $25k-50k , 2.0% for AGIs $50k-75k , 1.1% for AGIs $75k-100k , 1.3% for AGIs over 100k ) Taxable dividends: $2,566 (reported on 28.8% of returns )(% of AGI for various income ranges: 8.3% for AGIs below $10k , 2.0% for AGIs $10k-25k , 1.2% for AGIs $25k-50k , 1.7% for AGIs $50k-75k , 0.6% for AGIs $75k-100k , 1.2% for AGIs over 100k ) Net capital gain/loss: +$19,490 (reported on 24.5% of returns )Here:
+$19,490State:
+$27,205
(% of AGI for various income ranges: -1.0% for AGIs below $10k , -1.0% for AGIs $10k-25k , 2.1% for AGIs $25k-50k , 3.0% for AGIs $50k-75k , 2.6% for AGIs $75k-100k , 16.1% for AGIs over 100k ) Profit/loss from business: +$8,983 (reported on 17.4% of returns )Here:
+$8,983State:
+$10,634
(% of AGI for various income ranges: 26.2% for AGIs below $10k , 5.3% for AGIs $10k-25k , 2.1% for AGIs $25k-50k , -0.1% for AGIs $50k-75k , 3.7% for AGIs $75k-100k , 2.8% for AGIs over 100k ) IRA payment deduction: $2,958 (reported on 4.8% of returns )34987:
$2,958Florida:
$3,082
Total itemized deductions: $18,747 (24% of AGI, reported on 46.3% of returns )Here:
$18,747State:
$20,370
Here:
23.6% of AGIState:
20.7% of AGI
(% of AGI for various income ranges: 34.8% for AGIs below $10k , 14.3% for AGIs $10k-25k , 22.1% for AGIs $25k-50k , 20.9% for AGIs $50k-75k , 17.6% for AGIs $75k-100k , 9.4% for AGIs over 100k ) Charity contributions deductions: $2,957 (4% of AGI, reported on 39.1% of returns )Here:
3.5% of AGIState:
3.8% of AGI
(% of AGI for various income ranges: 1.3% for AGIs $10k-25k , 2.2% for AGIs $25k-50k , 2.3% for AGIs $50k-75k , 2.1% for AGIs $75k-100k , 2.0% for AGIs over 100k ) Total tax: $9,447 (reported on 77.9% of returns )(% of AGI for various income ranges: 5.8% for AGIs below $10k , 4.6% for AGIs $10k-25k , 5.9% for AGIs $25k-50k , 8.1% for AGIs $50k-75k , 10.7% for AGIs $75k-100k , 19.1% for AGIs over 100k ) Earned income credit: $1,472 (reported on 12.6% of returns )Percentage of individuals using paid preparers for their 2004 taxes: 62.8%(% for various income ranges: 52.4% for AGIs below $10k , 63.0% for AGIs $10k-25k , 62.7% for AGIs $25k-50k , 64.3% for AGIs $50k-75k , 62.4% for AGIs $75k-100k , 74.2% for AGIs over 100k )
Estimated median household income in 2022: This zip code:
$81,699Florida:
$69,303
Nearest zip codes: 34986 ,
34953 ,
34945 ,
34983 ,
34981 ,
34984 .
Port St. Lucie Zip Code Map
Percentage of family households: This zip code:
29.6%Florida:
41.2%
Percentage of households with unmarried partners: This zip code:
2.0%Florida:
46.7%
Likely homosexual households (counted as self-reported same-sex unmarried-partner households)
Lesbian couples: 0.0% of all households Gay men: 0.4% of all households
Household received Food Stamps/SNAP in the past 12 months: 205Household did not receive Food Stamps/SNAP in the past 12 months: 6,556
Women who had a birth in the past 12 months: 142 (150 now married , 0 unmarried) Women who did not have a birth in the past 12 months: 1,894 (688 now married , 1,206 unmarried)
Housing units in zip code 34987 with a mortgage: 2,729 (119
second mortgage , 121
both second mortgage and home equity loan )
Median monthly owner costs for units with a mortgage: $2,106
Median monthly owner costs for units without a mortgage: $777
Residents with income below the poverty level in 2022:
This zip code:
4.5%Whole state:
12.7%
Residents with income below 50% of the poverty level in 2022:
This zip code:
0.9%Whole state:
6.6%
Median number of rooms in houses and condos: Median number of rooms in apartments:
Year house built (houses)
1,227 2020 or later3,489 2010 to 20192,455 2000 to 2009215 1990 to 1999145 1980 to 1989133 1970 to 197916 1960 to 1969134 1950 to 1959122 1940 to 19490 1939 or earlier
Zip code 34987 household income distribution in 2022 390 Less than $10,00050 $10,000 to $14,99988 $15,000 to $19,999208 $20,000 to $24,999219 $25,000 to $29,999302 $30,000 to $34,99964 $35,000 to $39,999192 $40,000 to $44,99953 $45,000 to $49,999361 $50,000 to $59,9991,085 $60,000 to $74,9991,231 $75,000 to $99,999894 $100,000 to $124,999690 $125,000 to $149,999361 $150,000 to $199,999556 $200,000 or moreEstimate of home value of owner-occupied houses/condos in 2022 in zip code 34987 30 $25,000 to $29,99965 $35,000 to $39,99930 $80,000 to $89,99921 $125,000 to $149,99928 $150,000 to $174,999125 $175,000 to $199,999430 $200,000 to $249,999557 $250,000 to $299,9992,234 $300,000 to $399,9991,064 $400,000 to $499,9991,039 $500,000 to $749,999209 $750,000 to $999,99925 $1,000,000 to $1,499,999Rent paid by renters in 2022 in zip code 34987 179 $500 to $5497 $900 to $99935 $1,250 to $1,499967 $1,500 to $1,999253 $2,000 to $2,49912 No cash rent
Median gross rent in 2022: $1,988.
Median price asked for vacant for-sale houses and condos in 2022: $390,851.
Estimated median house (or condo) value in 2022 for: White Non-Hispanic householders: $439,159Black or African American householders: $364,346Hispanic or Latino householders: $242,897Estimated median house or condo value in 2022: $426,205
34987:
$426,205Florida:
$354,100
Lower value quartile - upper value quartile: $335,637 - $526,560
Mean price in 2022: Detached houses: $399,568Here:
$399,568State:
$500,941
Townhouses or other attached units: $300,546Here:
$300,546State:
$370,869
In 2-unit structures: $275,584Here:
$275,584State:
$423,188
In 3-to-4-unit structures: $266,681Here:
$266,681State:
$309,944
In 5-or-more-unit structures: $325,072Here:
$325,072State:
$447,145
Mobile homes: $73,689Here:
$73,689State:
$113,202
Housing units in structures:
One, detached: 5,197One, attached: 1,0413 or 4: 625 to 9: 14810 to 19: 24720 to 49: 26450 or more: 380Mobile homes: 40Unemployment : 2.9%
Means of transportation to work in zip code 34987 70.4% 3,764 Drove a car alone7.7% 411 Carpooled2.6% 138 Other means20.4% 1,092 Worked at homeTravel time to work (commute) in zip code 34987 23 Less than 5 minutes212 5 to 9 minutes551 10 to 14 minutes399 15 to 19 minutes1,071 20 to 24 minutes116 25 to 29 minutes903 30 to 34 minutes25 35 to 39 minutes68 40 to 44 minutes672 45 to 59 minutes204 60 to 89 minutes67 90 or more minutes
Percentage of zip code residents living and working in this county: 70.8%
Household type by relationship:
Households: 14,916
Male householders: 3,415 (593 living alone ), Female householders: 3,303 (874 living alone )4,419 spouses (4,111 opposite-sex spouses ), 252 unmarried partners , (132 opposite-sex unmarried partners ), 2,479 children (2,312 natural , 40 adopted , 125 stepchildren ), 121 grandchildren , 105 brothers or sisters , 568 parents , 0 foster children , 79 other relatives , 277 non-relatives In group quarters: 21 (-1 institutionalized population )
Size of family households: 3,425 2-persons , 934 3-persons , 182 4-persons , 186 5-persons , 152 6-persons
Size of nonfamily households: 1,467 1-person , 369 2-persons
1,447 married couples with children. single-parent households (95 men , 364 women ).
87.1% of residents of 34987 zip code speak English at home. of residents speak Spanish at home (71% very well, 6% well, 23% not well ).of residents speak other Indo-European language at home (58% very well, 42% well ).of residents speak Asian or Pacific Island language at home (80% very well, 20% not well ).of residents speak other language at home (100% very well ).
Foreign born population: 2,215 (14.9%)
(66.1%
of them are naturalized citizens )
This zip code:
14.9%Whole state:
21.7%
24% Haiti 11% Uruguay 9% Kuwait 7% Dominica 7% Barbados 5% Austria 4% Greece 16% American 15% Italian 7% English 6% Jamaican 5% Polish 5% Irish 4% European
Year of entry for the foreign-born population
929 2010 or later 99 2000 to 2009 287 1990 to 1999 1,310 Before 1990
Facilities with environmental interests located in this zip code:
ALLIED UNIVERSAL CORPORATION (9549 RANGELINE RD. in FORT PIERCE, FL)
AIR MINOR (AIRS/AFS) CRITERIA AND HAZARDOUS AIR POLLUTANT INVENTORY (Inventory of air pollution sources) National Pollutant Discharge Elimination System NON-MAJOR (Tracking pollutant discharge elimination systems) - permit (Resource Conservation and Recovery Act (tracking hazardous waste)) TRI REPORTER (Tracking of toxic chemicals releasing facilities) Business SIC classification: ALKALIES AND CHLORINE; INDUSTRIAL INORGANIC CHEMICALSBusiness NAICS classification: ALKALIES AND CHLORINE MANUFACTURING.; ALKALIES AND CHLORINE MANUFACTURING.Organizations: GREG FRANCIS (CONTACT/OWNER)
, PRAKASH LODHA (CONTACT/OWNER)
Alternative names: ALLIED UNIVERSAL CORP., JELD-WEN
GLADES WASTEWATER IN-LINE BOOS (10302 SW RANGE LINE RD in PORT SAINT LUCIE, FL)
National Pollutant Discharge Elimination System NON-MAJOR (Tracking pollutant discharge elimination systems) - permit Organizations: CASEY SULLIVAN (CONTACT/OWNER)
HENRY VACHON PROPERTY (7620 OKEECHOBEE ROAD in FORT PIERCE, FL)
(Resource Conservation and Recovery Act (tracking hazardous waste))
HERITAGE OAKS AT TRADITION - P ( in PORT ST LUCIE, FL)
National Pollutant Discharge Elimination System NON-MAJOR (Tracking pollutant discharge elimination systems) - permit Organizations: ROBERT TROUTMAN (CONTACT/OWNER)
LAKE AT TRADITION PHASE 3 (NW CORNER OF TRADIITION LAKES in PORT SAINT LUCIE, FL)
National Pollutant Discharge Elimination System NON-MAJOR (Tracking pollutant discharge elimination systems) - permit Organizations: RICHARD GREENE (CONTACT/OWNER)
RIVER PLACE AT ST LUCIE (641 NE HAMMOCK TRL in PORT ST LUCIE, FL)
National Pollutant Discharge Elimination System NON-MAJOR (Tracking pollutant discharge elimination systems) - permit Organizations: VICTOR DEBELLIS (CONTACT/OWNER)
ROLLING OAKS CEMETERY (DEL RIO BLVD. AND C-24 CANAL in PORT ST. LUCIE, FL)
National Pollutant Discharge Elimination System NON-MAJOR (Tracking pollutant discharge elimination systems) - permit Organizations: ROBERT ANTONUCCI (CONTACT/OWNER)
A DUDA & SONS INC (12535 GLADES CUTOFF ROAD in PORT SAINT LUCIE, FL)
Small Quantity Generators, between 100 kg and 1000 kg of hazardous waste/month (Resource Conservation and Recovery Act (tracking hazardous waste)) - notification Organizations: JIM MCVAY III (CONTACT/OWNER)
86.6% Electricity 12.7% Utility gas 0.8% No fuel used
Population in 1990: 67. Population change in the 1990s: +1,108 (+1653.7%).
Place of birth for U.S.-born residents:
This state: 2,547Northeast: 6,321Midwest: 1,877South: 1,306West: 267
69% of the 34987 zip code residents lived in the same house 5 years ago.
Out of people who lived in different houses, 43% lived in this county.
Out of people who lived in different counties, 50% lived in Florida.
79% of the 34987 zip code residents lived in the same house 1 year ago.
Out of people who lived in different houses, 13% moved from this county.
Out of people who lived in different houses, 64% moved from different county within same state.
Out of people who lived in different houses, 26% moved from different state.
Private vs. public school enrollment:
Students in private schools in grades 1 to 8 (elementary and middle school): 38
Students in private schools in grades 9 to 12 (high school):
Students in private undergraduate colleges: 78
Occupation by median earnings in the past 12 months ($)
114,405 Law enforcement workers including supervisors 112,242 Architecture and engineering occupations 87,992 Health diagnosing and treating practitioners and other technical occupations 83,560 Management occupations 48,792 Education, training, and library occupations 40,081 Business and financial operations occupations
Top industries in this zip code by the number of employees in 2005:
Construction: Water and Sewer Line and Related Structures Construction (20-49 employees: 1 establishment, 1-4 employees: 1 establishment)Construction: Land Subdivision (20-49: 1)Construction: Poured Concrete Foundation and Structure Contractors (20-49: 1)Other Services (except Public Administration): Religious Organizations (20-49: 1)Wholesale Trade: Other Chemical and Allied Products Merchant Wholesalers (20-49: 1)Professional, Scientific, and Technical Services: Engineering Services (10-19: 1, 5-9: 1, 1-4: 1)Finance and Insurance: Savings Institutions (10-19: 1)Construction: Site Preparation Contractors (10-19: 1)
Fatal accident statistics in 2014:
Fatal accident count: 3Vehicles involved in fatal accidents: 3Fatal accidents caused by drunken drivers: 2Fatalities: 3Persons involved in fatal accidents: 3Pedestrians involved in fatal accidents: 1
Fatal accident statistics in 2013:
Fatal accident count: 1Vehicles involved in fatal accidents: 1Fatal accidents caused by drunken drivers: 0Fatalities: 1Persons involved in fatal accidents: 1Pedestrians involved in fatal accidents: 0
Home Mortgage Disclosure Act Aggregated Statistics For Year 2009(Based on 4 partial tracts) A) FHA, FSA/RHS & VA B) Conventional C) Refinancings D) Home Improvement Loans F) Non-occupant Loans on G) Loans On Manufactured Number Average Value Number Average Value Number Average Value Number Average Value Number Average Value Number Average Value
LOANS ORIGINATED 564 $133,041 440 $121,158 434 $164,797 30 $60,952 258 $131,020 2 $20,460 APPLICATIONS APPROVED, NOT ACCEPTED 31 $134,712 32 $122,603 67 $169,152 2 $15,335 27 $142,909 0 $0 APPLICATIONS DENIED 127 $144,479 105 $119,793 378 $186,078 31 $38,387 95 $128,693 3 $88,983 APPLICATIONS WITHDRAWN 65 $132,550 64 $133,006 164 $187,557 6 $107,863 57 $145,243 1 $162,560 FILES CLOSED FOR INCOMPLETENESS 30 $122,006 12 $100,920 68 $178,898 5 $23,808 15 $145,458 0 $0
Aggregated Statistics For Year 2008(Based on 4 partial tracts) A) FHA, FSA/RHS & VA B) Conventional C) Refinancings D) Home Improvement Loans F) Non-occupant Loans on G) Loans On Manufactured Number Average Value Number Average Value Number Average Value Number Average Value Number Average Value Number Average Value
LOANS ORIGINATED 437 $169,445 662 $167,181 367 $174,181 45 $45,385 314 $158,341 3 $62,583 APPLICATIONS APPROVED, NOT ACCEPTED 27 $175,209 94 $203,395 128 $186,192 9 $64,524 59 $179,626 2 $41,925 APPLICATIONS DENIED 101 $175,664 183 $183,184 587 $206,623 86 $55,626 156 $172,372 7 $50,636 APPLICATIONS WITHDRAWN 50 $193,931 99 $197,094 182 $199,610 9 $79,520 61 $184,451 0 $0 FILES CLOSED FOR INCOMPLETENESS 19 $168,158 41 $226,025 53 $218,371 7 $175,999 16 $198,473 0 $0
Aggregated Statistics For Year 2007(Based on 4 partial tracts) A) FHA, FSA/RHS & VA B) Conventional C) Refinancings D) Home Improvement Loans E) Loans on Dwellings For 5+ Families F) Non-occupant Loans on G) Loans On Manufactured Number Average Value Number Average Value Number Average Value Number Average Value Number Average Value Number Average Value Number Average Value
LOANS ORIGINATED 68 $226,615 1,719 $210,596 1,246 $199,989 144 $88,635 2 $4,089,600 704 $209,358 9 $68,274 APPLICATIONS APPROVED, NOT ACCEPTED 3 $238,560 272 $214,564 353 $206,081 49 $69,639 0 $0 156 $212,404 3 $48,867 APPLICATIONS DENIED 9 $220,498 533 $235,948 1,444 $229,180 184 $98,410 0 $0 346 $225,401 6 $45,673 APPLICATIONS WITHDRAWN 5 $216,544 209 $226,737 560 $225,652 41 $155,353 1 $183,010 126 $243,029 0 $0 FILES CLOSED FOR INCOMPLETENESS 0 $0 80 $256,652 187 $232,621 6 $106,160 0 $0 37 $239,951 0 $0
Aggregated Statistics For Year 2006(Based on 4 partial tracts) A) FHA, FSA/RHS & VA B) Conventional C) Refinancings D) Home Improvement Loans F) Non-occupant Loans on G) Loans On Manufactured Number Average Value Number Average Value Number Average Value Number Average Value Number Average Value Number Average Value
LOANS ORIGINATED 36 $239,923 3,697 $200,483 1,821 $198,156 233 $95,806 1,469 $210,729 10 $39,109 APPLICATIONS APPROVED, NOT ACCEPTED 1 $257,640 477 $206,318 365 $197,764 48 $77,197 211 $212,615 4 $54,495 APPLICATIONS DENIED 12 $222,123 967 $207,123 1,076 $216,033 174 $99,768 344 $213,842 12 $67,764 APPLICATIONS WITHDRAWN 3 $213,000 527 $220,312 762 $201,356 77 $120,417 253 $215,132 0 $0 FILES CLOSED FOR INCOMPLETENESS 0 $0 105 $219,088 229 $205,321 7 $108,374 57 $236,763 0 $0
Aggregated Statistics For Year 2005(Based on 4 partial tracts) A) FHA, FSA/RHS & VA B) Conventional C) Refinancings D) Home Improvement Loans F) Non-occupant Loans on G) Loans On Manufactured Number Average Value Number Average Value Number Average Value Number Average Value Number Average Value Number Average Value
LOANS ORIGINATED 26 $185,422 5,085 $193,091 1,775 $180,953 210 $112,758 2,129 $194,662 15 $109,854 APPLICATIONS APPROVED, NOT ACCEPTED 6 $156,258 501 $195,339 264 $175,461 41 $70,319 229 $192,558 9 $72,178 APPLICATIONS DENIED 5 $209,592 971 $191,547 782 $186,925 167 $87,704 358 $188,690 17 $119,600 APPLICATIONS WITHDRAWN 0 $0 643 $198,732 593 $175,406 85 $125,703 259 $194,090 3 $106,437 FILES CLOSED FOR INCOMPLETENESS 2 $199,370 169 $184,955 345 $176,980 15 $105,512 58 $176,313 1 $75,430
Aggregated Statistics For Year 2004(Based on 4 partial tracts) A) FHA, FSA/RHS & VA B) Conventional C) Refinancings D) Home Improvement Loans E) Loans on Dwellings For 5+ Families F) Non-occupant Loans on G) Loans On Manufactured Number Average Value Number Average Value Number Average Value Number Average Value Number Average Value Number Average Value Number Average Value
LOANS ORIGINATED 104 $146,793 3,470 $163,251 1,210 $143,357 284 $127,918 1 $191,190 1,319 $164,248 13 $51,122 APPLICATIONS APPROVED, NOT ACCEPTED 1 $248,850 364 $157,841 192 $137,295 36 $55,682 0 $0 112 $161,370 8 $70,910 APPLICATIONS DENIED 10 $151,112 602 $157,049 587 $144,891 187 $62,954 0 $0 170 $162,543 12 $82,122 APPLICATIONS WITHDRAWN 8 $171,124 405 $170,476 331 $144,299 45 $112,760 0 $0 131 $162,425 3 $72,600 FILES CLOSED FOR INCOMPLETENESS 3 $129,843 137 $170,604 230 $147,337 14 $89,095 0 $0 45 $160,742 0 $0
Aggregated Statistics For Year 2003(Based on 4 partial tracts) A) FHA, FSA/RHS & VA B) Conventional C) Refinancings D) Home Improvement Loans F) Non-occupant Loans on Number Average Value Number Average Value Number Average Value Number Average Value Number Average Value
LOANS ORIGINATED 115 $127,035 2,121 $136,165 1,788 $118,937 118 $87,790 701 $133,762 APPLICATIONS APPROVED, NOT ACCEPTED 9 $138,479 193 $134,320 248 $119,028 25 $33,580 49 $116,232 APPLICATIONS DENIED 25 $128,700 283 $137,813 722 $115,757 108 $27,550 95 $127,023 APPLICATIONS WITHDRAWN 12 $129,962 219 $139,121 329 $120,228 24 $49,171 72 $128,724 FILES CLOSED FOR INCOMPLETENESS 10 $104,718 55 $155,214 70 $124,441 9 $26,557 14 $155,350
Aggregated Statistics For Year 2002(Based on 2 partial tracts) A) FHA, FSA/RHS & VA B) Conventional C) Refinancings D) Home Improvement Loans E) Loans on Dwellings For 5+ Families F) Non-occupant Loans on Number Average Value Number Average Value Number Average Value Number Average Value Number Average Value Number Average Value
LOANS ORIGINATED 188 $106,824 1,370 $118,589 933 $102,441 79 $20,979 2 $11,238,730 356 $114,583 APPLICATIONS APPROVED, NOT ACCEPTED 6 $81,110 110 $115,847 150 $97,142 21 $65,336 0 $0 30 $111,135 APPLICATIONS DENIED 30 $109,124 109 $108,337 449 $118,528 97 $24,706 0 $0 27 $97,393 APPLICATIONS WITHDRAWN 6 $104,625 95 $114,810 217 $93,891 24 $27,179 1 $40,900 29 $110,983 FILES CLOSED FOR INCOMPLETENESS 6 $107,182 20 $129,742 146 $107,275 1 $10,220 0 $0 8 $84,859
Aggregated Statistics For Year 2001(Based on 2 partial tracts) A) FHA, FSA/RHS & VA B) Conventional C) Refinancings D) Home Improvement Loans E) Loans on Dwellings For 5+ Families F) Non-occupant Loans on Number Average Value Number Average Value Number Average Value Number Average Value Number Average Value Number Average Value
LOANS ORIGINATED 170 $92,996 919 $111,155 604 $93,306 65 $30,530 1 $3,157,170 231 $115,066 APPLICATIONS APPROVED, NOT ACCEPTED 7 $111,296 61 $95,033 74 $73,088 14 $43,014 0 $0 16 $100,898 APPLICATIONS DENIED 11 $103,635 84 $93,586 380 $76,675 85 $17,513 0 $0 21 $82,669 APPLICATIONS WITHDRAWN 7 $89,241 61 $108,810 197 $88,186 21 $19,571 0 $0 22 $88,763 FILES CLOSED FOR INCOMPLETENESS 2 $74,125 10 $125,142 66 $93,705 1 $15,340 0 $0 1 $57,250
Aggregated Statistics For Year 2000(Based on 2 partial tracts) A) FHA, FSA/RHS & VA B) Conventional C) Refinancings D) Home Improvement Loans F) Non-occupant Loans on Number Average Value Number Average Value Number Average Value Number Average Value Number Average Value
LOANS ORIGINATED 111 $87,337 573 $103,915 185 $69,435 70 $18,812 137 $112,412 APPLICATIONS APPROVED, NOT ACCEPTED 7 $78,433 39 $74,819 42 $69,499 33 $23,391 9 $76,793 APPLICATIONS DENIED 14 $86,101 70 $88,832 192 $53,357 111 $17,860 17 $62,908 APPLICATIONS WITHDRAWN 6 $102,580 46 $95,394 137 $54,747 11 $30,300 6 $74,635 FILES CLOSED FOR INCOMPLETENESS 3 $81,110 7 $90,701 58 $70,845 1 $105,310 1 $109,400
Aggregated Statistics For Year 1999(Based on 2 partial tracts) A) FHA, FSA/RHS & VA B) Conventional C) Refinancings D) Home Improvement Loans F) Non-occupant Loans on Number Average Value Number Average Value Number Average Value Number Average Value Number Average Value
LOANS ORIGINATED 100 $81,485 211 $76,522 198 $61,779 68 $19,288 38 $57,656 APPLICATIONS APPROVED, NOT ACCEPTED 4 $82,780 18 $66,101 45 $56,228 19 $24,153 7 $54,097 APPLICATIONS DENIED 15 $86,150 45 $64,414 151 $51,960 67 $18,529 10 $66,449 APPLICATIONS WITHDRAWN 12 $76,117 27 $76,814 111 $61,109 28 $44,140 3 $57,283 FILES CLOSED FOR INCOMPLETENESS 2 $72,705 4 $72,865 66 $68,205 3 $15,317 0 $0
Detailed HMDA statistics for the following Tracts:
0021.02
,
0022.00
Private Mortgage Insurance Companies Aggregated Statistics For Year 2009(Based on 4 partial tracts) A) Conventional B) Refinancings C) Non-occupant Loans on Number Average Value Number Average Value Number Average Value
LOANS ORIGINATED 18 $162,789 2 $194,765 2 $135,980 APPLICATIONS APPROVED, NOT ACCEPTED 38 $264,968 11 $219,841 18 $286,386 APPLICATIONS DENIED 6 $187,440 2 $190,735 0 $0 APPLICATIONS WITHDRAWN 1 $125,760 0 $0 0 $0 FILES CLOSED FOR INCOMPLETENESS 1 $147,230 1 $128,820 1 $147,230
Aggregated Statistics For Year 2008(Based on 4 partial tracts) A) Conventional B) Refinancings C) Non-occupant Loans on Number Average Value Number Average Value Number Average Value
LOANS ORIGINATED 230 $210,359 31 $238,610 64 $216,069 APPLICATIONS APPROVED, NOT ACCEPTED 149 $245,271 63 $241,896 46 $227,277 APPLICATIONS DENIED 36 $196,054 14 $214,120 22 $203,907 APPLICATIONS WITHDRAWN 26 $244,872 1 $180,960 6 $236,718 FILES CLOSED FOR INCOMPLETENESS 9 $233,561 0 $0 4 $218,282
Aggregated Statistics For Year 2007(Based on 4 partial tracts) A) Conventional B) Refinancings C) Non-occupant Loans on Number Average Value Number Average Value Number Average Value
LOANS ORIGINATED 554 $252,778 161 $268,851 176 $249,635 APPLICATIONS APPROVED, NOT ACCEPTED 174 $277,570 76 $285,926 69 $275,814 APPLICATIONS DENIED 8 $318,529 6 $329,042 7 $288,221 APPLICATIONS WITHDRAWN 38 $286,792 24 $296,710 20 $261,223 FILES CLOSED FOR INCOMPLETENESS 4 $335,180 0 $0 1 $435,890
Aggregated Statistics For Year 2006(Based on 4 partial tracts) A) Conventional B) Refinancings C) Non-occupant Loans on Number Average Value Number Average Value Number Average Value
LOANS ORIGINATED 723 $260,638 94 $275,876 301 $257,436 APPLICATIONS APPROVED, NOT ACCEPTED 213 $272,170 34 $264,378 85 $263,033 APPLICATIONS DENIED 18 $311,885 4 $246,142 12 $261,138 APPLICATIONS WITHDRAWN 84 $262,401 22 $278,488 38 $289,070 FILES CLOSED FOR INCOMPLETENESS 5 $257,440 1 $230,040 3 $284,567
Aggregated Statistics For Year 2005(Based on 4 partial tracts) A) Conventional B) Refinancings C) Non-occupant Loans on Number Average Value Number Average Value Number Average Value
LOANS ORIGINATED 885 $217,413 64 $225,394 406 $209,325 APPLICATIONS APPROVED, NOT ACCEPTED 274 $217,459 43 $210,496 104 $210,994 APPLICATIONS DENIED 21 $234,276 4 $240,008 8 $208,952 APPLICATIONS WITHDRAWN 99 $221,628 13 $201,492 30 $215,317 FILES CLOSED FOR INCOMPLETENESS 10 $231,778 3 $164,607 2 $227,485
Aggregated Statistics For Year 2004(Based on 4 partial tracts) A) Conventional B) Refinancings C) Non-occupant Loans on D) Loans On Manufactured Number Average Value Number Average Value Number Average Value Number Average Value
LOANS ORIGINATED 863 $173,332 58 $169,929 292 $162,628 1 $253,690 APPLICATIONS APPROVED, NOT ACCEPTED 221 $170,116 34 $174,621 70 $155,265 0 $0 APPLICATIONS DENIED 27 $204,581 3 $205,160 13 $195,772 0 $0 APPLICATIONS WITHDRAWN 85 $168,758 9 $169,037 30 $165,703 0 $0 FILES CLOSED FOR INCOMPLETENESS 15 $190,303 5 $156,222 3 $218,453 0 $0
Aggregated Statistics For Year 2003(Based on 4 partial tracts) A) Conventional B) Refinancings C) Non-occupant Loans on Number Average Value Number Average Value Number Average Value
LOANS ORIGINATED 540 $149,056 120 $143,197 139 $148,588 APPLICATIONS APPROVED, NOT ACCEPTED 99 $148,373 47 $136,639 29 $152,690 APPLICATIONS DENIED 17 $155,376 3 $178,240 10 $153,108 APPLICATIONS WITHDRAWN 54 $159,797 13 $116,632 19 $165,360 FILES CLOSED FOR INCOMPLETENESS 0 $0 0 $0 0 $0
Aggregated Statistics For Year 2002(Based on 2 partial tracts) A) Conventional B) Refinancings C) Non-occupant Loans on Number Average Value Number Average Value Number Average Value
LOANS ORIGINATED 317 $126,784 100 $119,028 56 $120,570 APPLICATIONS APPROVED, NOT ACCEPTED 63 $127,378 32 $121,857 13 $152,888 APPLICATIONS DENIED 22 $143,415 4 $100,195 9 $102,013 APPLICATIONS WITHDRAWN 29 $126,143 6 $113,145 4 $114,510 FILES CLOSED FOR INCOMPLETENESS 2 $152,850 0 $0 1 $90,990
Aggregated Statistics For Year 2001(Based on 2 partial tracts) A) Conventional B) Refinancings C) Non-occupant Loans on Number Average Value Number Average Value Number Average Value
LOANS ORIGINATED 293 $104,417 86 $105,593 39 $97,757 APPLICATIONS APPROVED, NOT ACCEPTED 61 $114,526 17 $96,045 10 $132,299 APPLICATIONS DENIED 15 $175,171 6 $112,635 7 $143,574 APPLICATIONS WITHDRAWN 14 $139,776 2 $85,370 0 $0 FILES CLOSED FOR INCOMPLETENESS 3 $97,810 1 $110,420 0 $0
Aggregated Statistics For Year 2000(Based on 2 partial tracts) A) Conventional B) Refinancings C) Non-occupant Loans on Number Average Value Number Average Value Number Average Value
LOANS ORIGINATED 149 $104,594 13 $94,218 9 $112,919 APPLICATIONS APPROVED, NOT ACCEPTED 32 $129,781 6 $97,468 14 $134,591 APPLICATIONS DENIED 14 $154,017 2 $97,130 3 $62,707 APPLICATIONS WITHDRAWN 7 $113,340 2 $59,300 1 $123,710 FILES CLOSED FOR INCOMPLETENESS 1 $57,250 0 $0 0 $0
Aggregated Statistics For Year 1999(Based on 2 partial tracts) A) Conventional B) Refinancings C) Non-occupant Loans on Number Average Value Number Average Value Number Average Value
LOANS ORIGINATED 77 $86,021 28 $77,351 10 $64,335 APPLICATIONS APPROVED, NOT ACCEPTED 8 $95,925 3 $101,423 1 $142,940 APPLICATIONS DENIED 9 $94,774 4 $85,692 1 $96,940 APPLICATIONS WITHDRAWN 8 $69,245 1 $121,530 0 $0 FILES CLOSED FOR INCOMPLETENESS 1 $44,070 0 $0 0 $0
Detailed PMIC statistics for the following Tracts:
0021.02
,
0022.00
2002 - 2018 National Fire Incident Reporting System (NFIRS) incidents See full 2006 National Fire Incident Reporting System statistics for zip code 34987, Florida
Most common first names in zip code 34987 among deceased individuals Name Count Lived (average)
James 4 80.0 years Elizabeth 4 81.3 years Mary 3 82.7 years Richard 3 76.7 years Claude 2 71.5 years Bonita 2 79.0 years Henry 2 58.5 years Joseph 2 74.5 years Robert 2 59.0 years Sarah 2 89.0 years
Most common last names in zip code 34987 among deceased individuals Last name Count Lived (average)
Loose 3 85.0 years Wilson 3 77.0 years Hall 2 79.0 years Miller 2 61.5 years
Businesses in zip code 34987
Name Count Name Count
AT&T 1 Nike 2 Bed Bath & Beyond 1 OfficeMax 1 Catherines 1 Olive Garden 1 DressBarn 1 Payless 1 Dressbarn 1 Pier 1 Imports 1 Famous Footwear 1 Publix Super Markets 1 FedEx 3 Starbucks 1 GNC 1 T.J.Maxx 1 GameStop 1 Target 1 Jones New York 1 Toys"R"Us 1 LA Fitness 1 U-Haul 1 Lane Bryant 1 UPS 1 McDonald's 1

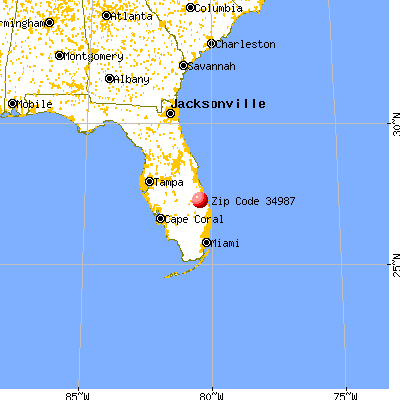


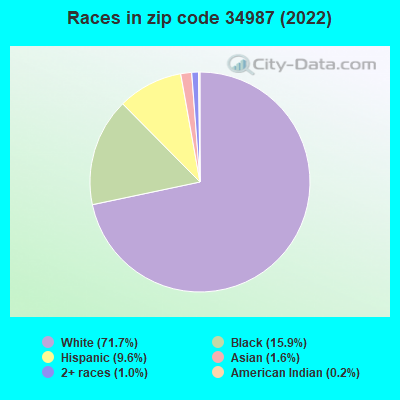


 Nearest zip codes: 34986, 34953, 34945, 34983, 34981, 34984.
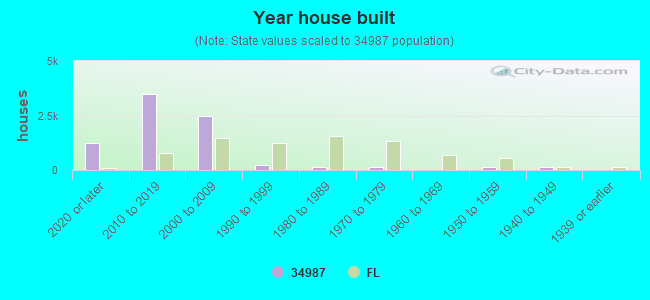

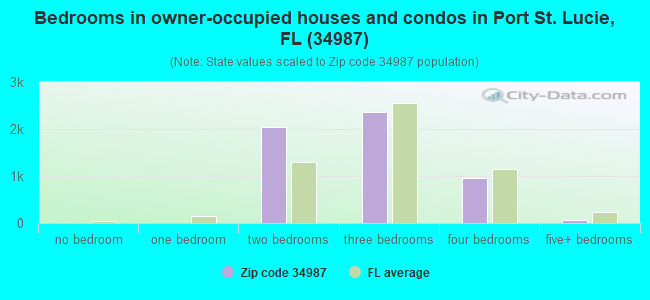
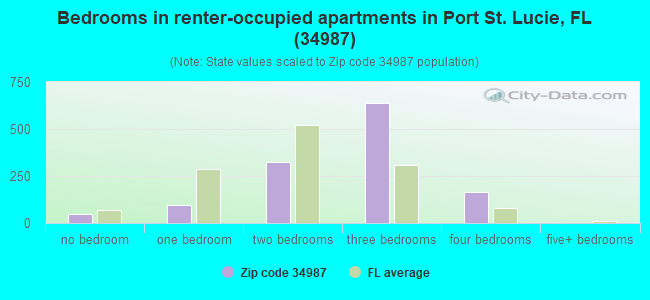
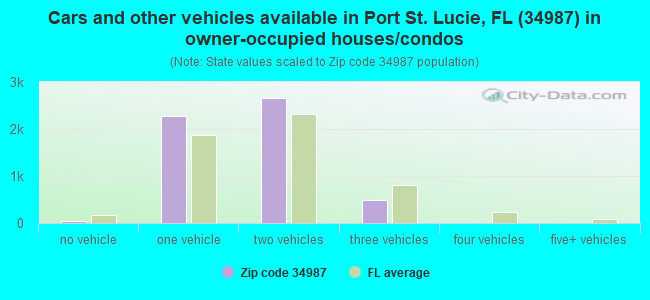
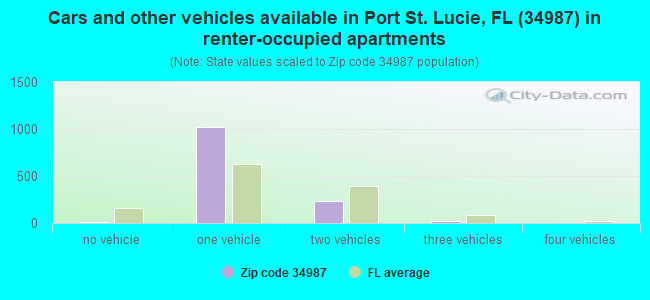


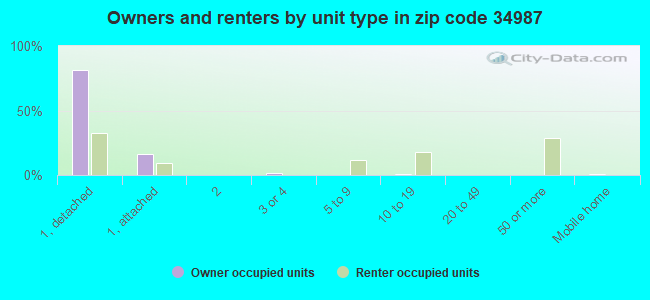
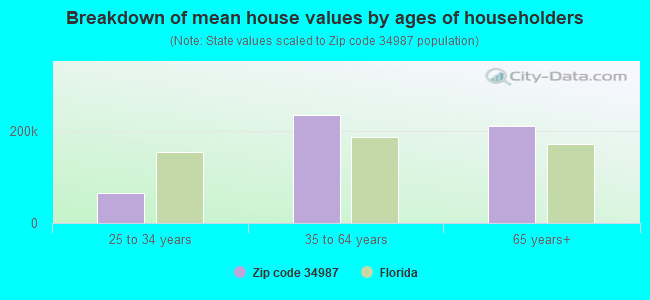


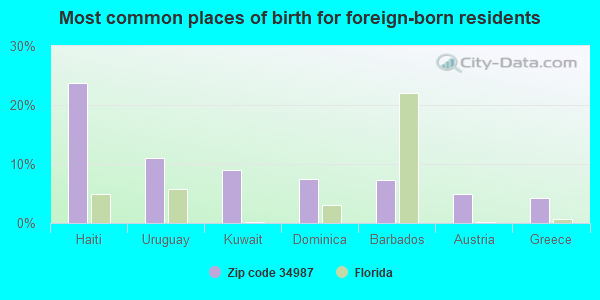
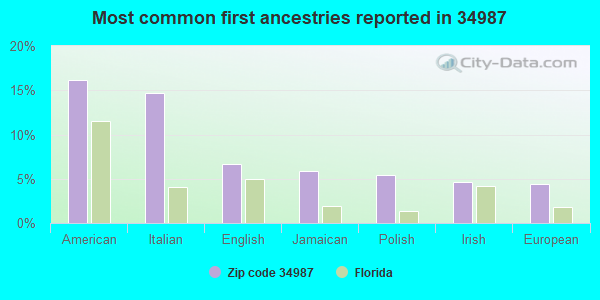
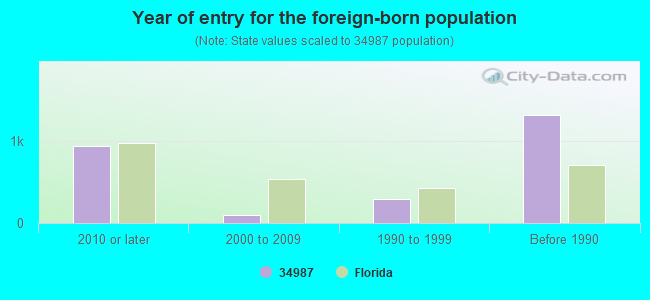


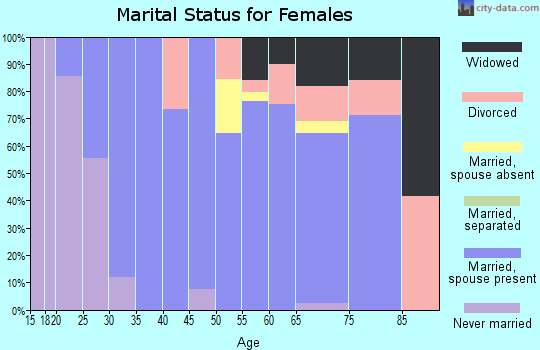
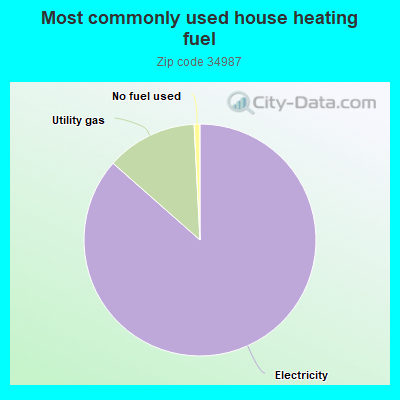
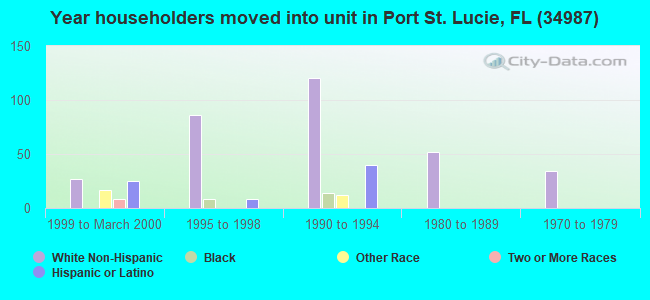
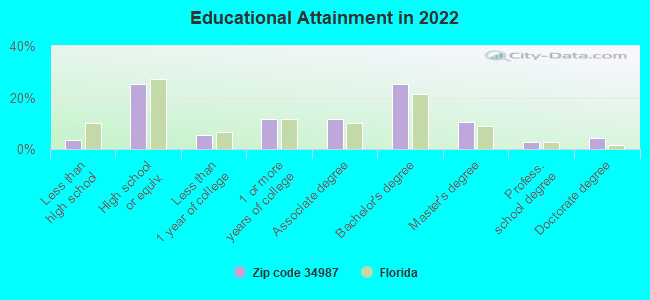
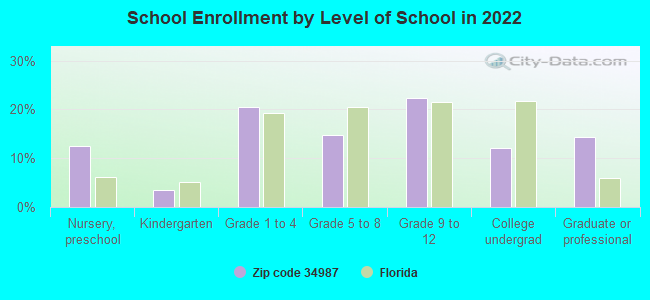
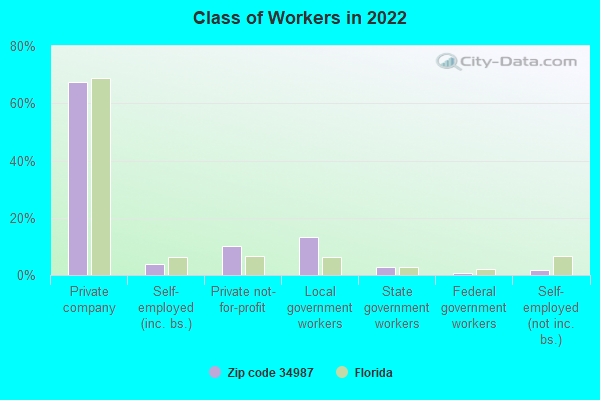
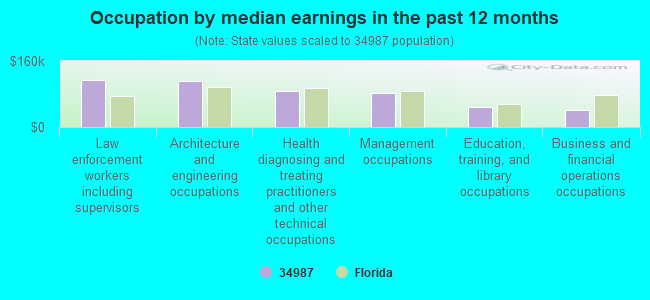
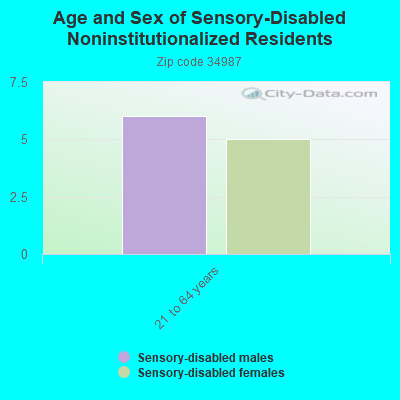
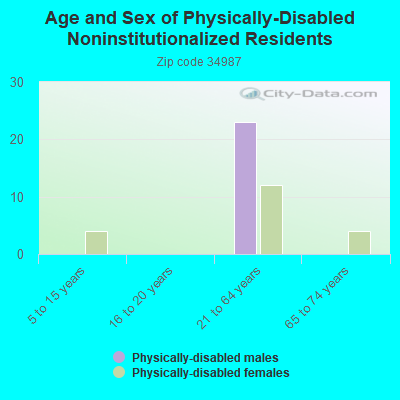
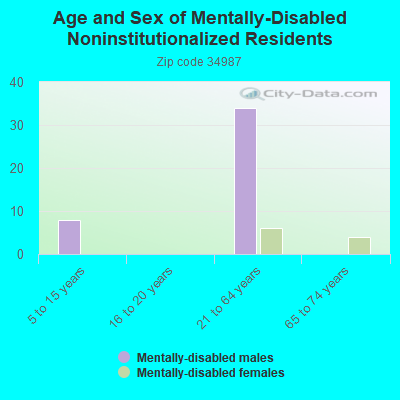
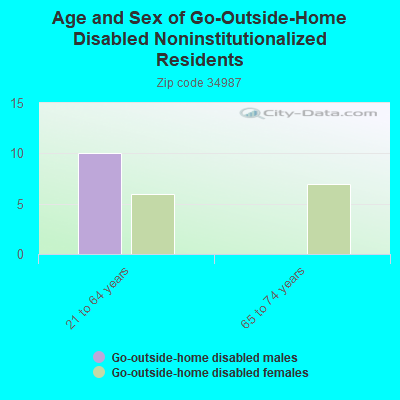
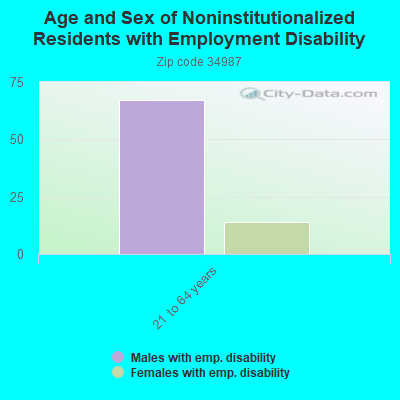
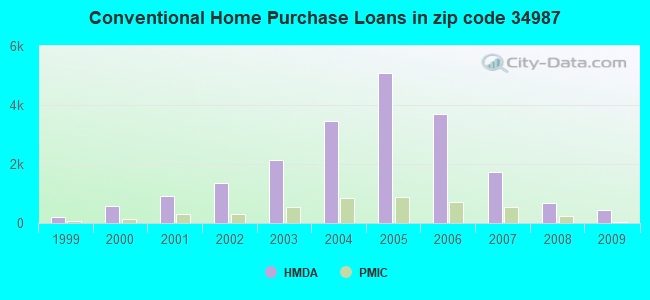
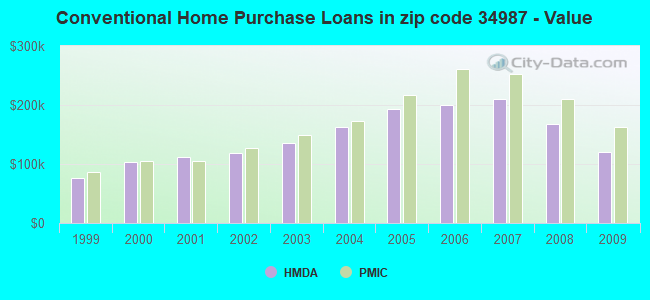
 Based on the data from the years 2002 - 2018 the average number of fire incidents per year is 10. The highest number of reported fires - 51 took place in 2018, and the least - 0 in 2004. The data has an increasing trend.
 When looking into fire subcategories, the most reports belonged to: Outside Fires (64.7%), and Mobile Property/Vehicle Fires (26.6%).