Estimated zip code population in 2022: 13,351 Zip code population in 2010: 13,952 Zip code population in 2000: 13,724
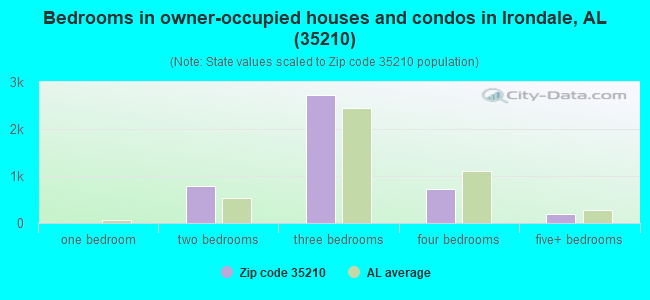
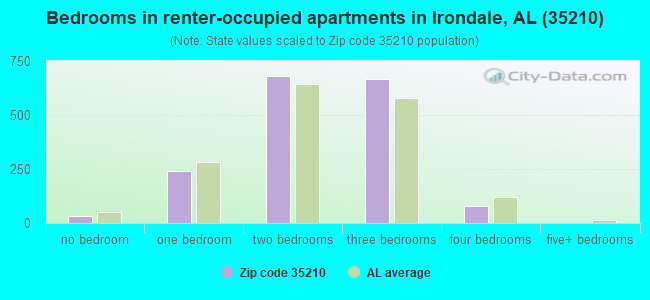
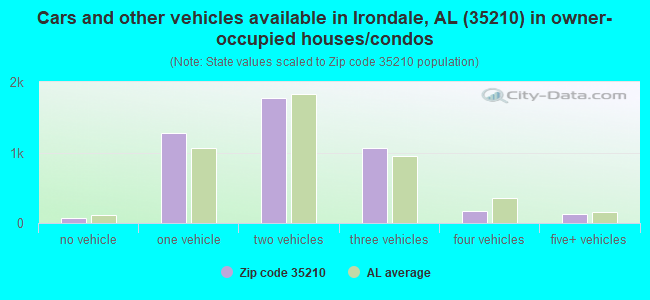
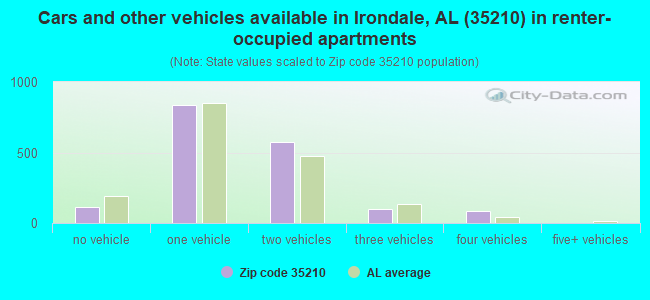
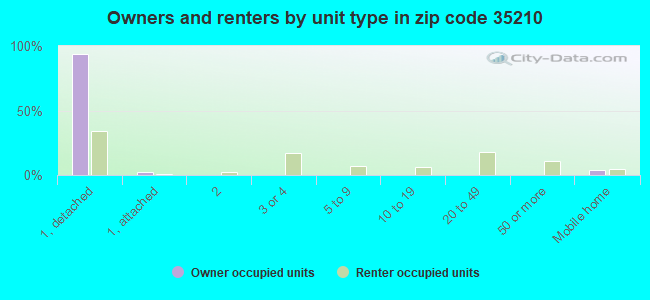
Houses and condos: 6,986 Renter-occupied apartments: 1,698
% of renters here:
27%
State:
30%
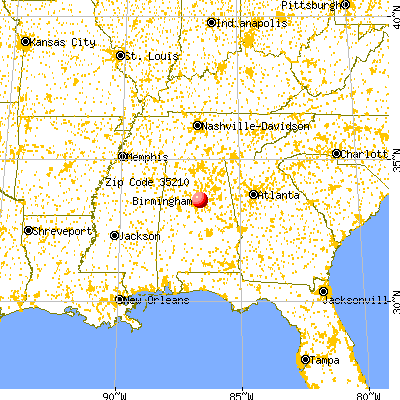
March 2022 cost of living index in zip code 35210: 87.6 (less than average, U.S. average is 100)
Land area: 25.3 sq. mi. Water area: 0.4 sq. mi.
Population density: 528 people per square mile
(low).
OSM Map
General Map
Google Map
MSN Map
OSM Map
General Map
Google Map
MSN Map
OSM Map
General Map
Google Map
MSN Map
OSM Map
General Map
Google Map
MSN Map
Please wait while loading the map...
Real estate property taxes paid for housing units in 2022:
This zip code:
0.5% ($1,050)
Alabama:
0.4% ($718)
Median real estate property taxes paid for housing units with mortgages in 2022: $1,117 (0.5%) Median real estate property taxes paid for housing units with no mortgage in 2022: $974 (0.5%)
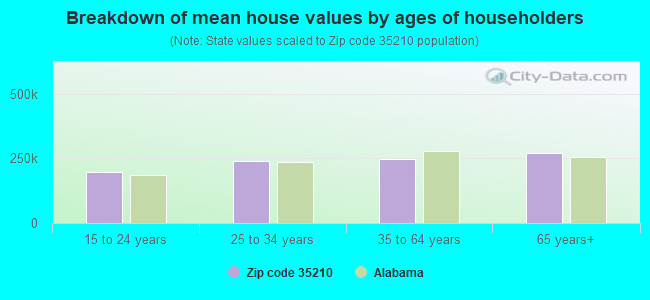
Estimated median house/condo value in 2022: $230,016
35210:
$230,016
Alabama:
$200,900
According to our research of Alabama and other state lists, there were 22 registered sex offenders living in 35210 zip code as of April 27, 2024. The ratio of all residents to sex offenders in zip code 35210 is 652 to 1. The ratio of registered sex offenders to all residents in this zip code is lower than the state average.
Median resident age:
This zip code:
45.8 years
Alabama median age:
39.6 years
Average household size:
This zip code:
2.1 people
Alabama:
2.5 people
Averages for the 2020 tax year for zip code 35210, filed in 2021:
Average Adjusted Gross Income (AGI) in 2020: $66,367 (Individual Income Tax Returns)
Here:
$66,367
State:
$63,984
Salary/wage: $55,442 (reported on 80.4% of returns)
Here:
$55,442
State:
$52,834
(% of AGI for various income ranges: 1250.7% for AGIs below $25k, 3847.9% for AGIs $25k-50k, 6884.2% for AGIs $50k-75k, 10471.3% for AGIs $75k-100k, 18261.5% for AGIs $100k-200k, 76051.4% for AGIs over 200k)
Taxable interest for individuals: $1,610 (reported on 29.2% of returns)
This zip code:
$1,610
Alabama:
$1,615
(% of AGI for various income ranges: 15.4% for AGIs below $25k, 21.6% for AGIs $25k-50k, 40.8% for AGIs $50k-75k, 70.8% for AGIs $75k-100k, 138.3% for AGIs $100k-200k, 2087.1% for AGIs over 200k)
Ordinary dividends: $7,091 (reported on 20.2% of returns)
Here:
$7,091
State:
$7,660
(% of AGI for various income ranges: 31.3% for AGIs below $25k, 61.9% for AGIs $25k-50k, 129.0% for AGIs $50k-75k, 289.7% for AGIs $75k-100k, 527.4% for AGIs $100k-200k, 5607.1% for AGIs over 200k)
Net capital gain/loss in AGI: +$13,430 (reported on 17.4% of returns)
Here:
+$13,430
State:
+$23,528
(% of AGI for various income ranges: 11.0% for AGIs below $25k, 36.4% for AGIs $25k-50k, 75.8% for AGIs $50k-75k, 176.3% for AGIs $75k-100k, 715.7% for AGIs $100k-200k, 15500.0% for AGIs over 200k)
Profit/loss from business: +$10,282 (reported on 19.0% of returns)
Here:
+$10,282
State:
+$9,534
(% of AGI for various income ranges: 148.9% for AGIs below $25k, 115.7% for AGIs $25k-50k, 146.1% for AGIs $50k-75k, 339.5% for AGIs $75k-100k, 672.0% for AGIs $100k-200k, 5781.4% for AGIs over 200k)
Taxable individual retirement arrangement distribution: $21,223 (reported on 9.4% of returns)
35210:
$21,223
Alabama:
$19,004
(% of AGI for various income ranges: 65.4% for AGIs below $25k, 79.4% for AGIs $25k-50k, 213.3% for AGIs $50k-75k, 506.8% for AGIs $75k-100k, 855.9% for AGIs $100k-200k, 5814.3% for AGIs over 200k)
Self-employed (Keogh) retirement plans: $28,050 (reported on 0.3% of returns)
35210:
$28,050
Alabama:
$26,467
(% of AGI for various income ranges: 122.0% for AGIs $100k-200k)
Total itemized deductions: $33,493 (reported on 10.5% of returns)
Here:
$33,493
State:
$37,338
(% of AGI for various income ranges: 79.7% for AGIs below $25k, 169.0% for AGIs $25k-50k, 364.2% for AGIs $50k-75k, 729.2% for AGIs $75k-100k, 1471.7% for AGIs $100k-200k, 11421.4% for AGIs over 200k)
Charity contributions: $13,575 (reported on 9.3% of returns)
Here:
$13,575
State:
$18,005
(% of AGI for various income ranges: 10.9% for AGIs below $25k, 29.4% for AGIs $25k-50k, 79.0% for AGIs $50k-75k, 207.6% for AGIs $75k-100k, 491.5% for AGIs $100k-200k, 6292.9% for AGIs over 200k)
Taxes paid: $5,792 (reported on 10.5% of returns)
35210:
$5,792
State:
$6,484
(% of AGI for various income ranges: 5.8% for AGIs below $25k, 19.9% for AGIs $25k-50k, 68.6% for AGIs $50k-75k, 147.6% for AGIs $75k-100k, 323.7% for AGIs $100k-200k, 1690.0% for AGIs over 200k)
Earned income credit: $2,371 (reported on 15.1% of returns)
Here:
$2,371
State:
$2,628
(% of AGI for various income ranges: 110.9% for AGIs below $25k, 59.0% for AGIs $25k-50k)
Percentage of individuals using paid preparers for their 2020 taxes: 90.7%
Here:
91%
State:
93%
(% for various income ranges: 89.0% for AGIs below $25k, 91.8% for AGIs $25k-50k, 90.9% for AGIs $50k-75k, 92.1% for AGIs $75k-100k, 90.8% for AGIs $100k-200k, 92.0% for AGIs over 200k)
Averages for the 2012 tax year for zip code 35210, filed in 2013:
Average Adjusted Gross Income (AGI) in 2012: $51,805 (Individual Income Tax Returns)
Here:
$51,805
State:
$52,001
Salary/wage: $44,681 (reported on 84.7% of returns)
Here:
$44,681
State:
$43,822
(% of AGI for various income ranges: 79.1% for AGIs below $25k, 82.5% for AGIs $25k-50k, 77.2% for AGIs $50k-75k, 74.8% for AGIs $75k-100k, 73.5% for AGIs $100k-200k, 52.4% for AGIs over 200k)
Taxable interest for individuals: $1,457 (reported on 28.6% of returns)
This zip code:
$1,457
Alabama:
$1,592
(% of AGI for various income ranges: 1.0% for AGIs below $25k, 0.7% for AGIs $25k-50k, 0.7% for AGIs $50k-75k, 0.6% for AGIs $75k-100k, 0.7% for AGIs $100k-200k, 1.1% for AGIs over 200k)
Ordinary dividends: $7,573 (reported on 17.6% of returns)
Here:
$7,573
State:
$5,697
(% of AGI for various income ranges: 1.6% for AGIs below $25k, 1.0% for AGIs $25k-50k, 1.8% for AGIs $50k-75k, 1.5% for AGIs $75k-100k, 3.6% for AGIs $100k-200k, 5.1% for AGIs over 200k)
Net capital gain/loss in AGI: +$5,502 (reported on 12.7% of returns)
Here:
+$5,502
State:
+$13,286
(% of AGI for various income ranges: 0.6% for AGIs $50k-75k, 0.2% for AGIs $75k-100k, 1.1% for AGIs $100k-200k, 5.9% for AGIs over 200k)
Profit/loss from business: +$10,190 (reported on 16.1% of returns)
Here:
+$10,190
State:
+$9,151
(% of AGI for various income ranges: 5.5% for AGIs below $25k, 2.1% for AGIs $25k-50k, 1.4% for AGIs $50k-75k, 3.2% for AGIs $75k-100k, 3.5% for AGIs $100k-200k, 4.3% for AGIs over 200k)
Taxable individual retirement arrangement distribution: $15,705 (reported on 9.8% of returns)
35210:
$15,705
Alabama:
$14,992
(% of AGI for various income ranges: 3.0% for AGIs below $25k, 2.3% for AGIs $25k-50k, 3.1% for AGIs $50k-75k, 3.3% for AGIs $75k-100k, 3.7% for AGIs $100k-200k, 2.4% for AGIs over 200k)
Self-employment retirement plans: $17,167 (reported on 0.5% of returns)
35210:
$17,167
Alabama:
$20,904
Total itemized deductions: $19,883 (23% of AGI, reported on 37.1% of returns)
Here:
$19,883
State:
$21,388
Here:
22.6% of AGI
State:
20.1% of AGI
(% of AGI for various income ranges: 11.1% for AGIs below $25k, 13.1% for AGIs $25k-50k, 15.7% for AGIs $50k-75k, 14.9% for AGIs $75k-100k, 15.2% for AGIs $100k-200k, 14.0% for AGIs over 200k)
Charity contributions: $5,374 (reported on 32.4% of returns)
Here:
$5,374
State:
$5,925
(% of AGI for various income ranges: 1.3% for AGIs below $25k, 2.3% for AGIs $25k-50k, 3.4% for AGIs $50k-75k, 3.4% for AGIs $75k-100k, 4.1% for AGIs $100k-200k, 4.7% for AGIs over 200k)
Taxes paid: $4,910 (reported on 36.5% of returns)
35210:
$4,910
State:
$5,272
(% of AGI for various income ranges: 1.3% for AGIs below $25k, 2.3% for AGIs $25k-50k, 3.5% for AGIs $50k-75k, 3.9% for AGIs $75k-100k, 4.4% for AGIs $100k-200k, 4.4% for AGIs over 200k)
Earned income credit: $2,492 (reported on 20.6% of returns)
Here:
$2,492
State:
$2,646
(% of AGI for various income ranges: 8.5% for AGIs below $25k, 1.0% for AGIs $25k-50k)
Percentage of individuals using paid preparers for their 2012 taxes: 51.5%
Here:
52%
State:
60%
(% for various income ranges: 51.2% for AGIs below $25k, 48.7% for AGIs $25k-50k, 51.0% for AGIs $50k-75k, 52.8% for AGIs $75k-100k, 55.0% for AGIs $100k-200k, 78.6% for AGIs over 200k)
Averages for the 2004 tax year for zip code 35210, filed in 2005:
Average Adjusted Gross Income (AGI) in 2004: $43,346 (Individual Income Tax Returns)
Here:
$43,346
State:
$42,302
Salary/wage: $38,542 (reported on 83.6% of returns)
Here:
$38,542
State:
$36,626
(% of AGI for various income ranges: 96.1% for AGIs below $10k, 77.4% for AGIs $10k-25k, 84.7% for AGIs $25k-50k, 81.3% for AGIs $50k-75k, 81.7% for AGIs $75k-100k, 56.8% for AGIs over 100k)
Taxable interest for individuals: $2,277 (reported on 37.4% of returns)
This zip code:
$2,277
Alabama:
$1,827
(% of AGI for various income ranges: 6.2% for AGIs below $10k, 2.5% for AGIs $10k-25k, 1.5% for AGIs $25k-50k, 1.7% for AGIs $50k-75k, 1.6% for AGIs $75k-100k, 2.3% for AGIs over 100k)
Taxable dividends: $4,978 (reported on 21.6% of returns)
Here:
$4,978
State:
$4,206
(% of AGI for various income ranges: 3.4% for AGIs below $10k, 1.6% for AGIs $10k-25k, 1.2% for AGIs $25k-50k, 1.7% for AGIs $50k-75k, 1.6% for AGIs $75k-100k, 4.6% for AGIs over 100k)
Net capital gain/loss: +$9,786 (reported on 16.2% of returns)
Here:
+$9,786
State:
+$13,031
(% of AGI for various income ranges: -2.1% for AGIs below $10k, -0.3% for AGIs $10k-25k, 0.3% for AGIs $25k-50k, 1.1% for AGIs $50k-75k, 1.5% for AGIs $75k-100k, 10.4% for AGIs over 100k)
Profit/loss from business: +$8,954 (reported on 14.1% of returns)
Here:
+$8,954
State:
+$8,302
(% of AGI for various income ranges: 6.7% for AGIs below $10k, 5.5% for AGIs $10k-25k, 1.8% for AGIs $25k-50k, 1.3% for AGIs $50k-75k, 0.9% for AGIs $75k-100k, 4.6% for AGIs over 100k)
IRA payment deduction: $2,962 (reported on 2.4% of returns)
35210:
$2,962
Alabama:
$3,006
(% of AGI for various income ranges: 0.3% for AGIs $10k-25k, 0.2% for AGIs $25k-50k, 0.1% for AGIs $50k-75k, 0.1% for AGIs $75k-100k, 0.1% for AGIs over 100k)
Self-employed pension: $11,346 (reported on 0.4% of returns)
Here:
$11,346
Alabama:
$17,165
Total itemized deductions: $16,656 (23% of AGI, reported on 40.3% of returns)
Here:
$16,656
State:
$17,623
Here:
23.1% of AGI
State:
20.8% of AGI
(% of AGI for various income ranges: 20.0% for AGIs below $10k, 11.8% for AGIs $10k-25k, 16.5% for AGIs $25k-50k, 16.6% for AGIs $50k-75k, 16.8% for AGIs $75k-100k, 14.4% for AGIs over 100k)
Charity contributions deductions: $4,287 (6% of AGI, reported on 37.1% of returns)
Here:
$4,287
State:
$4,768
Here:
5.7% of AGI
State:
5.4% of AGI
(% of AGI for various income ranges: 1.8% for AGIs below $10k, 1.9% for AGIs $10k-25k, 3.1% for AGIs $25k-50k, 3.7% for AGIs $50k-75k, 4.3% for AGIs $75k-100k, 4.5% for AGIs over 100k)
Total tax: $6,325 (reported on 74.1% of returns)
35210:
$6,325
State:
$6,905
(% of AGI for various income ranges: 3.4% for AGIs below $10k, 3.7% for AGIs $10k-25k, 6.7% for AGIs $25k-50k, 9.2% for AGIs $50k-75k, 10.3% for AGIs $75k-100k, 17.9% for AGIs over 100k)
Earned income credit: $1,856 (reported on 18.6% of returns)
Here:
$1,856
State:
$2,048
Percentage of individuals using paid preparers for their 2004 taxes: 56.0%
Here:
56%
State:
65%
(% for various income ranges: 48.4% for AGIs below $10k, 61.6% for AGIs $10k-25k, 54.8% for AGIs $25k-50k, 53.4% for AGIs $50k-75k, 56.5% for AGIs $75k-100k, 62.6% for AGIs over 100k)
Likely homosexual households (counted as self-reported same-sex unmarried-partner households)
Lesbian couples: 0.1% of all households
Gay men: 0.4% of all households
Household received Food Stamps/SNAP in the past 12 months: 482 Household did not receive Food Stamps/SNAP in the past 12 months: 5,666
Women who had a birth in the past 12 months: 123 (67 now married, 49 unmarried) Women who did not have a birth in the past 12 months: 2,441 (800 now married, 1,643 unmarried)
Housing units in zip code 35210 with a mortgage: 2,983 (343 second mortgage, 35 home equity loan, 219 both second mortgage and home equity loan) Houses without a mortgage: 68
Median monthly owner costs for units with a mortgage: $1,372 Median monthly owner costs for units without a mortgage: $441
Residents with income below the poverty level in 2022:
This zip code:
10.4%
Whole state:
16.2%
Residents with income below 50% of the poverty level in 2022:
This zip code:
4.9%
Whole state:
8.6%
Median number of rooms in houses and condos:
Here:
6.3
State:
6.5
Median number of rooms in apartments:
Here:
4.5
State:
4.7
Notable locations in this zip code not listed on our city pages
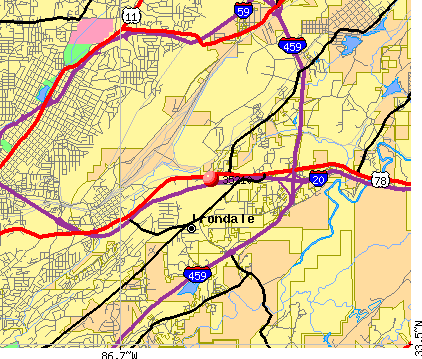
Notable locations in zip code 35210: Brookwood Country Club (A), Pine Tree Country Club (B), Eastwood Shopping Plaza (C), Ernest Norris Yards (D), Queenstown Industrial Park (E), Mountain Brook Swim and Tennis Club (F), Saint Martins Home for the Aged (G), Irondale City Hall (H), Irondale Fire Department Station 1 (I), Irondale Fire Department Station 2 (J), Irondale Fire Department Station 3 (K), Birmingham Fire and Rescue Service Station 26 (L), Birmingham Fire and Rescue Service Station 31 (M). Display/hide their locations on the map
Shopping Centers: Village East Shopping Center (1), Irondale Plaza Shopping Center (2), Grants Mill Station Shopping Center (3). Display/hide their locations on the map
Churches in zip code 35210 include: New Hope Church (A), Crestway Baptist Church (B), Irondale Presbyterian Church (C), First Pentecostal Holiness Church (D), First Baptist Church of Irondale (E), Bethel Church (F), Acton Church (G), Mount Hebron Baptist Church (H), Grace United Methodist Church (I). Display/hide their locations on the map
Cemeteries: Forest Crest Cemetery (1), Earltown Cemetery (2), Bass Cemetery (3), McElwain Cemetery (4), Bass Cemetery (5), Bush Cemetery (6), McCombs Cemetery (7). Display/hide their locations on the map
Reservoirs: Horst Pond (A), Drummond Lake (B), Osborne Lake (C), Pine Tree Country Club Lake (D), Alton Lake (E), City of Birmingham - Roebuck Plaza Lake (F), Hall Lake (G), Mountain Lake (H). Display/hide their locations on the map
In group quarters: 677 (-1 institutionalized population)
Size of family households: 1,839 2-persons, 591 3-persons, 517 4-persons, 160 5-persons, 14 6-persons, 31 7-or-more-persons
Size of nonfamily households: 2,440 1-person, 540 2-persons, 25 3-persons
985 married couples with children.
381 single-parent households (10 men, 371 women).
91.6% of residents of 35210 zip code speak English at home.
5.5% of residents speak Spanish at home (55% very well, 26% well, 20% not well).
1.1% of residents speak other Indo-European language at home (71% very well, 20% well, 9% not well).
0.1% of residents speak Asian or Pacific Island language at home (100% very well).
2.4% of residents speak other language at home (53% very well, 47% well).
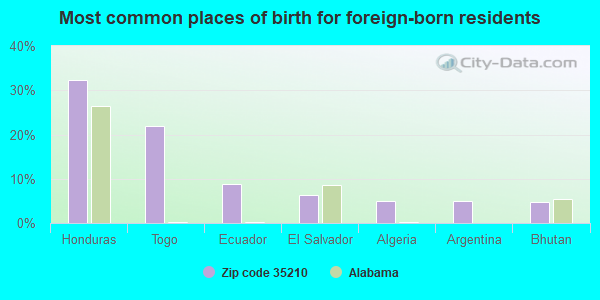
Foreign born population: 843 (6.3%) (32.9% of them are naturalized citizens)
This zip code:
6.3%
Whole state:
3.8%
32%Honduras
22%Togo
9%Ecuador
6%El Salvador
5%Algeria
5%Argentina
5%Bhutan
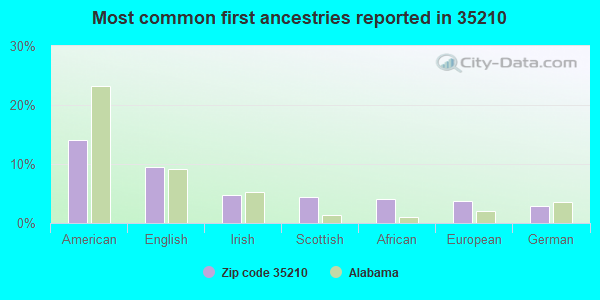
14%American
9%English
5%Irish
4%Scottish
4%African
4%European
3%German
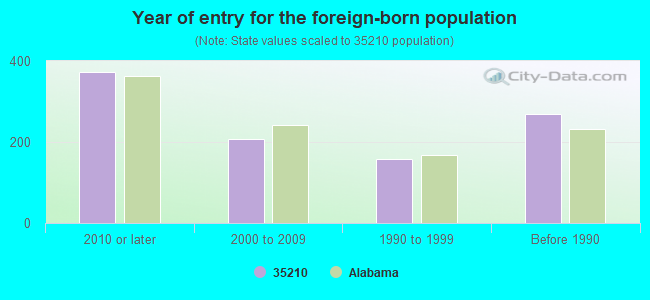
Year of entry for the foreign-born population
3722010 or later
2082000 to 2009
1581990 to 1999
270Before 1990
Public elementary/middle schools in in zip code 35210 not listed on the city page:
Private elementary/middle school in in this zip code not listed on the city page:
WEBSTER CHRISTIAN SCHOOL (Students: 98, Location: 4700 HIGHLANDS WAY, Grades: KG-7)
Major facilities with environmental interests located in this zip code:
READY MIX USA,LLC (2653 RUFFNER ROAD in IRONDALE, AL)
AIR SYNTHETIC MINOR (AIRS/AFS) CRITERIA AND HAZARDOUS AIR POLLUTANT INVENTORY (Inventory of air pollution sources) National Pollutant Discharge Elimination System NON-MAJOR (Tracking pollutant discharge elimination systems) - permit (Resource Conservation and Recovery Act (tracking hazardous waste)) Business SIC classification: CONCRETE PRODUCTS, EXCEPT BLOCK AND BRICK; READY-MIXED CONCRETE Organizations: READY MIX USA INC (CONTACT/OWNER)
, READY MIX USA LLC (CONTACT/OWNER)
Alternative names: READY MIX USA 2653 RUFFNER, READY MIX USA INC IRONDALE PLANT, READY MIX USA,INC,(RUFFNER ROAD PLANT), READY MIX USA INC, READY MIX USA INC IRONDALE PLANT, SOUTHERN READY MIX INCORPORATED RUFFNER ROAD P
NORFOLK SOUTHERN RAILWAY COMPANY (1400 NORFOLK SOUTHERN DRIVE in IRONDALE, AL)
National Pollutant Discharge Elimination System NON-MAJOR (Tracking pollutant discharge elimination systems) - permit Conditionally Exempt Small Quantity Generators, less than 100 kg/month of hazardous waste (Resource Conservation and Recovery Act (tracking hazardous waste)) Business SIC classification: RAILROADS, LINE-HAUL OPERATING Organizations: NORFOLK SOUTHERN RAILWAY IRONDALE YARD (CONTACT/OPERATOR)
, NORFOLK SOUTHERN RAILWAY IRONDALE YARD (CONTACT/OWNER)
Alternative names: AL GREAT SOUTHERN RAILROAD NOR, AL GREAT SOUTHERN RR NORRIS
MOTION INDUSTRIES INC (1601 ALTON ROAD in BIRMINGHAM, AL)
AIR MINOR (AIRS/AFS) CRITERIA AND HAZARDOUS AIR POLLUTANT INVENTORY (Inventory of air pollution sources) Conditionally Exempt Small Quantity Generators, less than 100 kg/month of hazardous waste (Resource Conservation and Recovery Act (tracking hazardous waste)) - notification Business SIC classification: BALL AND ROLLER BEARINGS; FLUID POWER CYLINDERS AND ACTUATORS; FLUID POWER PUMPS AND MOTORS Organizations: OPERNAME (CONTACT/OPERATOR)
ESTATES AT MOUNTAIN RIDGE (CLAIMONT PARK LLC in IRONDALE, AL)
National Pollutant Discharge Elimination System NON-MAJOR (Tracking pollutant discharge elimination systems) - permit National Pollutant Discharge Elimination System NON-MAJOR (Tracking pollutant discharge elimination systems) - permit Business SIC classification: GENERAL CONTRACTORS-SINGLE-FAMILY HOUSES
PENSKE AUTO CENTER (7845 CRESTWOOD BOULEVARD in BIRMINGHAM, AL)
AIR MINOR (AIRS/AFS) (Resource Conservation and Recovery Act (tracking hazardous waste)) Business SIC classification: GENERAL AUTOMOTIVE REPAIR SHOPS Organizations: PENSKE AUTO CENTER INC (CONTACT/OWNER)
ALLEN CHEMICAL CO (7917 CRESTWOOD BLVD PO BOX 6705 in BIRMINGHAM, AL)
(Integrated Compliance Information System) - ICIS-04-1994-0451, FORMAL ENFORCEMENT ACTION
CLINT PALMER AUTO PARTS (1909 RUFFNER ROAD in BIRMINGHAM, AL)
National Pollutant Discharge Elimination System NON-MAJOR (Tracking pollutant discharge elimination systems) - permit (Resource Conservation and Recovery Act (tracking hazardous waste)) Business SIC classification: MOTOR VEHICLE PARTS, USED
BENCHMARK CHRYSLER JEEP DODGE (1313 GRANTS MILL WAY in IRONDALE, AL)
(Resource Conservation and Recovery Act (tracking hazardous waste)) Business NAICS classification: ALL OTHER AUTOMOTIVE REPAIR AND MAINTENANCE. Organizations: TERRY SPITZER (CONTACT/OPERATOR)
CHANDLER'S GARAGE INC (2522 CRESTWOOD BOULEVARD in IRONDALE, AL)
(Resource Conservation and Recovery Act (tracking hazardous waste)) Organizations: BECKY CHANDLER (CONTACT/OPERATOR)
, DAN L CHANDLER (CONTACT/OPERATOR)
PALMER BROTHERS AUTO PARTS (1849 RUFFNER ROAD in BIRMINGHAM, AL)
National Pollutant Discharge Elimination System NON-MAJOR (Tracking pollutant discharge elimination systems) - permit Conditionally Exempt Small Quantity Generators, less than 100 kg/month of hazardous waste (Resource Conservation and Recovery Act (tracking hazardous waste)) Business SIC classification: MOTOR VEHICLE PARTS, USED Organizations: PALMER BROS AUTO PARTS INC (CONTACT/OWNER)
OSKAR USA, L.L.C. (511 VULCAN DRIVE in BIRMINGHAM, AL)
AIR SYNTHETIC MINOR (AIRS/AFS) CRITERIA AND HAZARDOUS AIR POLLUTANT INVENTORY (Inventory of air pollution sources) (Resource Conservation and Recovery Act (tracking hazardous waste)) Business SIC classification: COATING, ENGRAVING, AND ALLIED SERVICES Organizations: AMERICAN METAL HANDLE (CONTACT/OWNER)
Alternative names: AMERICAN METAL HANDLE, AMERICAN METAL HANDLE LLC, OSKAR USA LLC
CCL LABEL (2617 COMMERCE CIRCLE in IRONDALE, AL)
National Pollutant Discharge Elimination System NON-MAJOR (Tracking pollutant discharge elimination systems) - permit Small Quantity Generators, between 100 kg and 1000 kg of hazardous waste/month (Resource Conservation and Recovery Act (tracking hazardous waste)) Business SIC classification: SANITARY SERVICES Organizations: HIGGINS & PHILLIPS INVESTMENTS (CONTACT/OWNER)
CHEROKEE BEND SOUTH (DUNCAN AND GILLIAM CONST CO in IRONDALE, AL)
National Pollutant Discharge Elimination System NON-MAJOR (Tracking pollutant discharge elimination systems) - permit Business SIC classification: HIGHWAY AND STREET CONSTRUCTION, EXCEPT ELEVATED HIGHWAYS
Housing units lacking complete plumbing facilities: 0.6% Housing units lacking complete kitchen facilities: 1.2%
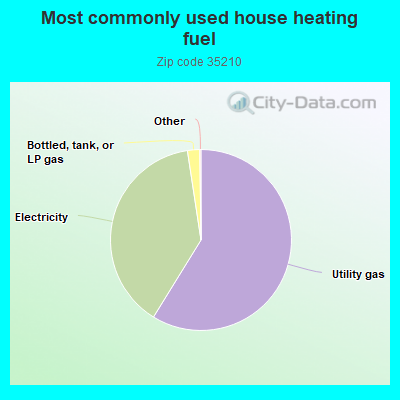
58.8%Utility gas
38.8%Electricity
2.2%Bottled, tank, or LP gas
Population in 1990: 15,047.
Place of birth for U.S.-born residents:
This state: 8,871
Northeast: 872
Midwest: 527
South: 1,829
West: 231
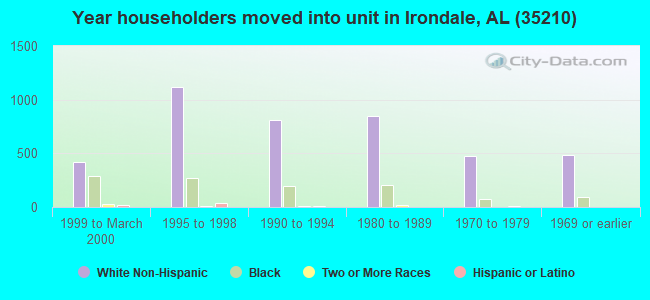
63% of the 35210 zip code residents lived in the same house 5 years ago. Out of people who lived in different houses, 69% lived in this county. Out of people who lived in different counties, 50% lived in Alabama.
89% of the 35210 zip code residents lived in the same house 1 year ago. Out of people who lived in different houses, 50% moved from this county. Out of people who lived in different houses, 29% moved from different county within same state. Out of people who lived in different houses, 13% moved from different state. Out of people who lived in different houses, 6% moved from abroad.
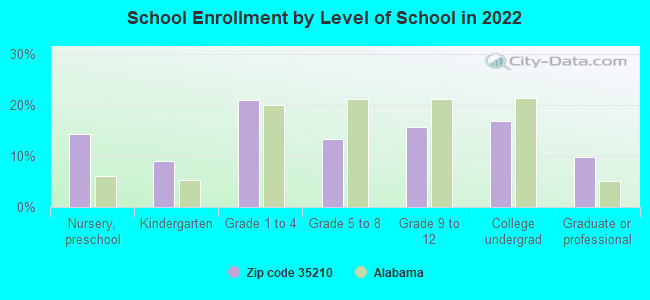
Private vs. public school enrollment:
Students in private schools in grades 1 to 8 (elementary and middle school): 341
Here:
52.0%
Alabama:
14.7%
Students in private schools in grades 9 to 12 (high school): 76
Here:
26.5%
Alabama:
16.3%
Students in private undergraduate colleges: 160
Here:
52.6%
Alabama:
14.6%
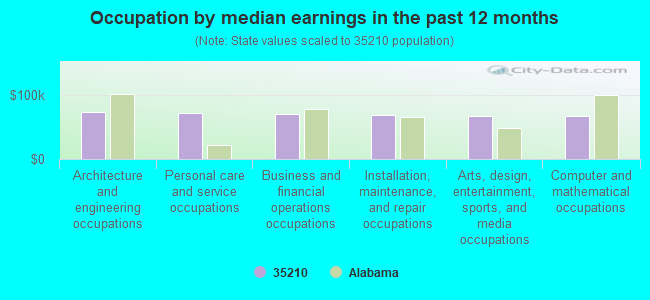
Occupation by median earnings in the past 12 months ($)
72,522Architecture and engineering occupations
70,705Personal care and service occupations
70,009Business and financial operations occupations
67,693Installation, maintenance, and repair occupations
66,602Arts, design, entertainment, sports, and media occupations
66,527Computer and mathematical occupations
Companies with biggest federal contracts located in this zip code (BIRMINGHAM, AL):
ELECTRICAL-MECHANICAL CONTRS (2541 BALCO RD; small business) : $597,000 in 2 contractsfrom 2001 to 2002
$512,000 with Air Force for Maintenance, Repair or Alteration of Real Property -- Other Non-Building Facilities. Taking place in TN. Signed on 2001-09-14. Completion date: 2002-03-31.
$85,000 with Air Force for Maintenance, Repair or Alteration of Real Property -- Fuel Supply Facilities. Taking place in TN. Signed on 2002-01-09. Completion date: 2002-01-08.
BALBOA INVESTMENT GROUP CORPOR (5320 BEACON DR; small business) : $296,404 in 28 contractsfrom 2002 to 2006
Contracts for Military Personnel Recruitment, Lodging - Hotel/Motel by Army Signed by year:2000: $0; 2001: $0; 2002: $94,518; 2003: $8,024; 2004: $116,401; 2005: $64,063; 2006: $13,398.
Biggest contracts:
$111,268 with Army for Military Personnel Recruitment. Signed on 2004-12-07. Completion date: 2005-12-06.
$60,888 with Army for Lodging - Hotel/Motel. Signed on 2002-04-10. Completion date: 2002-04-30.
$33,630, same as above.Signed on 2002-04-26. Completion date: 2002-04-30.
$20,389 with Army for Military Personnel Recruitment. Signed on 2005-09-07. Completion date: 2005-09-01.
M & S LLC (2816 5TH AVE S; small business) : $220,739 in 2 contractsin 2005
$199,170 with Army for Trucks and Truck Tractors, Wheeled. Signed on 2005-09-30. Completion date: 2005-12-30.
$21,569 with U.S. Army Corps of Engineers - civil program financing only for Passenger Motor Vehicles. Signed on 2005-08-23. Completion date: 2005-09-26.
CLIMATE CONTROL SYSTEMS, INC (501 25TH ST S; small business) : $194,204 in 11 contractsfrom 2004 to 2006
Contracts for Maintenance, Repair or Alteration of Real Property -- Office Buildings, Refrigeration and Air Conditioning Components, Installation of Equipment -- Plumbing, Heating, and Waste Disposal Equipment, Fire Fighting Equipment, and moreby Public Buildings Service, Army Signed by year:2000: $0; 2001: $0; 2002: $0; 2003: $0; 2004: $153,612; 2005: $37,450; 2006: $3,142.
Biggest contracts:
$97,500 with Public Buildings Service for Maintenance, Repair or Alteration of Real Property -- Office Buildings. Taking place in KY. Signed on 2004-12-10. Completion date: 2005-04-30.
$29,960 with Army for Refrigeration and Air Conditioning Components. Taking place in GA. Signed on 2005-05-23. Completion date: 2005-06-20.
$13,900 with Army for Installation of Equipment -- Plumbing, Heating, and Waste Disposal Equipment. Signed on 2004-06-15. Completion date: 2004-07-15.
$11,456 with Army for Fire Fighting Equipment. Signed on 2004-05-15. Completion date: 2004-05-14.
YALE CAROLINAS, INC (6209 AMBERHILLS RD; small business) : $143,000 in 2 contractsfrom 2001 to 2002
$90,000 with NASA for Miscellaneous Materials Handling Equipment. Signed on 2001-12-15. Completion date: 2002-03-15.
$53,000 with NASA for Trucks and Truck Tractors, Wheeled. Signed on 2002-08-15. Completion date: 2002-10-15.
WOOD-FRUITTICHER GROCERY CO IN (2900 ALTON RD; small business) : $86,084 in 6 contractsfrom 2005 to 2006
Contracts for Perishable Subsistence $10k To $25K, Food, Oils and Fats by Army Signed by year:2000: $0; 2001: $0; 2002: $0; 2003: $0; 2004: $0; 2005: $9,303; 2006: $76,781.
Biggest contracts:
$48,026 with Army for Perishable Subsistence $10k To $25K. Signed on 2006-04-03. Completion date: 2006-06-30.
$28,755, same as above.Signed on 2006-06-01. Completion date: 2006-06-30.
$3,239 with Army for Food, Oils and Fats. Signed on 2005-09-30. Completion date: 2005-09-30.
$2,493, same as above.Signed on 2005-09-30. Completion date: 2005-09-30.
EMPIRE PIPE AND SUPPLY COMPANY (2301 ALTON ROAD; small business)
$40,176 with U.S. Army Corps of Engineers - civil program financing only for Pipe, Tube and Rigid Tubing. Signed on 2000-03-14. Completion date: 2000-03-24.
HAL ROACH CONSTRUCTION, INC. (5000 COMMERCE AVENUE; small business)
$32,889 with Army for Engineering and Technical Services. Signed on 2000-03-09. Completion date: 2000-12-31.
N HOUSE TAPE & DISC (1530 HERITAGE PLACE DRIVE; small business)
$9,630 with Department of Defense for ADP Input/Output and Storage Devices. Signed on 2002-09-24. Completion date: 2002-10-11.
BRITT ENGINEERING (1833 ALTON RD STE 104; small business)
$8,400 with Army for Other Special Studies and Analyses. Signed on 2002-07-26. Completion date: 2002-09-30.
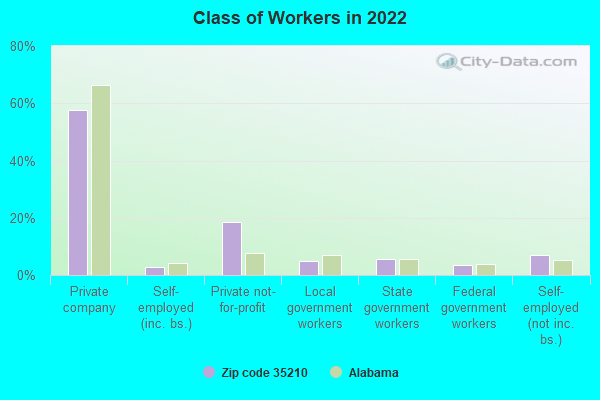
Top industries in this zip code by the number of employees in 2005:
Health Care and Social Assistance: Continuing Care Retirement Communities (250-499 employees: 2 establishments, 100-249 employees: 1 establishment, 1-4 employees: 1 establishment)
2002 - 2018 National Fire Incident Reporting System (NFIRS) incidents
According to the data from the years 2002 - 2018 the average number of fires per year is 103. The highest number of fires - 170 took place in 2005, and the least - 50 in 2013. The data has an increasing trend.
When looking into fire subcategories, the most incidents belonged to: Outside Fires (39.6%), and Structure Fires (28.9%).
Fire incident types reported to NFIRS in Zip Code 35210


 Nearest zip codes: 35206, 35213, 35212, 35223, 35235, 35222.


 (Students: 373, Location: 5110 GRANTSWOOD RD, Grades: KG-2)

 According to the data from the years 2002 - 2018 the average number of fires per year is 103. The highest number of fires - 170 took place in 2005, and the least - 50 in 2013. The data has an increasing trend.
 When looking into fire subcategories, the most incidents belonged to: Outside Fires (39.6%), and Structure Fires (28.9%).