Estimated zip code population in 2022: 5,336 Zip code population in 2010: 5,605 Zip code population in 2000: 6,202
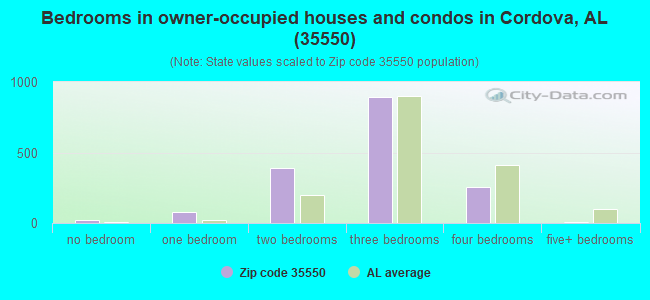
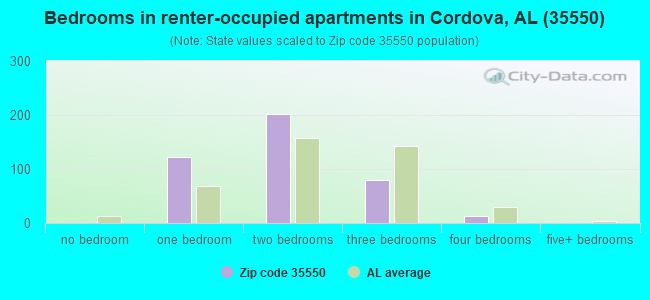
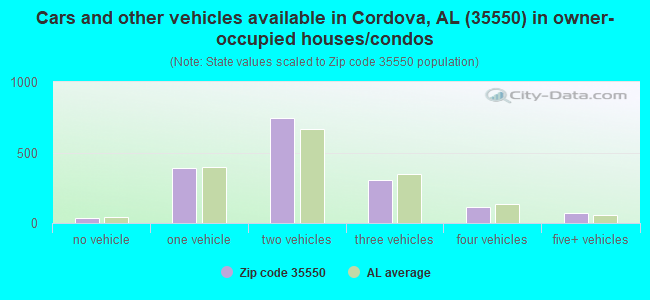
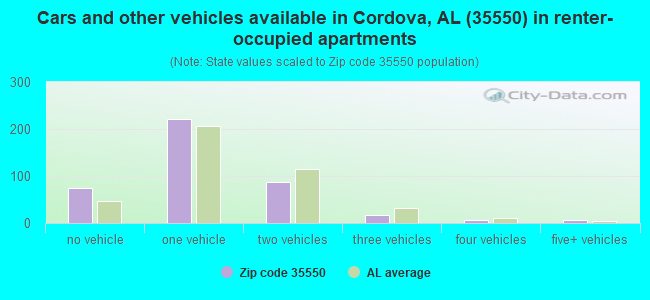
Houses and condos: 2,475 Renter-occupied apartments: 415
% of renters here:
20%
State:
30%
March 2022 cost of living index in zip code 35550: 79.2 (low, U.S. average is 100)
Land area: 65.8 sq. mi. Water area: 1.4 sq. mi.
Population density: 81 people per square mile
(very low).
OSM Map
General Map
Google Map
MSN Map
OSM Map
General Map
Google Map
MSN Map
OSM Map
General Map
Google Map
MSN Map
OSM Map
General Map
Google Map
MSN Map
Please wait while loading the map...
Real estate property taxes paid for housing units in 2022:
This zip code:
0.2% ($220)
Alabama:
0.4% ($718)
Median real estate property taxes paid for housing units with mortgages in 2022: $459 (0.3%) Median real estate property taxes paid for housing units with no mortgage in 2022: $203 (0.3%)
Business Search- 14 Million verified businesses
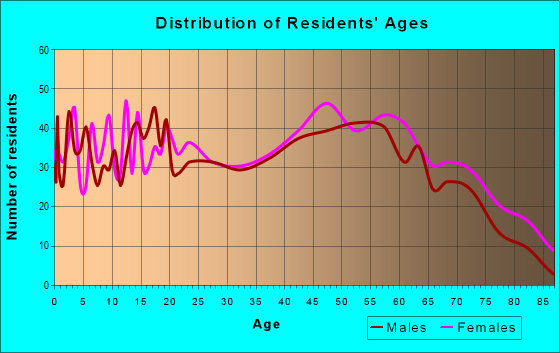
Males: 2,632
(49.3%)
Females: 2,704
(50.7%)
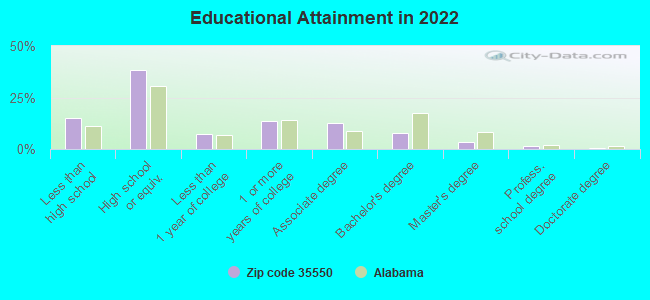
For population 25 years and over in 35550:
High school or higher: 83.2%
Bachelor's degree or higher: 12.8%
Graduate or professional degree: 5.1%
Unemployed: 8.8%
Mean travel time to work (commute): 31.3 minutes
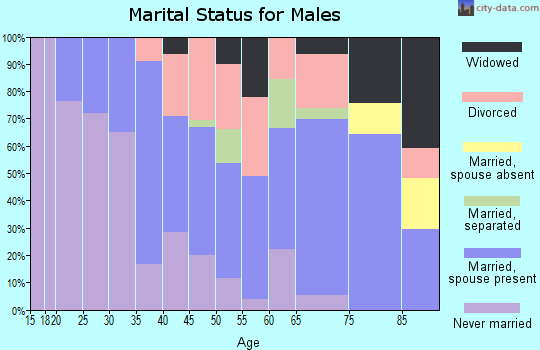
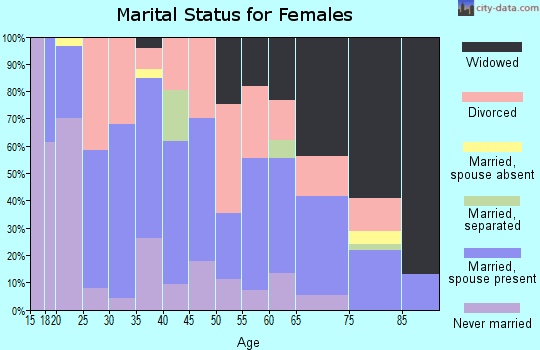
For population 15 years and over in 35550:
Never married: 23.9%
Now married: 54.3%
Separated: 1.2%
Widowed: 8.8%
Divorced: 11.8%
Zip code 35550 compared to state average:
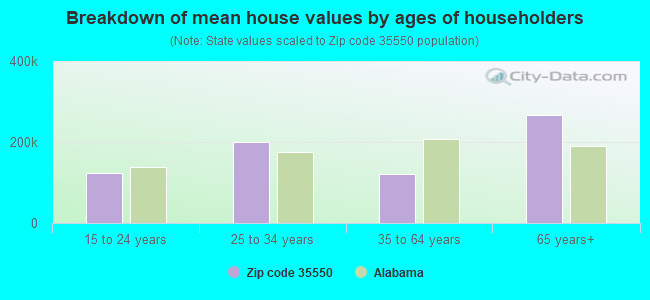
Median house value below state average.
Unemployed percentage above state average.
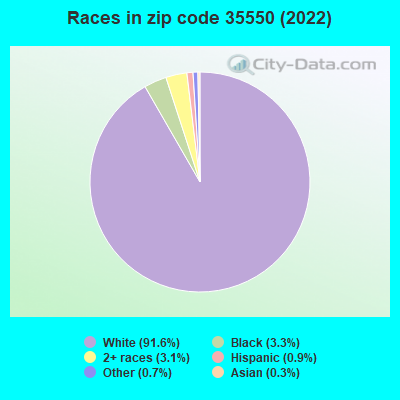
Black race population percentage significantly below state average.
Hispanic race population percentage significantly below state average.
Median age above state average.
Foreign-born population percentage significantly below state average.
Length of stay since moving in above state average.
Number of college students below state average.
Percentage of population with a bachelor's degree or higher below state average.
Averages for the 2020 tax year for zip code 35550, filed in 2021:
Average Adjusted Gross Income (AGI) in 2020: $46,707 (Individual Income Tax Returns)
Here:
$46,707
State:
$63,984
Salary/wage: $44,472 (reported on 82.2% of returns)
Here:
$44,472
State:
$52,834
(% of AGI for various income ranges: 1095.1% for AGIs below $25k, 3486.7% for AGIs $25k-50k, 6177.1% for AGIs $50k-75k, 10084.5% for AGIs $75k-100k, 14905.0% for AGIs $100k-200k)
Taxable interest for individuals: $868 (reported on 20.8% of returns)
This zip code:
$868
Alabama:
$1,615
(% of AGI for various income ranges: 11.0% for AGIs below $25k, 16.9% for AGIs $25k-50k, 17.9% for AGIs $50k-75k, 19.1% for AGIs $75k-100k, 125.8% for AGIs $100k-200k)
Ordinary dividends: $1,222 (reported on 4.6% of returns)
Here:
$1,222
State:
$7,660
(% of AGI for various income ranges: 10.7% for AGIs $25k-50k, 11.2% for AGIs $50k-75k, 29.2% for AGIs $100k-200k)
Net capital gain/loss in AGI: +$412 (reported on 4.1% of returns)
Here:
+$412
State:
+$23,528
(% of AGI for various income ranges: 31.7% for AGIs $100k-200k)
Profit/loss from business: +$5,981 (reported on 13.7% of returns)
Here:
+$5,981
State:
+$9,534
(% of AGI for various income ranges: 138.1% for AGIs below $25k, 104.4% for AGIs $25k-50k, 27.5% for AGIs $50k-75k, 116.4% for AGIs $75k-100k, 113.3% for AGIs $100k-200k)
Taxable individual retirement arrangement distribution: $16,760 (reported on 5.1% of returns)
35550:
$16,760
Alabama:
$19,004
(% of AGI for various income ranges: 22.2% for AGIs below $25k, 56.7% for AGIs $25k-50k, 245.4% for AGIs $50k-75k, 584.2% for AGIs $100k-200k)
Total itemized deductions: $33,550 (reported on 2.0% of returns)
Here:
$33,550
State:
$37,338
(% of AGI for various income ranges: 1118.3% for AGIs $100k-200k)
Charity contributions: $20,733 (reported on 1.5% of returns)
Here:
$20,733
State:
$18,005
(% of AGI for various income ranges: 518.3% for AGIs $100k-200k)
Taxes paid: $5,900 (reported on 2.0% of returns)
35550:
$5,900
State:
$6,484
(% of AGI for various income ranges: 196.7% for AGIs $100k-200k)
Earned income credit: $2,533 (reported on 24.9% of returns)
Here:
$2,533
State:
$2,628
(% of AGI for various income ranges: 135.1% for AGIs below $25k, 98.7% for AGIs $25k-50k)
Percentage of individuals using paid preparers for their 2020 taxes: 92.4%
Here:
92%
State:
93%
(% for various income ranges: 91.9% for AGIs below $25k, 93.0% for AGIs $25k-50k, 93.3% for AGIs $50k-75k, 87.5% for AGIs $75k-100k, 94.1% for AGIs $100k-200k, 100.0% for AGIs over 200k)
Averages for the 2012 tax year for zip code 35550, filed in 2013:
Average Adjusted Gross Income (AGI) in 2012: $41,365 (Individual Income Tax Returns)
Here:
$41,365
State:
$52,001
Salary/wage: $38,785 (reported on 84.8% of returns)
Here:
$38,785
State:
$43,822
(% of AGI for various income ranges: 71.2% for AGIs below $25k, 81.3% for AGIs $25k-50k, 83.3% for AGIs $50k-75k, 84.2% for AGIs $75k-100k, 76.3% for AGIs $100k-200k)
Taxable interest for individuals: $720 (reported on 22.2% of returns)
This zip code:
$720
Alabama:
$1,592
(% of AGI for various income ranges: 0.7% for AGIs below $25k, 0.7% for AGIs $25k-50k, 0.3% for AGIs $50k-75k, 0.2% for AGIs $75k-100k, 0.2% for AGIs $100k-200k)
Ordinary dividends: $1,546 (reported on 6.6% of returns)
Here:
$1,546
State:
$5,697
(% of AGI for various income ranges: 0.3% for AGIs below $25k, 0.3% for AGIs $25k-50k, 0.4% for AGIs $50k-75k, 0.1% for AGIs $100k-200k)
Profit/loss from business: +$5,996 (reported on 12.6% of returns)
Here:
+$5,996
State:
+$9,151
(% of AGI for various income ranges: 10.8% for AGIs below $25k, 1.4% for AGIs $25k-50k)
Taxable individual retirement arrangement distribution: $9,454 (reported on 6.6% of returns)
35550:
$9,454
Alabama:
$14,992
(% of AGI for various income ranges: 1.3% for AGIs below $25k, 1.8% for AGIs $25k-50k, 1.4% for AGIs $50k-75k, 3.7% for AGIs $75k-100k)
Total itemized deductions: $17,770 (21% of AGI, reported on 16.7% of returns)
Here:
$17,770
State:
$21,388
Here:
20.9% of AGI
State:
20.1% of AGI
(% of AGI for various income ranges: 4.3% for AGIs below $25k, 5.5% for AGIs $25k-50k, 6.2% for AGIs $50k-75k, 9.1% for AGIs $75k-100k, 9.7% for AGIs $100k-200k)
Charity contributions: $5,321 (reported on 14.1% of returns)
Here:
$5,321
State:
$5,925
(% of AGI for various income ranges: 0.7% for AGIs below $25k, 1.1% for AGIs $25k-50k, 1.5% for AGIs $50k-75k, 2.0% for AGIs $75k-100k, 3.2% for AGIs $100k-200k)
Taxes paid: $3,842 (reported on 16.7% of returns)
35550:
$3,842
State:
$5,272
(% of AGI for various income ranges: 0.5% for AGIs below $25k, 0.7% for AGIs $25k-50k, 1.3% for AGIs $50k-75k, 1.7% for AGIs $75k-100k, 2.9% for AGIs $100k-200k)
Earned income credit: $2,547 (reported on 28.8% of returns)
Here:
$2,547
State:
$2,646
(% of AGI for various income ranges: 10.3% for AGIs below $25k, 1.5% for AGIs $25k-50k)
Percentage of individuals using paid preparers for their 2012 taxes: 65.7%
Here:
66%
State:
60%
(% for various income ranges: 63.7% for AGIs below $25k, 68.1% for AGIs $25k-50k, 64.5% for AGIs $50k-75k, 68.8% for AGIs $75k-100k, 69.2% for AGIs $100k-200k)
Averages for the 2004 tax year for zip code 35550, filed in 2005:
Average Adjusted Gross Income (AGI) in 2004: $32,001 (Individual Income Tax Returns)
Here:
$32,001
State:
$42,302
Salary/wage: $30,738 (reported on 86.9% of returns)
Here:
$30,738
State:
$36,626
(% of AGI for various income ranges: 84.6% for AGIs below $10k, 76.7% for AGIs $10k-25k, 85.8% for AGIs $25k-50k, 89.0% for AGIs $50k-75k, 88.6% for AGIs $75k-100k, 71.0% for AGIs over 100k)
Taxable interest for individuals: $1,379 (reported on 25.9% of returns)
This zip code:
$1,379
Alabama:
$1,827
(% of AGI for various income ranges: 2.7% for AGIs below $10k, 2.0% for AGIs $10k-25k, 0.9% for AGIs $25k-50k, 0.3% for AGIs $50k-75k, 0.3% for AGIs $75k-100k, 2.3% for AGIs over 100k)
Taxable dividends: $990 (reported on 9.6% of returns)
Here:
$990
State:
$4,206
(% of AGI for various income ranges: 0.2% for AGIs below $10k, 0.5% for AGIs $10k-25k, 0.4% for AGIs $25k-50k, 0.1% for AGIs $50k-75k, 0.2% for AGIs $75k-100k, 0.2% for AGIs over 100k)
Net capital gain/loss: +$712 (reported on 5.0% of returns)
Here:
+$712
State:
+$13,031
(% of AGI for various income ranges: -0.4% for AGIs below $10k, 0.1% for AGIs $10k-25k, 0.2% for AGIs $25k-50k, 0.1% for AGIs $50k-75k, 0.1% for AGIs $75k-100k, 0.2% for AGIs over 100k)
Profit/loss from business: +$3,389 (reported on 10.7% of returns)
Here:
+$3,389
State:
+$8,302
(% of AGI for various income ranges: 8.2% for AGIs below $10k, 3.0% for AGIs $10k-25k, 1.2% for AGIs $25k-50k, -0.2% for AGIs $50k-75k, 0.1% for AGIs $75k-100k)
IRA payment deduction: $2,188 (reported on 0.8% of returns)
35550:
$2,188
Alabama:
$3,006
Total itemized deductions: $13,967 (23% of AGI, reported on 18.9% of returns)
Here:
$13,967
State:
$17,623
Here:
22.8% of AGI
State:
20.8% of AGI
(% of AGI for various income ranges: 4.7% for AGIs below $10k, 5.6% for AGIs $10k-25k, 8.0% for AGIs $25k-50k, 8.1% for AGIs $50k-75k, 11.2% for AGIs $75k-100k, 10.0% for AGIs over 100k)
Charity contributions deductions: $3,603 (6% of AGI, reported on 17.1% of returns)
Here:
$3,603
State:
$4,768
Here:
5.6% of AGI
State:
5.4% of AGI
(% of AGI for various income ranges: 1.1% for AGIs $10k-25k, 1.6% for AGIs $25k-50k, 1.7% for AGIs $50k-75k, 2.9% for AGIs $75k-100k, 3.5% for AGIs over 100k)
Total tax: $3,845 (reported on 65.6% of returns)
35550:
$3,845
State:
$6,905
(% of AGI for various income ranges: 1.9% for AGIs below $10k, 3.0% for AGIs $10k-25k, 5.5% for AGIs $25k-50k, 8.4% for AGIs $50k-75k, 10.3% for AGIs $75k-100k, 17.5% for AGIs over 100k)
Earned income credit: $1,804 (reported on 27.2% of returns)
Here:
$1,804
State:
$2,048
Percentage of individuals using paid preparers for their 2004 taxes: 68.5%
Here:
68%
State:
65%
(% for various income ranges: 62.3% for AGIs below $10k, 69.1% for AGIs $10k-25k, 73.0% for AGIs $25k-50k, 69.9% for AGIs $50k-75k, 64.9% for AGIs $75k-100k, 72.9% for AGIs over 100k)
Household received Food Stamps/SNAP in the past 12 months: 360 Household did not receive Food Stamps/SNAP in the past 12 months: 1,702
Women who had a birth in the past 12 months: 34 (9 now married, 20 unmarried) Women who did not have a birth in the past 12 months: 1,263 (570 now married, 691 unmarried)
Housing units in zip code 35550 with a mortgage: 557 (29 second mortgage, 30 both second mortgage and home equity loan) Median monthly owner costs for units with a mortgage: $1,110 Median monthly owner costs for units without a mortgage: $389
Residents with income below the poverty level in 2022:
This zip code:
22.4%
Whole state:
16.2%
Residents with income below 50% of the poverty level in 2022:
This zip code:
15.1%
Whole state:
8.6%
Median number of rooms in houses and condos:
Here:
5.9
State:
6.5
Median number of rooms in apartments:
Here:
4.5
State:
4.7
Notable locations in this zip code not listed on our city pages
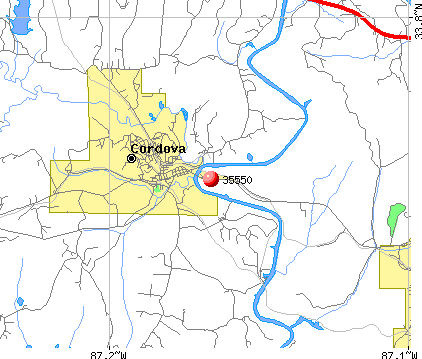
Notable locations in zip code 35550: Bush Tower (A), Barney Siding (B), Argo Area Volunteer Fire Department (C), Cordova Volunteer Fire Department (D), Barney Volunteer Fire Department (E). Display/hide their locations on the map
Churches in zip code 35550 include: Mount Pilgrim Church (A), New Hope Church (B), Mount Pisgah Church (C), Mount Philadelphia Baptist Church (D), Union Grove Church (E), Bartons Chapel (F), Saint James Methodist Episcopal Church (G), Riverside Church (H), Corinth Church (I). Display/hide their locations on the map
Cemeteries: Mount Carmel Cemetery (1), Fuller Cemetery (2), Friendship Cemetery (3), Mount Cedrum Cemetery (4), Davis Cemetery (5), Union Chapel Cemetery (6), Sardis Cemetery (7). Display/hide their locations on the map
Streams, rivers, and creeks: Standard Branch (A), Cunningham Creek (B), Barton Creek (C), Bruton Creek (D), Cane Creek (E), Mathis Creek (F), Mosquito Creek (G), Spokage Creek (H), Japanese Creek (I). Display/hide their locations on the map
In group quarters: 143 (-1 institutionalized population)
Size of family households: 761 2-persons, 453 3-persons, 177 4-persons, 78 5-persons, 6 6-persons, 28 7-or-more-persons
Size of nonfamily households: 497 1-person, 58 2-persons, 4 3-persons
515 married couples with children.
207 single-parent households (59 men, 148 women).
98.4% of residents of 35550 zip code speak English at home.
1.4% of residents speak Spanish at home (54% very well, 46% well).
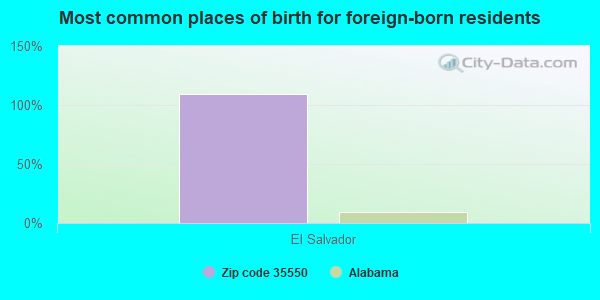
Foreign born population: 36 (0.7%) (0.0% of them are naturalized citizens)
:
0.7%
Whole state:
3.8%
109%El Salvador
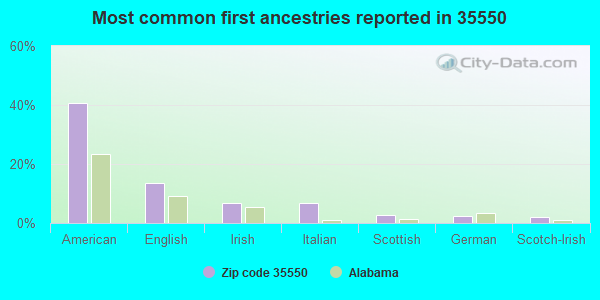
41%American
14%English
7%Irish
7%Italian
3%Scottish
2%German
2%Scotch-Irish
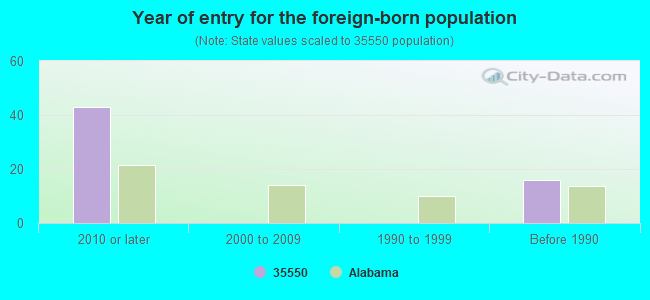
Year of entry for the foreign-born population
432010 or later
02000 to 2009
01990 to 1999
16Before 1990
Facilities with environmental interests located in this zip code:
AGC CORRIDOR X HP00035 (ALABAMA GAS CORPORATION in CORDOVA, AL)
National Pollutant Discharge Elimination System NON-MAJOR (Tracking pollutant discharge elimination systems) - permit Business SIC classification: NATURAL GAS DISTRIBUTION
PORT WALKER BARGE LOADING FAC (RICKY HOLLINGSWORTH EXCAVATING in CORDOVA, AL)
National Pollutant Discharge Elimination System NON-MAJOR (Tracking pollutant discharge elimination systems) - permit Business SIC classification: HEAVY CONSTRUCTION Organizations: PORT WALKER BARGE LOADNING FAC (CONTACT/OPERATOR)
RICETON HILL MINE (CORDOVA CLAY COMPANY INCORP in CORODVA, AL)
National Pollutant Discharge Elimination System NON-MAJOR (Tracking pollutant discharge elimination systems) - permit Business SIC classification: BITUMINOUS COAL AND LIGNITE SURFACE MINING Organizations: CORDOVA CLAY COMPANY INCORP (CONTACT/OPERATOR)
CANE CREEK MINE (BEAIRD MINING AND MINERALS CO in CORDOVA, AL)
National Pollutant Discharge Elimination System NON-MAJOR (Tracking pollutant discharge elimination systems) - permit Business SIC classification: BITUMINOUS COAL AND LIGNITE SURFACE MINING Organizations: BEAIRD MINING AND MINERALS CO (CONTACT/OWNER)
Alternative names: BEAIRD MINING AND MINERALS CO, BEAIRD MINING CANE CREEK MINE
CBI SERVICES INCORPORATED (WALKER COUNTY HIGHWAY 30 in CORDOVA, AL)
Conditionally Exempt Small Quantity Generators, less than 100 kg/month of hazardous waste (Resource Conservation and Recovery Act (tracking hazardous waste)) - notification TRI REPORTER (Tracking of toxic chemicals releasing facilities) Business SIC classification: FABRICATED PLATE WORK (BOILER SHOPS) Business NAICS classification: PLATE WORK MANUFACTURING. Organizations: OPERNAME (CONTACT/OPERATOR)
, CBI SERVICES, INC. (CONTACT/OWNER)
CHAMPION BUILDING PRODUCTS (GOGAS ROAD in CORDOVA, AL)
(Resource Conservation and Recovery Act (tracking hazardous waste)) Business NAICS classification: HARDWOOD VENEER AND PLYWOOD MANUFACTURING. Organizations: OPERNAME (CONTACT/OPERATOR)
LYNN PARK TERMINAL INC. (RT#2 BOX 99 RIVER ROAD in CORDOVA, AL)
(Resource Conservation and Recovery Act (tracking hazardous waste)) Business NAICS classification: ALKALIES AND CHLORINE MANUFACTURING. Organizations: MARY MCNABB PHILLIPS (CONTACT/OWNER)
M AND M AUTOMOTIVE (6630 HWY 78 WEST in CORDOVA, AL)
National Pollutant Discharge Elimination System NON-MAJOR (Tracking pollutant discharge elimination systems) - permit Business SIC classification: MOTOR VEHICLE PARTS, USED
NICHOLAS MINE (REED MINING INC in CORDOVA, AL)
National Pollutant Discharge Elimination System NON-MAJOR (Tracking pollutant discharge elimination systems) - permit Business SIC classification: BITUMINOUS COAL AND LIGNITE SURFACE MINING Alternative names: REED MINING INC NICHOLAS MINE
AA FLUID POWER SERVICES INC (7044 HWY 78 in CORDOVA, AL)
Conditionally Exempt Small Quantity Generators, less than 100 kg/month of hazardous waste (Resource Conservation and Recovery Act (tracking hazardous waste)) Organizations: JAMES M LANGLEY (CONTACT/OPERATOR)
ADOT APD 0471 044 (ALABAMA DEPARTMENT OF TRANSPOR in CORDOVA, AL)
National Pollutant Discharge Elimination System NON-MAJOR (Tracking pollutant discharge elimination systems) - permit Business SIC classification: HIGHWAY AND STREET CONSTRUCTION, EXCEPT ELEVATED HIGHWAYS
ADOT APD 0471 516 (ALABAMA DEPARTMENT OF TRANSPOR in CORDOVA, AL)
National Pollutant Discharge Elimination System NON-MAJOR (Tracking pollutant discharge elimination systems) - permit Business SIC classification: HIGHWAY AND STREET CONSTRUCTION, EXCEPT ELEVATED HIGHWAYS
Housing units lacking complete plumbing facilities: 10.7% Housing units lacking complete kitchen facilities: 9.3%
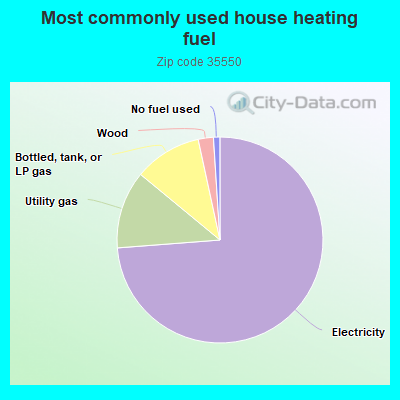
73.7%Electricity
12.2%Utility gas
10.6%Bottled, tank, or LP gas
2.4%Wood
1.0%No fuel used
Population in 1990: 5,273. Population change in the 1990s: +929 (+17.6%).
Place of birth for U.S.-born residents:
This state: 4,422
Northeast: 10
Midwest: 366
South: 315
West: 118
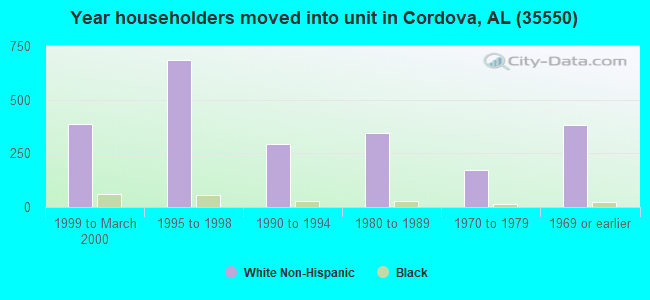
61% of the 35550 zip code residents lived in the same house 5 years ago. Out of people who lived in different houses, 78% lived in this county. Out of people who lived in different counties, 50% lived in Alabama.
92% of the 35550 zip code residents lived in the same house 1 year ago. Out of people who lived in different houses, 48% moved from this county. Out of people who lived in different houses, 49% moved from different county within same state. Out of people who lived in different houses, 2% moved from different state.
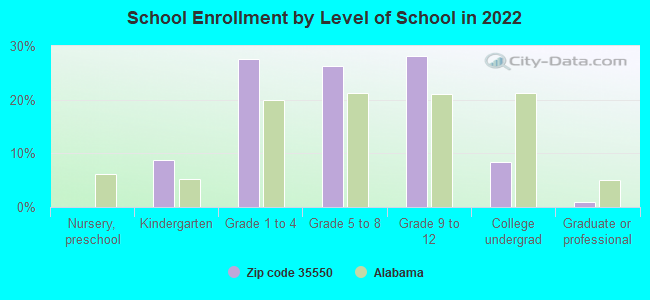
Private vs. public school enrollment:
Students in private schools in grades 1 to 8 (elementary and middle school):
Here:
0.0%
Alabama:
14.7%
Students in private schools in grades 9 to 12 (high school): 68
Here:
21.1%
Alabama:
16.3%
Students in private undergraduate colleges: 12
Here:
12.9%
Alabama:
14.6%
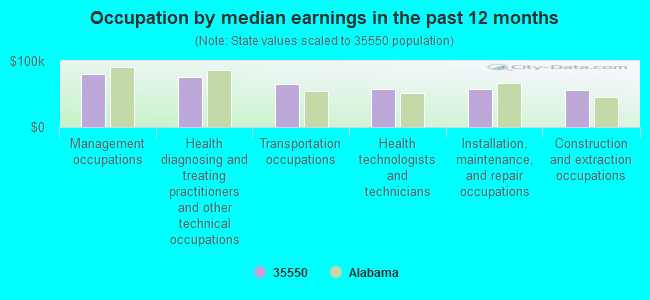
Occupation by median earnings in the past 12 months ($)
80,573Management occupations
76,234Health diagnosing and treating practitioners and other technical occupations
64,908Transportation occupations
57,815Health technologists and technicians
57,528Installation, maintenance, and repair occupations
56,301Construction and extraction occupations
Companies with federal contracts located in this zip code:
AUTOMATED VECHICLE SYSTEMS INT (366 NEW HOPE DR in CORDOVA, AL; small business) : $130,659 in 5 contractsfrom 2005 to 2006
Contracts for Miscellaneous Maintenance and Repair Shop Specialized Equipment, Drones, Maintenance, Repair and Rebuilding of Equipment -- Ground Effect Vehicles, Motor Vehicles, Trailers, and Cycles by Air Force Signed by year:2000: $0; 2001: $0; 2002: $0; 2003: $0; 2004: $0; 2005: $99,011; 2006: $31,648.
Biggest contracts:
$88,945 with Air Force for Miscellaneous Maintenance and Repair Shop Specialized Equipment. Signed on 2005-09-09. Completion date: 2005-11-01.
$27,898 with Air Force for Miscellaneous Maintenance and Repair Shop Specialized Equipment. Taking place in SC. Signed on 2006-06-09. Completion date: 2006-07-07.
$8,250 with Air Force for Drones. Signed on 2005-09-15. Completion date: 2005-10-14.
$3,750 with Air Force for Maintenance, Repair and Rebuilding of Equipment -- Ground Effect Vehicles, Motor Vehicles, Trailers, and Cycles. Taking place in FL. Signed on 2006-06-06. Completion date: 2006-07-31.
Top industries in this zip code by the number of employees in 2005:
2003 - 2018 National Fire Incident Reporting System (NFIRS) incidents
Based on the data from the years 2003 - 2018 the average number of fires per year is 16. The highest number of fire incidents - 48 took place in 2008, and the least - 2 in 2003. The data has a rising trend.
When looking into fire subcategories, the most incidents belonged to: Structure Fires (62.7%), and Outside Fires (23.9%).
Fire incident types reported to NFIRS in Zip Code 35550
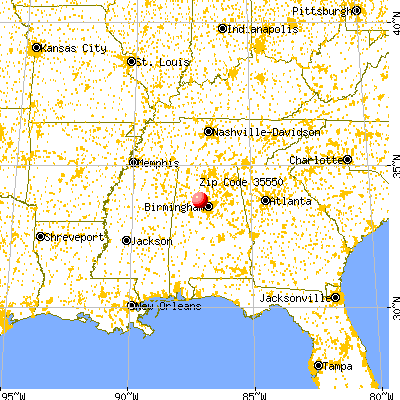


 Nearest zip codes: 35584, 35130, 35148, 35580, 35504, 35501.
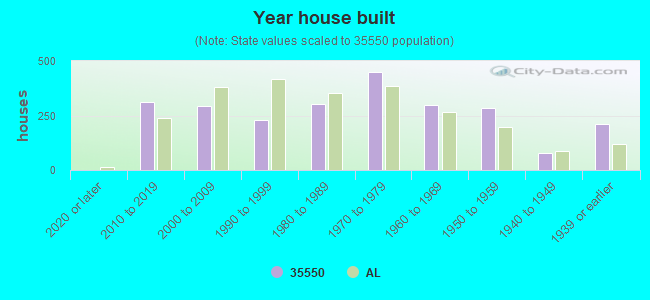


 Based on the data from the years 2003 - 2018 the average number of fires per year is 16. The highest number of fire incidents - 48 took place in 2008, and the least - 2 in 2003. The data has a rising trend.
 When looking into fire subcategories, the most incidents belonged to: Structure Fires (62.7%), and Outside Fires (23.9%).