Estimated zip code population in 2022: 3,200 Zip code population in 2010: 3,233 Zip code population in 2000: 3,971
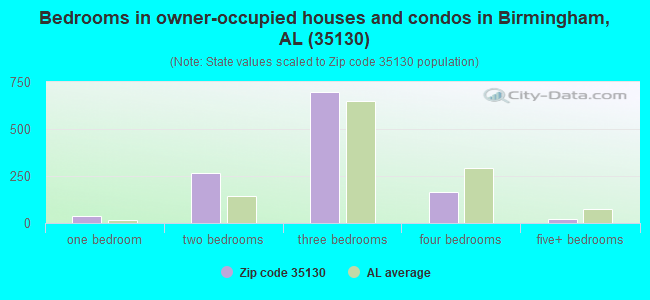
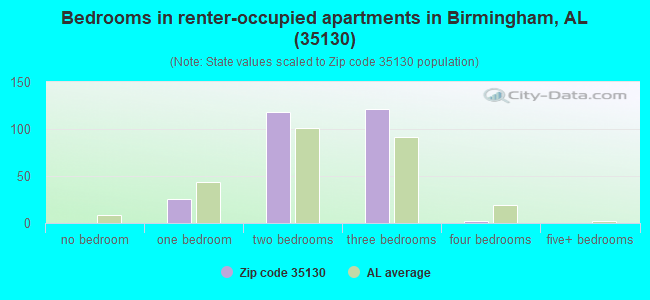
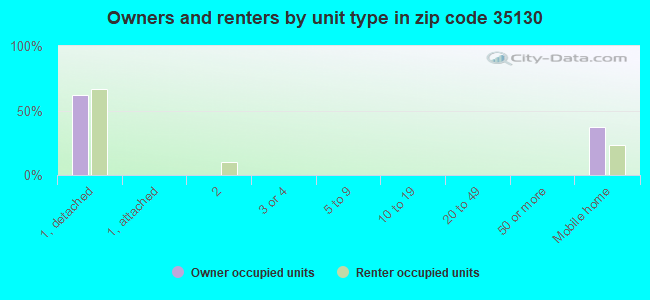
Houses and condos: 1,920 Renter-occupied apartments: 267
% of renters here:
18%
State:
30%
March 2022 cost of living index in zip code 35130: 80.0 (low, U.S. average is 100)
Land area: 67.4 sq. mi. Water area: 3.2 sq. mi.
Population density: 47 people per square mile
(very low).
OSM Map
General Map
Google Map
MSN Map
OSM Map
General Map
Google Map
MSN Map
OSM Map
General Map
Google Map
MSN Map
OSM Map
General Map
Google Map
MSN Map
Please wait while loading the map...
Real estate property taxes paid for housing units in 2022:
This zip code:
0.3% ($320)
Alabama:
0.4% ($718)
Median real estate property taxes paid for housing units with mortgages in 2022: $302 (0.2%) Median real estate property taxes paid for housing units with no mortgage in 2022: $324 (0.3%)
Business Search- 14 Million verified businesses
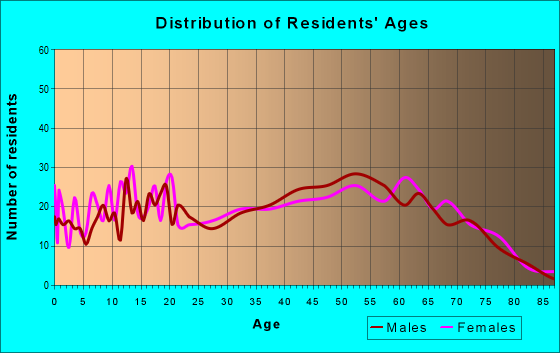
Males: 1,517
(47.4%)
Females: 1,682
(52.6%)
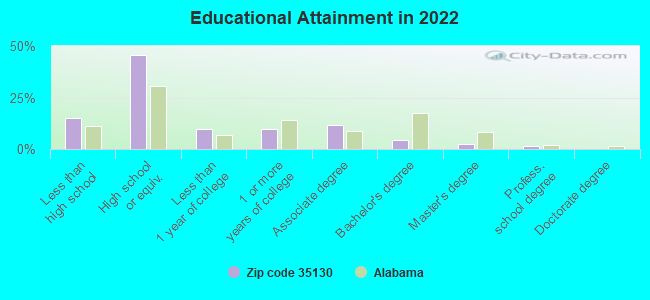
For population 25 years and over in 35130:
High school or higher: 83.5%
Bachelor's degree or higher: 8.1%
Graduate or professional degree: 3.9%
Unemployed: 6.1%
Mean travel time to work (commute): 34.5 minutes
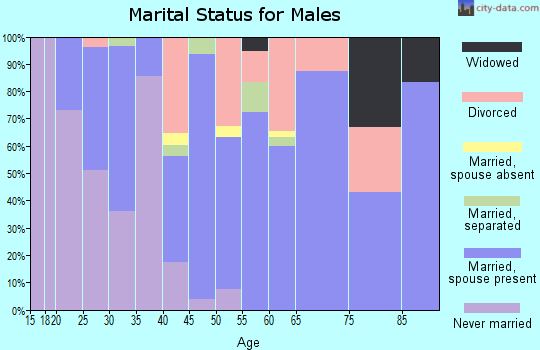
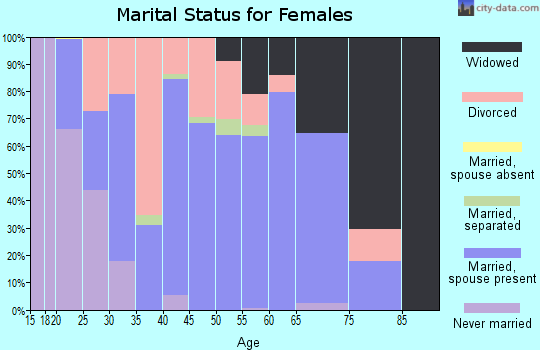
For population 15 years and over in 35130:
Never married: 25.0%
Now married: 41.0%
Separated: 1.3%
Widowed: 9.7%
Divorced: 23.0%
Zip code 35130 compared to state average:
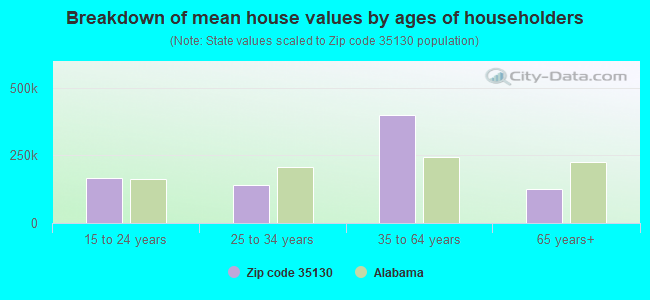
Median house value below state average.
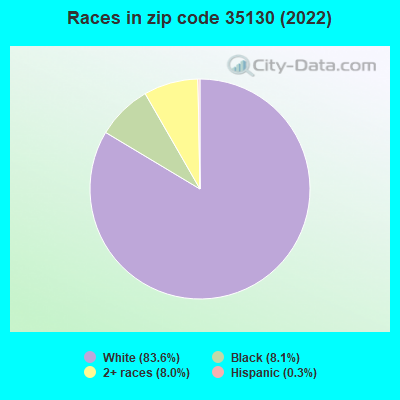
Black race population percentage significantly below state average.
Hispanic race population percentage significantly below state average.
Median age significantly above state average.
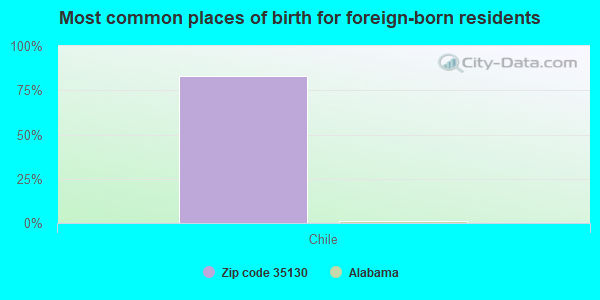
Foreign-born population percentage significantly below state average.
Renting percentage below state average.
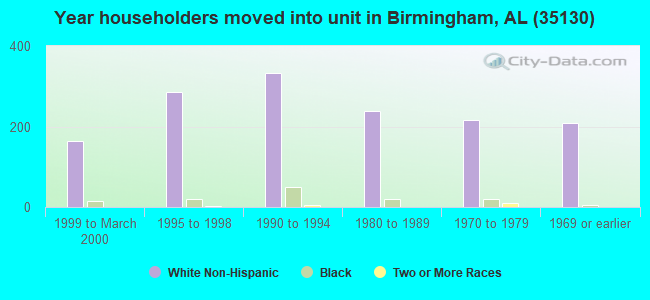
Length of stay since moving in significantly above state average.
Percentage of population with a bachelor's degree or higher significantly below state average.
Estimated median house/condo value in 2022: $121,279
35130:
$121,279
Alabama:
$200,900
According to our research of Alabama and other state lists, there were 8 registered sex offenders living in 35130 zip code as of April 27, 2024. The ratio of all residents to sex offenders in zip code 35130 is 372 to 1. The ratio of registered sex offenders to all residents in this zip code is near the state average.
Median resident age:
This zip code:
53.5 years
Alabama median age:
39.6 years
Average household size:
This zip code:
2.2 people
Alabama:
2.5 people
Averages for the 2020 tax year for zip code 35130, filed in 2021:
Average Adjusted Gross Income (AGI) in 2020: $46,643 (Individual Income Tax Returns)
Here:
$46,643
State:
$63,984
Salary/wage: $43,959 (reported on 81.5% of returns)
Here:
$43,959
State:
$52,834
(% of AGI for various income ranges: 1182.6% for AGIs below $25k, 3410.3% for AGIs $25k-50k, 6584.3% for AGIs $50k-75k, 9587.8% for AGIs $75k-100k, 17105.0% for AGIs $100k-200k)
Taxable interest for individuals: $600 (reported on 18.5% of returns)
This zip code:
$600
Alabama:
$1,615
(% of AGI for various income ranges: 8.7% for AGIs below $25k, 4.5% for AGIs $25k-50k, 31.4% for AGIs $50k-75k, 14.4% for AGIs $75k-100k, 50.0% for AGIs $100k-200k)
Ordinary dividends: $814 (reported on 5.4% of returns)
Here:
$814
State:
$7,660
(% of AGI for various income ranges: 9.7% for AGIs $25k-50k, 30.0% for AGIs $75k-100k)
Net capital gain/loss in AGI: +$500 (reported on 3.8% of returns)
Here:
+$500
State:
+$23,528
(% of AGI for various income ranges: 0.6% for AGIs $25k-50k, 25.6% for AGIs $75k-100k)
Profit/loss from business: +$4,325 (reported on 12.3% of returns)
Here:
+$4,325
State:
+$9,534
(% of AGI for various income ranges: 94.2% for AGIs below $25k, 81.0% for AGIs $25k-50k, 92.2% for AGIs $75k-100k)
Taxable individual retirement arrangement distribution: $12,650 (reported on 6.2% of returns)
35130:
$12,650
Alabama:
$19,004
(% of AGI for various income ranges: 46.3% for AGIs below $25k, 245.7% for AGIs $50k-75k, 615.0% for AGIs $100k-200k)
Total itemized deductions: $20,200 (reported on 2.3% of returns)
Here:
$20,200
State:
$37,338
(% of AGI for various income ranges: 432.9% for AGIs $50k-75k)
Taxes paid: $4,633 (reported on 2.3% of returns)
35130:
$4,633
State:
$6,484
(% of AGI for various income ranges: 99.3% for AGIs $50k-75k)
Earned income credit: $2,550 (reported on 21.5% of returns)
Here:
$2,550
State:
$2,628
(% of AGI for various income ranges: 125.0% for AGIs below $25k, 77.1% for AGIs $25k-50k)
Percentage of individuals using paid preparers for their 2020 taxes: 94.6%
Here:
95%
State:
93%
(% for various income ranges: 91.7% for AGIs below $25k, 97.3% for AGIs $25k-50k, 94.7% for AGIs $50k-75k, 100.0% for AGIs $75k-100k, 92.3% for AGIs $100k-200k)
Averages for the 2012 tax year for zip code 35130, filed in 2013:
Average Adjusted Gross Income (AGI) in 2012: $42,720 (Individual Income Tax Returns)
Here:
$42,720
State:
$52,001
Salary/wage: $41,057 (reported on 82.1% of returns)
Here:
$41,057
State:
$43,822
(% of AGI for various income ranges: 70.6% for AGIs below $25k, 78.8% for AGIs $25k-50k, 81.5% for AGIs $50k-75k, 82.2% for AGIs $75k-100k, 78.9% for AGIs $100k-200k)
Taxable interest for individuals: $713 (reported on 25.2% of returns)
This zip code:
$713
Alabama:
$1,592
(% of AGI for various income ranges: 1.0% for AGIs below $25k, 0.5% for AGIs $25k-50k, 0.4% for AGIs $50k-75k, 0.3% for AGIs $75k-100k, 0.2% for AGIs $100k-200k)
Ordinary dividends: $886 (reported on 5.7% of returns)
Here:
$886
State:
$5,697
Net capital gain/loss in AGI: +$67 (reported on 4.9% of returns)
Here:
+$67
State:
+$13,286
Profit/loss from business: +$9,454 (reported on 10.6% of returns)
Here:
+$9,454
State:
+$9,151
(% of AGI for various income ranges: 9.3% for AGIs below $25k, 1.7% for AGIs $25k-50k, 3.3% for AGIs $50k-75k)
Taxable individual retirement arrangement distribution: $9,378 (reported on 7.3% of returns)
35130:
$9,378
Alabama:
$14,992
(% of AGI for various income ranges: 2.5% for AGIs below $25k, 2.0% for AGIs $25k-50k, 3.9% for AGIs $50k-75k)
Total itemized deductions: $17,863 (24% of AGI, reported on 22.0% of returns)
Here:
$17,863
State:
$21,388
Here:
23.7% of AGI
State:
20.1% of AGI
(% of AGI for various income ranges: 6.8% for AGIs below $25k, 7.3% for AGIs $25k-50k, 7.4% for AGIs $50k-75k, 10.3% for AGIs $75k-100k, 12.7% for AGIs $100k-200k)
Charity contributions: $4,109 (reported on 18.7% of returns)
Here:
$4,109
State:
$5,925
(% of AGI for various income ranges: 0.8% for AGIs below $25k, 1.2% for AGIs $25k-50k, 1.6% for AGIs $50k-75k, 2.0% for AGIs $75k-100k, 2.8% for AGIs $100k-200k)
Taxes paid: $3,622 (reported on 22.0% of returns)
35130:
$3,622
State:
$5,272
(% of AGI for various income ranges: 0.7% for AGIs below $25k, 1.0% for AGIs $25k-50k, 1.5% for AGIs $50k-75k, 1.9% for AGIs $75k-100k, 3.4% for AGIs $100k-200k)
Earned income credit: $2,373 (reported on 26.8% of returns)
Here:
$2,373
State:
$2,646
(% of AGI for various income ranges: 8.7% for AGIs below $25k, 1.5% for AGIs $25k-50k)
Percentage of individuals using paid preparers for their 2012 taxes: 69.1%
Here:
69%
State:
60%
(% for various income ranges: 66.0% for AGIs below $25k, 63.3% for AGIs $25k-50k, 73.7% for AGIs $50k-75k, 81.8% for AGIs $75k-100k, 80.0% for AGIs $100k-200k)
Averages for the 2004 tax year for zip code 35130, filed in 2005:
Average Adjusted Gross Income (AGI) in 2004: $36,231 (Individual Income Tax Returns)
Here:
$36,231
State:
$42,302
Salary/wage: $34,551 (reported on 84.9% of returns)
Here:
$34,551
State:
$36,626
(% of AGI for various income ranges: 89.0% for AGIs below $10k, 75.7% for AGIs $10k-25k, 82.4% for AGIs $25k-50k, 87.1% for AGIs $50k-75k, 85.8% for AGIs $75k-100k, 57.5% for AGIs over 100k)
Taxable interest for individuals: $1,027 (reported on 31.8% of returns)
This zip code:
$1,027
Alabama:
$1,827
(% of AGI for various income ranges: 1.3% for AGIs below $10k, 1.5% for AGIs $10k-25k, 1.1% for AGIs $25k-50k, 0.7% for AGIs $50k-75k, 0.4% for AGIs $75k-100k, 0.8% for AGIs over 100k)
Taxable dividends: $1,264 (reported on 7.2% of returns)
Here:
$1,264
State:
$4,206
(% of AGI for various income ranges: 0.2% for AGIs $10k-25k, 0.1% for AGIs $25k-50k, 0.4% for AGIs $50k-75k, 0.1% for AGIs $75k-100k, 0.7% for AGIs over 100k)
Net capital gain/loss: +$6,926 (reported on 5.4% of returns)
Here:
+$6,926
State:
+$13,031
(% of AGI for various income ranges: 0.0% for AGIs $10k-25k, 0.2% for AGIs $25k-50k, -0.0% for AGIs $50k-75k, 5.5% for AGIs $75k-100k)
Profit/loss from business: +$5,929 (reported on 12.3% of returns)
Here:
+$5,929
State:
+$8,302
(% of AGI for various income ranges: 1.1% for AGIs below $10k, 6.2% for AGIs $10k-25k, 2.6% for AGIs $25k-50k, 1.2% for AGIs $50k-75k, 0.2% for AGIs $75k-100k)
IRA payment deduction: $2,688 (reported on 1.3% of returns)
35130:
$2,688
Alabama:
$3,006
Total itemized deductions: $13,431 (22% of AGI, reported on 23.6% of returns)
Here:
$13,431
State:
$17,623
Here:
22.0% of AGI
State:
20.8% of AGI
(% of AGI for various income ranges: 5.9% for AGIs $10k-25k, 8.0% for AGIs $25k-50k, 10.0% for AGIs $50k-75k, 10.8% for AGIs $75k-100k, 9.5% for AGIs over 100k)
Charity contributions deductions: $3,255 (5% of AGI, reported on 21.1% of returns)
Here:
$3,255
State:
$4,768
Here:
5.2% of AGI
State:
5.4% of AGI
(% of AGI for various income ranges: 1.2% for AGIs $10k-25k, 1.5% for AGIs $25k-50k, 2.2% for AGIs $50k-75k, 2.3% for AGIs $75k-100k, 3.0% for AGIs over 100k)
Total tax: $3,995 (reported on 72.1% of returns)
35130:
$3,995
State:
$6,905
(% of AGI for various income ranges: 2.3% for AGIs below $10k, 3.4% for AGIs $10k-25k, 5.7% for AGIs $25k-50k, 8.5% for AGIs $50k-75k, 10.2% for AGIs $75k-100k, 16.0% for AGIs over 100k)
Earned income credit: $1,857 (reported on 21.5% of returns)
Here:
$1,857
State:
$2,048
Percentage of individuals using paid preparers for their 2004 taxes: 71.2%
Here:
71%
State:
65%
(% for various income ranges: 60.7% for AGIs below $10k, 71.6% for AGIs $10k-25k, 73.3% for AGIs $25k-50k, 74.0% for AGIs $50k-75k, 77.9% for AGIs $75k-100k, 67.7% for AGIs over 100k)
Household received Food Stamps/SNAP in the past 12 months: 185 Household did not receive Food Stamps/SNAP in the past 12 months: 1,267
Women who had a birth in the past 12 months: 8 (9 now married, 0 unmarried) Women who did not have a birth in the past 12 months: 533 (228 now married, 305 unmarried)
Housing units in zip code 35130 with a mortgage: 353 (21 second mortgage, 22 both second mortgage and home equity loan) Median monthly owner costs for units with a mortgage: $996 Median monthly owner costs for units without a mortgage: $345
Residents with income below the poverty level in 2022:
This zip code:
20.5%
Whole state:
16.2%
Residents with income below 50% of the poverty level in 2022:
This zip code:
11.3%
Whole state:
8.6%
Median number of rooms in houses and condos:
Here:
5.9
State:
6.5
Median number of rooms in apartments:
Here:
5.3
State:
4.7
Notable locations in this zip code not listed on our city pages
Notable locations in zip code 35130: Winters Camp (A), Riverwood Lodge (B), Riverview Camp (C), Percy Vines Camp (D), Davis Camp (E), Fred Vines Camp (F), Bluff Creek Camp (G), Reeds Ferry Camp (H), West Jefferson Town Hall (I), West Jefferson Volunteer Fire Department (J), Yerkwood Volunteer Fire Department (K), Copeland Ferry Pumpkin Center Fire Department (L). Display/hide their locations on the map
Churches in zip code 35130 include: Oak Grove Church (A), Wyatt Station Baptist Church (B), Wegra Church (C), Calvary Church (D), Freewill Church (E), Pumpkin Center Church (F), Twilly Town Church (G), Lubaco Church (H), Pleasant Grove Church (I). Display/hide their locations on the map
Reservoirs: Tailings Pond Number 2 (A), Miller Steam Plant Water Storagep (B), Rattlesnake Lake (C), West Jefferson Reservoir (D). Display/hide their locations on the map
Streams, rivers, and creeks: Big Lick Creek (A), Jones Creek (B), Prescott Creek (C), Miller Slough (D), Skelton Creek (E), Rattlesnake Creek (F), Horse Creek (G), Falls Creek (H), Coal Creek (I). Display/hide their locations on the map
Size of family households: 366 2-persons, 224 3-persons, 70 4-persons, 27 5-persons, 10 6-persons, 39 7-or-more-persons
Size of nonfamily households: 533 1-person, 188 2-persons
202 married couples with children.
81 single-parent households (22 men, 59 women).
100.3% of residents of 35130 zip code speak English at home.
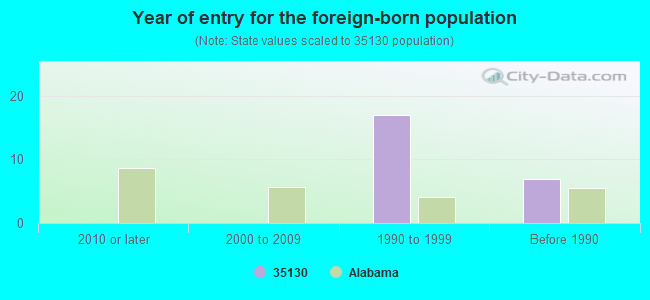
Foreign born population: 12 (0.4%) (100.0% of them are naturalized citizens)
This zip code:
0.4%
Whole state:
3.8%
83%Chile
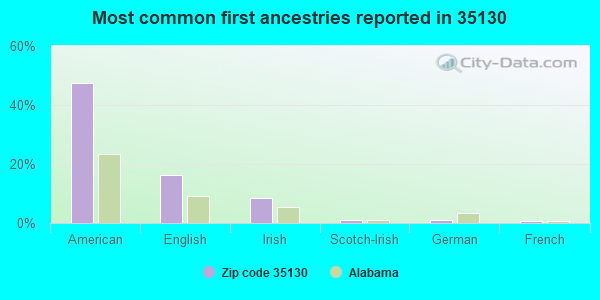
47%American
16%English
9%Irish
1%Scotch-Irish
1%German
1%French
0%Slovak
Year of entry for the foreign-born population
02010 or later
02000 to 2009
171990 to 1999
7Before 1990
Facilities with environmental interests located in this zip code:
ALABAMA POWER COMPANY JH MILLER STEAM ELECTRIC PLANT (4250 PORTER ROAD in QUINTON, AL)
AIR MAJOR (AIRS/AFS) AIR PROGRAM (Clean Air Markets Division Business System) OIL CONTROL (Facility Response Plan for oil discharge) (Integrated Compliance Information System) - ICIS-04-2000-0099, FORMAL ENFORCEMENT ACTION CRITERIA AND HAZARDOUS AIR POLLUTANT INVENTORY (Inventory of air pollution sources) National Pollutant Discharge Elimination System MAJOR (Tracking pollutant discharge elimination systems) - permit STATE MASTER (PERMIT TRACKING) Conditionally Exempt Small Quantity Generators, less than 100 kg/month of hazardous waste (Resource Conservation and Recovery Act (tracking hazardous waste)) - notification USED OIL PROGRAM (Resource Conservation and Recovery Act (tracking hazardous waste)) TRI REPORTER (Tracking of toxic chemicals releasing facilities) Business SIC classification: ELECTRIC SERVICES Business NAICS classification: FOSSIL FUEL ELECTRIC POWER GENERATION. Organizations: ALABAMA ELECTRIC COOPERATIVE, INC. (CONTACT/OWNER)
Alternative names: ALABAMA POWER COMPANY J H MILLER STEAM ELECTRIC PLANT, ALABAMA PWR CO-MILLER PLT, ALABAMA POWER COMPANY (MILLER POWER PLAN, ALABAMA POWER CO. MILLER STEAM PLANT, ALABAMA POWER CO. - PLANT MILLER, ALABAMA POWER-MILLER STEAM PLT, AL POWER CO MILLER STEAM PLT, ALABAMA POWER CO. MILLER STEAM PLANT, ALABAMA POWER-MILLER STEAM PLT, J.H. MILLER, JR. STEAM PLANT , JAMES H MILLER JR
QUINTON MINE (QUINTON MINING LLC in QUINTON, AL)
National Pollutant Discharge Elimination System NON-MAJOR (Tracking pollutant discharge elimination systems) - permit Business SIC classification: NONCLASSIFIABLE ESTABLISHMENTS Alternative names: HORSE CK MINING QUINTON MINE
READY MIX USA QUINTON PLANT (READY MIX USA LLC in QUINTON, AL)
National Pollutant Discharge Elimination System NON-MAJOR (Tracking pollutant discharge elimination systems) - permit Business SIC classification: READY-MIXED CONCRETE
QUINTON SITE (RACON INC in QUINTON, AL)
National Pollutant Discharge Elimination System NON-MAJOR (Tracking pollutant discharge elimination systems) - permit Business SIC classification: HIGHWAY AND STREET CONSTRUCTION, EXCEPT ELEVATED HIGHWAYS Alternative names: RACON INC QUINTON SITE
PACIFICORP SYN FUEL (ROUTE 269 in JASPER, AL)
AIR SYNTHETIC MINOR (AIRS/AFS) Business SIC classification: NONMETALLIC MINERAL PRODUCTS
Housing units lacking complete plumbing facilities: 14.6% Housing units lacking complete kitchen facilities: 15.3%
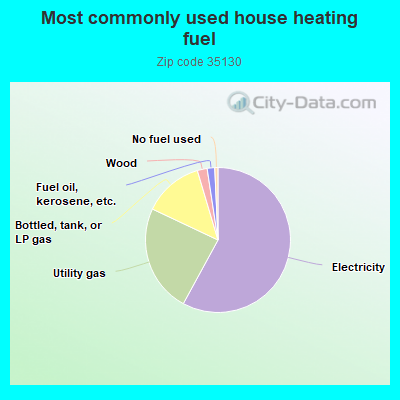
58.0%Electricity
24.1%Utility gas
13.4%Bottled, tank, or LP gas
2.2%Wood
1.7%Fuel oil, kerosene, etc.
0.7%No fuel used
Population in 1990: 2,198. Population change in the 1990s: +1,773 (+80.7%).
Place of birth for U.S.-born residents:
This state: 2,768
Midwest: 88
South: 220
West: 68
72% of the 35130 zip code residents lived in the same house 5 years ago. Out of people who lived in different houses, 55% lived in this county. Out of people who lived in different counties, 50% lived in Alabama.
93% of the 35130 zip code residents lived in the same house 1 year ago. Out of people who lived in different houses, 36% moved from this county. Out of people who lived in different houses, 55% moved from different county within same state. Out of people who lived in different houses, 4% moved from different state. Out of people who lived in different houses, 6% moved from abroad.
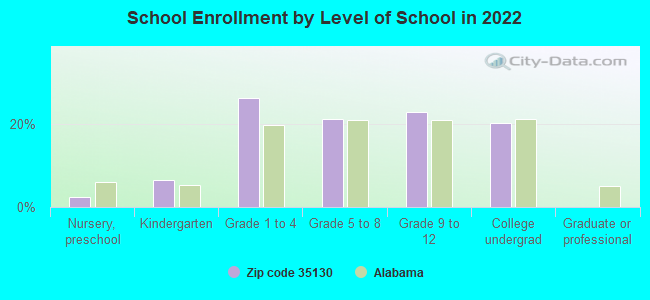
Private vs. public school enrollment:
Students in private schools in grades 1 to 8 (elementary and middle school): 3
Here:
1.1%
Alabama:
14.7%
Students in private schools in grades 9 to 12 (high school):
Here:
0.0%
Alabama:
16.3%
Students in private undergraduate colleges: 113
Here:
80.0%
Alabama:
14.6%
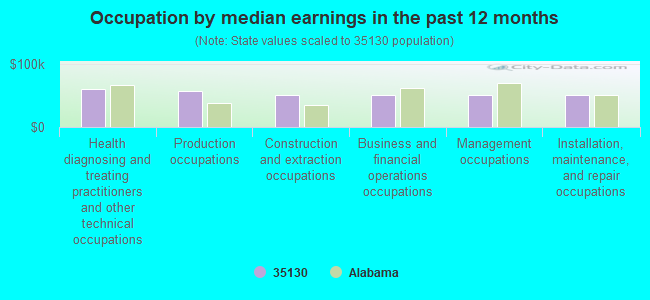
Occupation by median earnings in the past 12 months ($)
60,227Health diagnosing and treating practitioners and other technical occupations
57,407Production occupations
50,962Construction and extraction occupations
50,370Business and financial operations occupations
50,288Management occupations
50,027Installation, maintenance, and repair occupations
Top industries in this zip code by the number of employees in 2005:
Utilities: Electric Power Distribution (250-499 employees: 1 establishment, 20-49 employees: 1 establishment)
Administrative and Support and Waste Management and Remediation Services: Document Preparation Services (10-19: 1)
Other Services (except Public Administration): Commercial and Industrial Machinery and Equipment (except Automotive and Electronic) Repair and Maintenance (5-9: 1, 1-4: 2)
Other Services (except Public Administration): Religious Organizations (5-9: 1, 1-4: 1)
Wholesale Trade: Other Miscellaneous Durable Goods Merchant Wholesalers (5-9: 1)
Wholesale Trade: Brick, Stone, and Related Construction Material Merchant Wholesalers (5-9: 1)
Construction: Plumbing, Heating, and Air-Conditioning Contractors (1-4: 2)
Fatal accident statistics in 2012:
Fatal accident count: 1
Vehicles involved in fatal accidents: 1
Fatal accidents caused by drunken drivers: 0
Fatalities: 1
Persons involved in fatal accidents: 1
Pedestrians involved in fatal accidents: 0
Fatal accident statistics in 2011:
Fatal accident count: 2
Vehicles involved in fatal accidents: 4
Fatal accidents caused by drunken drivers: 0
Fatalities: 4
Persons involved in fatal accidents: 7
Pedestrians involved in fatal accidents: 0
Home Mortgage Disclosure Act Aggregated Statistics For Year 2009 (Based on 4 partial tracts)
A) FHA, FSA/RHS & VA Home Purchase Loans
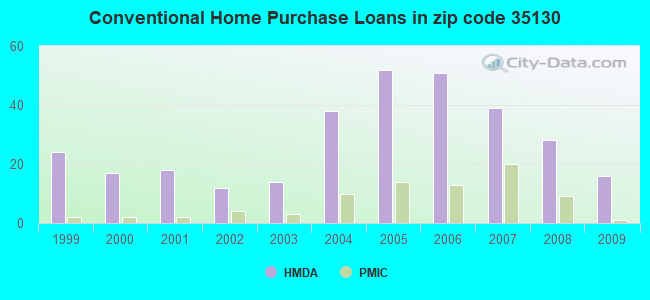
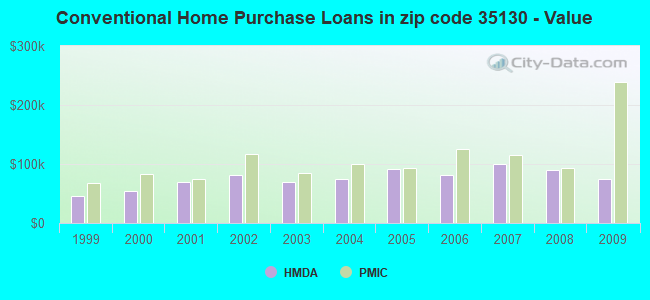
B) Conventional Home Purchase Loans
C) Refinancings
D) Home Improvement Loans
F) Non-occupant Loans on < 5 Family Dwellings (A B C & D)
G) Loans On Manufactured Home Dwelling (A B C & D)
Number
Average Value
Number
Average Value
Number
Average Value
Number
Average Value
Number
Average Value
Number
Average Value
LOANS ORIGINATED
9
$123,920
16
$74,753
45
$124,198
5
$25,508
11
$64,436
8
$40,259
APPLICATIONS APPROVED, NOT ACCEPTED
1
$160,740
3
$39,497
4
$165,985
3
$30,957
1
$41,490
1
$85,620
APPLICATIONS DENIED
5
$99,294
13
$56,442
29
$127,101
2
$77,590
2
$70,845
7
$43,780
APPLICATIONS WITHDRAWN
5
$106,778
3
$46,630
24
$121,457
2
$76,885
3
$67,953
0
$0
FILES CLOSED FOR INCOMPLETENESS
1
$86,950
0
$0
8
$135,259
1
$53,710
0
$0
0
$0
Aggregated Statistics For Year 2008 (Based on 4 partial tracts)
A) FHA, FSA/RHS & VA Home Purchase Loans
B) Conventional Home Purchase Loans
C) Refinancings
D) Home Improvement Loans
F) Non-occupant Loans on < 5 Family Dwellings (A B C & D)
G) Loans On Manufactured Home Dwelling (A B C & D)
Number
Average Value
Number
Average Value
Number
Average Value
Number
Average Value
Number
Average Value
Number
Average Value
LOANS ORIGINATED
14
$121,319
28
$90,447
48
$104,438
11
$44,325
12
$80,484
11
$49,847
APPLICATIONS APPROVED, NOT ACCEPTED
3
$73,223
9
$119,297
10
$100,144
1
$5,640
1
$36,660
9
$64,020
APPLICATIONS DENIED
4
$74,808
14
$61,241
43
$110,762
18
$36,961
3
$98,780
19
$50,339
APPLICATIONS WITHDRAWN
2
$62,565
4
$72,998
18
$136,515
1
$120,180
2
$108,350
1
$65,080
FILES CLOSED FOR INCOMPLETENESS
0
$0
2
$63,755
6
$134,448
0
$0
1
$52,270
0
$0
Aggregated Statistics For Year 2007 (Based on 4 partial tracts)
A) FHA, FSA/RHS & VA Home Purchase Loans
B) Conventional Home Purchase Loans
C) Refinancings
D) Home Improvement Loans
E) Loans on Dwellings For 5+ Families
F) Non-occupant Loans on < 5 Family Dwellings (A B C & D)
G) Loans On Manufactured Home Dwelling (A B C & D)
Number
Average Value
Number
Average Value
Number
Average Value
Number
Average Value
Number
Average Value
Number
Average Value
Number
Average Value
LOANS ORIGINATED
5
$90,524
39
$99,944
44
$102,456
8
$35,021
1
$4,400
7
$41,774
12
$44,410
APPLICATIONS APPROVED, NOT ACCEPTED
1
$103,350
4
$62,042
14
$70,633
2
$21,540
0
$0
2
$73,175
3
$61,527
APPLICATIONS DENIED
5
$61,482
11
$65,170
32
$78,821
13
$39,493
0
$0
2
$50,815
13
$49,014
APPLICATIONS WITHDRAWN
0
$0
4
$104,370
13
$101,328
3
$68,183
0
$0
1
$96,060
1
$43,200
FILES CLOSED FOR INCOMPLETENESS
1
$49,640
1
$60,510
8
$109,782
1
$6,740
0
$0
0
$0
0
$0
Aggregated Statistics For Year 2006 (Based on 4 partial tracts)
A) FHA, FSA/RHS & VA Home Purchase Loans
B) Conventional Home Purchase Loans
C) Refinancings
D) Home Improvement Loans
F) Non-occupant Loans on < 5 Family Dwellings (A B C & D)
G) Loans On Manufactured Home Dwelling (A B C & D)
Number
Average Value
Number
Average Value
Number
Average Value
Number
Average Value
Number
Average Value
Number
Average Value
LOANS ORIGINATED
4
$128,972
51
$81,164
53
$97,467
20
$20,816
9
$62,690
16
$40,586
APPLICATIONS APPROVED, NOT ACCEPTED
1
$107,300
18
$63,288
17
$81,859
3
$46,820
2
$63,840
12
$49,090
APPLICATIONS DENIED
3
$67,643
20
$67,798
42
$85,234
14
$33,126
3
$59,727
15
$50,491
APPLICATIONS WITHDRAWN
1
$196,400
12
$99,587
21
$113,235
3
$76,167
2
$108,370
1
$73,870
FILES CLOSED FOR INCOMPLETENESS
0
$0
2
$90,270
9
$102,707
1
$48,620
0
$0
0
$0
Aggregated Statistics For Year 2005 (Based on 4 partial tracts)
A) FHA, FSA/RHS & VA Home Purchase Loans
B) Conventional Home Purchase Loans
C) Refinancings
D) Home Improvement Loans
F) Non-occupant Loans on < 5 Family Dwellings (A B C & D)
G) Loans On Manufactured Home Dwelling (A B C & D)
Number
Average Value
Number
Average Value
Number
Average Value
Number
Average Value
Number
Average Value
Number
Average Value
LOANS ORIGINATED
4
$128,438
52
$90,701
51
$88,173
16
$32,795
10
$60,001
15
$50,280
APPLICATIONS APPROVED, NOT ACCEPTED
1
$165,940
14
$56,888
21
$98,737
1
$16,990
2
$44,385
5
$63,094
APPLICATIONS DENIED
0
$0
24
$47,773
47
$88,462
16
$19,878
5
$45,392
22
$41,911
APPLICATIONS WITHDRAWN
1
$99,970
12
$112,429
31
$99,204
5
$139,916
3
$143,177
6
$56,350
FILES CLOSED FOR INCOMPLETENESS
1
$62,960
3
$59,843
12
$130,728
1
$70,880
0
$0
0
$0
Aggregated Statistics For Year 2004 (Based on 4 partial tracts)
A) FHA, FSA/RHS & VA Home Purchase Loans
B) Conventional Home Purchase Loans
C) Refinancings
D) Home Improvement Loans
F) Non-occupant Loans on < 5 Family Dwellings (A B C & D)
G) Loans On Manufactured Home Dwelling (A B C & D)
Number
Average Value
Number
Average Value
Number
Average Value
Number
Average Value
Number
Average Value
Number
Average Value
LOANS ORIGINATED
2
$85,895
38
$74,913
72
$90,268
13
$27,681
7
$70,473
23
$41,206
APPLICATIONS APPROVED, NOT ACCEPTED
0
$0
10
$55,827
25
$76,090
2
$32,805
1
$41,030
9
$53,057
APPLICATIONS DENIED
1
$81,830
22
$50,329
61
$85,136
23
$28,384
2
$45,960
26
$41,025
APPLICATIONS WITHDRAWN
0
$0
8
$86,399
24
$99,157
4
$52,692
1
$84,380
3
$46,100
FILES CLOSED FOR INCOMPLETENESS
0
$0
2
$106,135
17
$103,589
0
$0
0
$0
1
$37,140
Aggregated Statistics For Year 2003 (Based on 2 partial tracts)
A) FHA, FSA/RHS & VA Home Purchase Loans
B) Conventional Home Purchase Loans
C) Refinancings
D) Home Improvement Loans
F) Non-occupant Loans on < 5 Family Dwellings (A B C & D)
Number
Average Value
Number
Average Value
Number
Average Value
Number
Average Value
Number
Average Value
LOANS ORIGINATED
2
$65,300
14
$69,159
55
$94,008
6
$20,883
1
$54,980
APPLICATIONS APPROVED, NOT ACCEPTED
0
$0
2
$69,860
9
$77,514
1
$9,200
1
$13,540
APPLICATIONS DENIED
0
$0
8
$53,250
26
$84,571
8
$21,130
0
$0
APPLICATIONS WITHDRAWN
1
$58,280
3
$53,177
17
$85,586
1
$119,550
0
$0
FILES CLOSED FOR INCOMPLETENESS
0
$0
1
$28,750
3
$77,897
0
$0
1
$44,270
Aggregated Statistics For Year 2002 (Based on 2 partial tracts)
A) FHA, FSA/RHS & VA Home Purchase Loans
B) Conventional Home Purchase Loans
C) Refinancings
D) Home Improvement Loans
F) Non-occupant Loans on < 5 Family Dwellings (A B C & D)
Number
Average Value
Number
Average Value
Number
Average Value
Number
Average Value
Number
Average Value
LOANS ORIGINATED
3
$101,803
12
$82,150
38
$84,548
6
$31,595
1
$28,480
APPLICATIONS APPROVED, NOT ACCEPTED
0
$0
6
$57,088
5
$71,848
1
$11,790
1
$36,790
APPLICATIONS DENIED
1
$47,210
12
$40,882
16
$75,320
4
$28,875
3
$23,573
APPLICATIONS WITHDRAWN
0
$0
2
$105,760
7
$80,559
0
$0
1
$48,380
FILES CLOSED FOR INCOMPLETENESS
0
$0
0
$0
3
$78,337
0
$0
0
$0
Aggregated Statistics For Year 2001 (Based on 2 partial tracts)
A) FHA, FSA/RHS & VA Home Purchase Loans
B) Conventional Home Purchase Loans
C) Refinancings
D) Home Improvement Loans
F) Non-occupant Loans on < 5 Family Dwellings (A B C & D)
Number
Average Value
Number
Average Value
Number
Average Value
Number
Average Value
Number
Average Value
LOANS ORIGINATED
5
$73,536
18
$69,646
38
$76,891
13
$15,525
5
$32,870
APPLICATIONS APPROVED, NOT ACCEPTED
0
$0
5
$41,596
4
$66,882
1
$4,940
1
$35,720
APPLICATIONS DENIED
0
$0
16
$38,576
18
$65,188
3
$32,427
1
$10,660
APPLICATIONS WITHDRAWN
0
$0
3
$55,573
11
$77,809
0
$0
0
$0
FILES CLOSED FOR INCOMPLETENESS
0
$0
0
$0
3
$78,840
1
$12,260
0
$0
Aggregated Statistics For Year 2000 (Based on 2 partial tracts)
A) FHA, FSA/RHS & VA Home Purchase Loans
B) Conventional Home Purchase Loans
C) Refinancings
D) Home Improvement Loans
F) Non-occupant Loans on < 5 Family Dwellings (A B C & D)
Number
Average Value
Number
Average Value
Number
Average Value
Number
Average Value
Number
Average Value
LOANS ORIGINATED
1
$105,810
17
$54,847
13
$62,484
9
$14,251
2
$19,960
APPLICATIONS APPROVED, NOT ACCEPTED
2
$52,145
6
$51,648
2
$48,430
2
$22,230
0
$0
APPLICATIONS DENIED
1
$46,900
34
$35,419
11
$45,473
5
$6,638
1
$38,140
APPLICATIONS WITHDRAWN
2
$34,335
1
$69,470
8
$55,560
0
$0
1
$17,940
FILES CLOSED FOR INCOMPLETENESS
0
$0
1
$15,250
2
$61,040
0
$0
1
$13,490
Aggregated Statistics For Year 1999 (Based on 2 partial tracts)
A) FHA, FSA/RHS & VA Home Purchase Loans
B) Conventional Home Purchase Loans
C) Refinancings
D) Home Improvement Loans
F) Non-occupant Loans on < 5 Family Dwellings (A B C & D)
2004 - 2018 National Fire Incident Reporting System (NFIRS) incidents
According to the data from the years 2004 - 2018 the average number of fire incidents per year is 9. The highest number of reported fire incidents - 24 took place in 2006, and the least - 1 in 2004. The data has a rising trend.
When looking into fire subcategories, the most reports belonged to: Outside Fires (46.6%), and Structure Fires (33.8%).
Fire incident types reported to NFIRS in Zip Code 35130
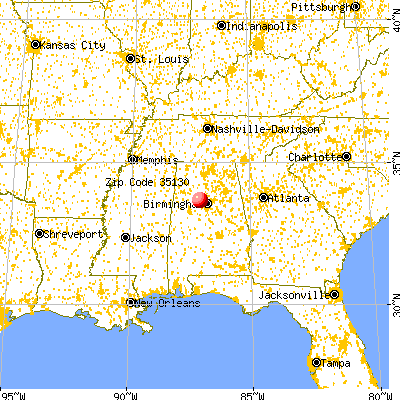


 Nearest zip codes: 35550, 35580, 35118, 35005, 35073, 35148.


 According to the data from the years 2004 - 2018 the average number of fire incidents per year is 9. The highest number of reported fire incidents - 24 took place in 2006, and the least - 1 in 2004. The data has a rising trend.
 When looking into fire subcategories, the most reports belonged to: Outside Fires (46.6%), and Structure Fires (33.8%).