Estimated zip code population in 2022: 7,532 Zip code population in 2010: 9,589 Zip code population in 2000: 9,528
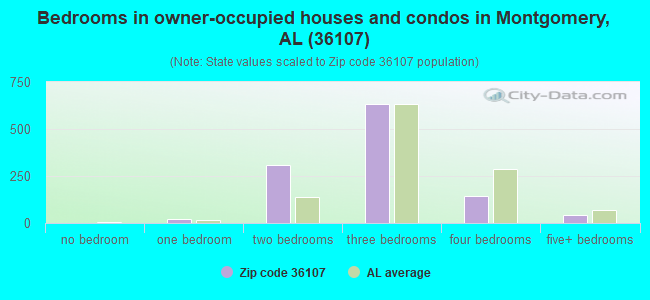
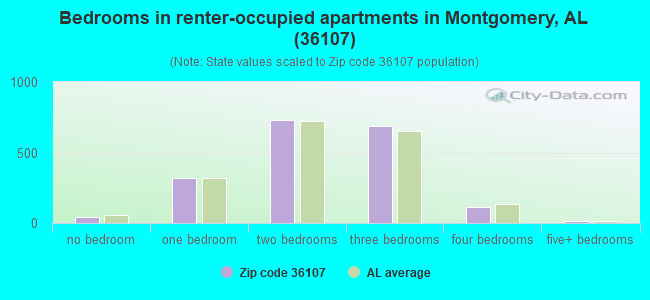
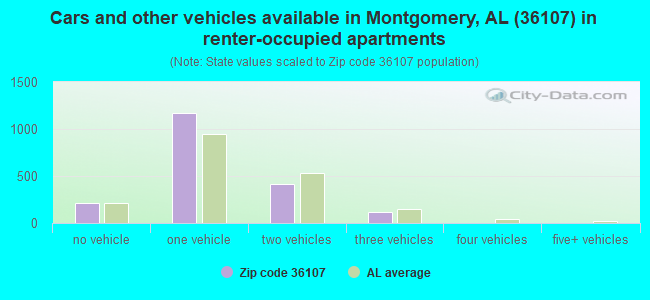
Houses and condos: 4,042 Renter-occupied apartments: 1,910
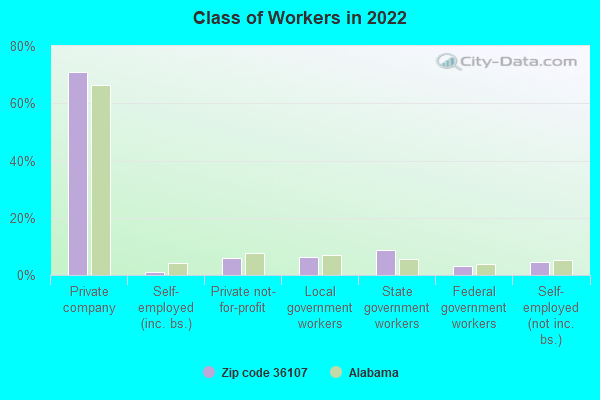
% of renters here:
62%
State:
30%
March 2022 cost of living index in zip code 36107: 83.9 (less than average, U.S. average is 100)
Land area: 3.2 sq. mi. Water area: 0.0 sq. mi.
Population density: 2,328 people per square mile
(low).
OSM Map
General Map
Google Map
MSN Map
OSM Map
General Map
Google Map
MSN Map
OSM Map
General Map
Google Map
MSN Map
OSM Map
General Map
Google Map
MSN Map
Please wait while loading the map...
Real estate property taxes paid for housing units in 2022:
This zip code:
0.5% ($362)
Alabama:
0.4% ($718)
Median real estate property taxes paid for housing units with mortgages in 2022: $479 (0.5%) Median real estate property taxes paid for housing units with no mortgage in 2022: $250 (0.4%)
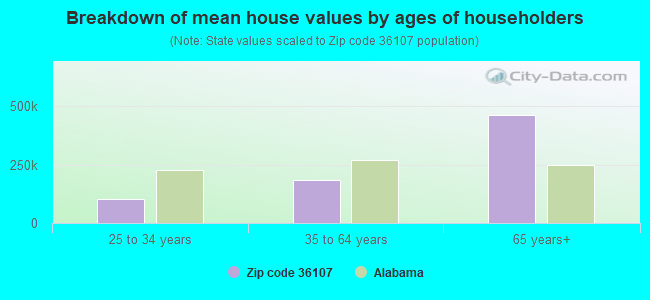
Estimated median house/condo value in 2022: $79,957
36107:
$79,957
Alabama:
$200,900
According to our research of Alabama and other state lists, there were 10 registered sex offenders living in 36107 zip code as of April 27, 2024. The ratio of all residents to sex offenders in zip code 36107 is 739 to 1. The ratio of registered sex offenders to all residents in this zip code is lower than the state average.
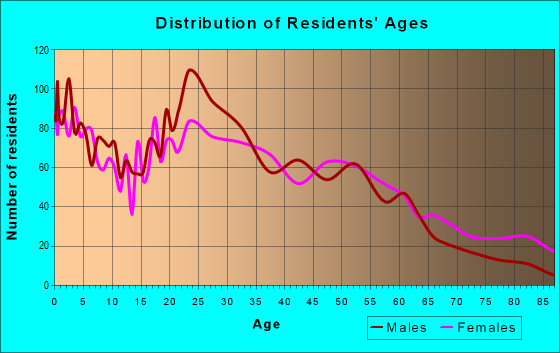
Median resident age:
This zip code:
34.3 years
Alabama median age:
39.6 years
Average household size:
This zip code:
2.3 people
Alabama:
2.5 people
Averages for the 2020 tax year for zip code 36107, filed in 2021:
Average Adjusted Gross Income (AGI) in 2020: $30,480 (Individual Income Tax Returns)
Here:
$30,480
State:
$63,984
Salary/wage: $27,324 (reported on 87.0% of returns)
Here:
$27,324
State:
$52,834
(% of AGI for various income ranges: 1249.8% for AGIs below $25k, 3909.7% for AGIs $25k-50k, 7635.3% for AGIs $50k-75k, 9812.9% for AGIs $75k-100k, 23543.3% for AGIs $100k-200k)
Taxable interest for individuals: $612 (reported on 10.7% of returns)
This zip code:
$612
Alabama:
$1,615
(% of AGI for various income ranges: 2.0% for AGIs below $25k, 7.6% for AGIs $25k-50k, 35.9% for AGIs $50k-75k, 18.6% for AGIs $75k-100k, 140.0% for AGIs $100k-200k)
Ordinary dividends: $2,269 (reported on 4.3% of returns)
Here:
$2,269
State:
$7,660
(% of AGI for various income ranges: 2.1% for AGIs below $25k, 3.9% for AGIs $25k-50k, 16.5% for AGIs $50k-75k, 52.9% for AGIs $75k-100k, 580.0% for AGIs $100k-200k)
Net capital gain/loss in AGI: +$2,191 (reported on 3.7% of returns)
Here:
+$2,191
State:
+$23,528
(% of AGI for various income ranges: 0.8% for AGIs below $25k, 4.1% for AGIs $25k-50k, 38.2% for AGIs $50k-75k, 453.3% for AGIs $100k-200k)
Profit/loss from business: +$7,506 (reported on 15.7% of returns)
Here:
+$7,506
State:
+$9,534
(% of AGI for various income ranges: 98.7% for AGIs below $25k, 73.0% for AGIs $25k-50k, 117.6% for AGIs $50k-75k, 5056.7% for AGIs $100k-200k)
Taxable individual retirement arrangement distribution: $8,629 (reported on 2.3% of returns)
36107:
$8,629
Alabama:
$19,004
(% of AGI for various income ranges: 8.2% for AGIs below $25k, 30.0% for AGIs $25k-50k, 167.1% for AGIs $50k-75k)
Total itemized deductions: $23,157 (reported on 2.3% of returns)
Here:
$23,157
State:
$37,338
(% of AGI for various income ranges: 110.4% for AGIs $25k-50k, 1195.7% for AGIs $75k-100k)
Charity contributions: $13,940 (reported on 1.7% of returns)
Here:
$13,940
State:
$18,005
(% of AGI for various income ranges: 45.5% for AGIs $25k-50k, 534.3% for AGIs $75k-100k)
Taxes paid: $3,817 (reported on 2.0% of returns)
36107:
$3,817
State:
$6,484
(% of AGI for various income ranges: 9.2% for AGIs $25k-50k, 234.3% for AGIs $75k-100k)
Earned income credit: $2,965 (reported on 37.8% of returns)
Here:
$2,965
State:
$2,628
(% of AGI for various income ranges: 197.9% for AGIs below $25k, 106.8% for AGIs $25k-50k)
Percentage of individuals using paid preparers for their 2020 taxes: 89.6%
Here:
90%
State:
93%
(% for various income ranges: 91.2% for AGIs below $25k, 87.5% for AGIs $25k-50k, 88.5% for AGIs $50k-75k, 90.0% for AGIs $75k-100k, 87.5% for AGIs $100k-200k)
Averages for the 2012 tax year for zip code 36107, filed in 2013:
Average Adjusted Gross Income (AGI) in 2012: $26,222 (Individual Income Tax Returns)
Here:
$26,222
State:
$52,001
Salary/wage: $24,161 (reported on 87.6% of returns)
Here:
$24,161
State:
$43,822
(% of AGI for various income ranges: 84.6% for AGIs below $25k, 86.9% for AGIs $25k-50k, 81.9% for AGIs $50k-75k, 82.1% for AGIs $75k-100k, 44.1% for AGIs $100k-200k)
Taxable interest for individuals: $921 (reported on 10.5% of returns)
This zip code:
$921
Alabama:
$1,592
(% of AGI for various income ranges: 0.2% for AGIs below $25k, 0.3% for AGIs $25k-50k, 0.2% for AGIs $50k-75k, 0.4% for AGIs $75k-100k, 1.4% for AGIs $100k-200k)
Ordinary dividends: $5,022 (reported on 4.9% of returns)
Here:
$5,022
State:
$5,697
(% of AGI for various income ranges: 0.7% for AGIs below $25k, 1.6% for AGIs $25k-50k, 0.3% for AGIs $50k-75k, 1.5% for AGIs $75k-100k)
Net capital gain/loss in AGI: +$2,460 (reported on 2.7% of returns)
Here:
+$2,460
State:
+$13,286
Profit/loss from business: +$6,545 (reported on 13.8% of returns)
Here:
+$6,545
State:
+$9,151
(% of AGI for various income ranges: 8.1% for AGIs below $25k, 1.1% for AGIs $25k-50k, 1.5% for AGIs $50k-75k, 1.2% for AGIs $75k-100k)
Taxable individual retirement arrangement distribution: $5,242 (reported on 3.2% of returns)
36107:
$5,242
Alabama:
$14,992
(% of AGI for various income ranges: 0.6% for AGIs below $25k, 0.6% for AGIs $25k-50k, 1.9% for AGIs $50k-75k)
Total itemized deductions: $14,236 (26% of AGI, reported on 11.4% of returns)
Here:
$14,236
State:
$21,388
Here:
26.2% of AGI
State:
20.1% of AGI
(% of AGI for various income ranges: 3.9% for AGIs below $25k, 7.0% for AGIs $25k-50k, 7.8% for AGIs $50k-75k, 7.7% for AGIs $75k-100k, 7.6% for AGIs $100k-200k)
Charity contributions: $4,503 (reported on 9.2% of returns)
Here:
$4,503
State:
$5,925
(% of AGI for various income ranges: 0.5% for AGIs below $25k, 1.9% for AGIs $25k-50k, 2.1% for AGIs $50k-75k, 2.4% for AGIs $75k-100k, 2.9% for AGIs $100k-200k)
Taxes paid: $2,651 (reported on 11.1% of returns)
36107:
$2,651
State:
$5,272
(% of AGI for various income ranges: 0.6% for AGIs below $25k, 1.0% for AGIs $25k-50k, 1.3% for AGIs $50k-75k, 1.8% for AGIs $75k-100k, 2.5% for AGIs $100k-200k)
Earned income credit: $2,968 (reported on 41.9% of returns)
Here:
$2,968
State:
$2,646
(% of AGI for various income ranges: 12.6% for AGIs below $25k, 1.3% for AGIs $25k-50k)
Percentage of individuals using paid preparers for their 2012 taxes: 57.3%
Here:
57%
State:
60%
(% for various income ranges: 59.2% for AGIs below $25k, 53.3% for AGIs $25k-50k, 52.2% for AGIs $50k-75k, 60.0% for AGIs $75k-100k, 60.0% for AGIs $100k-200k)
Averages for the 2004 tax year for zip code 36107, filed in 2005:
Average Adjusted Gross Income (AGI) in 2004: $24,487 (Individual Income Tax Returns)
Here:
$24,487
State:
$42,302
Salary/wage: $23,130 (reported on 87.3% of returns)
Here:
$23,130
State:
$36,626
(% of AGI for various income ranges: 91.5% for AGIs below $10k, 86.2% for AGIs $10k-25k, 86.8% for AGIs $25k-50k, 81.3% for AGIs $50k-75k, 82.6% for AGIs $75k-100k, 43.2% for AGIs over 100k)
Taxable interest for individuals: $1,361 (reported on 18.5% of returns)
This zip code:
$1,361
Alabama:
$1,827
(% of AGI for various income ranges: 1.4% for AGIs below $10k, 1.1% for AGIs $10k-25k, 0.7% for AGIs $25k-50k, 0.9% for AGIs $50k-75k, 0.8% for AGIs $75k-100k, 2.7% for AGIs over 100k)
Taxable dividends: $2,100 (reported on 7.2% of returns)
Here:
$2,100
State:
$4,206
(% of AGI for various income ranges: 0.3% for AGIs below $10k, 0.4% for AGIs $10k-25k, 0.4% for AGIs $25k-50k, 0.5% for AGIs $50k-75k, 0.1% for AGIs $75k-100k, 3.3% for AGIs over 100k)
Net capital gain/loss: +$2,588 (reported on 5.1% of returns)
Here:
+$2,588
State:
+$13,031
(% of AGI for various income ranges: -0.2% for AGIs below $10k, -0.1% for AGIs $10k-25k, 0.3% for AGIs $25k-50k, 0.7% for AGIs $50k-75k, -0.1% for AGIs $75k-100k, 4.9% for AGIs over 100k)
Profit/loss from business: +$5,003 (reported on 16.8% of returns)
Here:
+$5,003
State:
+$8,302
(% of AGI for various income ranges: 4.6% for AGIs below $10k, 4.0% for AGIs $10k-25k, 1.9% for AGIs $25k-50k, 2.9% for AGIs $50k-75k, 4.6% for AGIs $75k-100k, 8.1% for AGIs over 100k)
IRA payment deduction: $2,100 (reported on 1.1% of returns)
36107:
$2,100
Alabama:
$3,006
Total itemized deductions: $12,082 (25% of AGI, reported on 16.1% of returns)
Here:
$12,082
State:
$17,623
Here:
25.3% of AGI
State:
20.8% of AGI
(% of AGI for various income ranges: 3.7% for AGIs below $10k, 3.7% for AGIs $10k-25k, 9.6% for AGIs $25k-50k, 9.5% for AGIs $50k-75k, 11.8% for AGIs $75k-100k, 12.8% for AGIs over 100k)
Charity contributions deductions: $3,319 (7% of AGI, reported on 13.8% of returns)
Here:
$3,319
State:
$4,768
Here:
6.7% of AGI
State:
5.4% of AGI
(% of AGI for various income ranges: 0.5% for AGIs below $10k, 0.8% for AGIs $10k-25k, 1.9% for AGIs $25k-50k, 2.2% for AGIs $50k-75k, 3.1% for AGIs $75k-100k, 5.0% for AGIs over 100k)
Total tax: $2,953 (reported on 58.8% of returns)
36107:
$2,953
State:
$6,905
(% of AGI for various income ranges: 2.4% for AGIs below $10k, 2.8% for AGIs $10k-25k, 6.7% for AGIs $25k-50k, 9.6% for AGIs $50k-75k, 11.5% for AGIs $75k-100k, 18.9% for AGIs over 100k)
Earned income credit: $2,483 (reported on 42.0% of returns)
Here:
$2,483
State:
$2,048
Percentage of individuals using paid preparers for their 2004 taxes: 59.1%
Here:
59%
State:
65%
(% for various income ranges: 56.5% for AGIs below $10k, 66.3% for AGIs $10k-25k, 52.0% for AGIs $25k-50k, 53.8% for AGIs $50k-75k, 39.4% for AGIs $75k-100k, 51.3% for AGIs over 100k)
Likely homosexual households (counted as self-reported same-sex unmarried-partner households)
Lesbian couples: 0.7% of all households
Gay men: 0.0% of all households
Household received Food Stamps/SNAP in the past 12 months: 1,127 Household did not receive Food Stamps/SNAP in the past 12 months: 2,012
Women who had a birth in the past 12 months: 159 (80 now married, 69 unmarried) Women who did not have a birth in the past 12 months: 1,521 (372 now married, 1,150 unmarried)
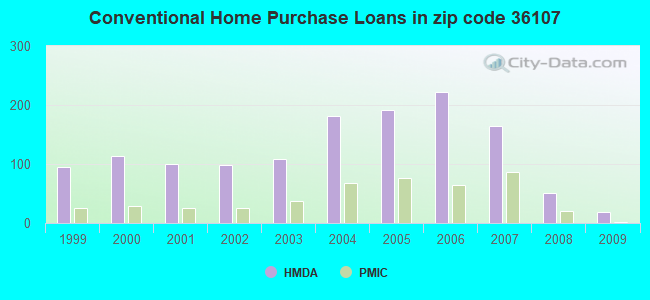
Housing units in zip code 36107 with a mortgage: 603 (59 second mortgage, 11 home equity loan) Houses without a mortgage: 17
Median monthly owner costs for units with a mortgage: $793 Median monthly owner costs for units without a mortgage: $319
Residents with income below the poverty level in 2022:
This zip code:
41.7%
Whole state:
16.2%
Residents with income below 50% of the poverty level in 2022:
This zip code:
17.2%
Whole state:
8.6%
Median number of rooms in houses and condos:
Here:
6.0
State:
6.5
Median number of rooms in apartments:
Here:
5.2
State:
4.7
Notable locations in this zip code not listed on our city pages
Notable locations in zip code 36107: Alabama Agricultural Center (A), Garrett Coliseum (B), Care Ambulance Service (C), Haynes Ambulance Service Montgomery Branch (D). Display/hide their locations on the map
Churches in zip code 36107 include: Church of Christ (A), Christ Episcopal Church (B), Capitol Heights Church of Christ (C), Capitol Heights Baptist Church (D), Pilgrim Rest Baptist Church (E), Pentecostal Holiness Church (F), New Hope Primitive Baptist Church (G), King Hill Church of Christ (H), King Hill Baptist Church (I). Display/hide their locations on the map
Parks in zip code 36107 include: Bruce Park (1), Yancey Park (2), Paterson Field (3), James A Light Field (4), King Hill Park (5). Display/hide their locations on the map
Tourist attractions (not listed on the city page) : Franco Distributing CO Inc (Amusement & Theme Parks; 1469 Jean Street), Franco Novelty LLC (Amusement & Theme Parks; 1469 Jean Street), Southern Skies Balloons (125 North Lewis Street).
570 married couples with children.
1,307 single-parent households (490 men, 817 women).
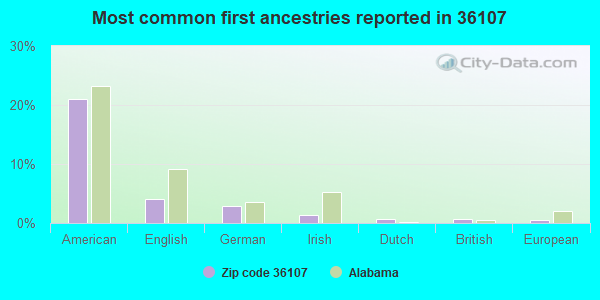
82.7% of residents of 36107 zip code speak English at home.
16.2% of residents speak Spanish at home (54% very well, 6% well, 20% not well, 20% not at all).
0.2% of residents speak other Indo-European language at home (100% very well).
0.6% of residents speak other language at home (21% very well, 38% not well, 41% not at all).
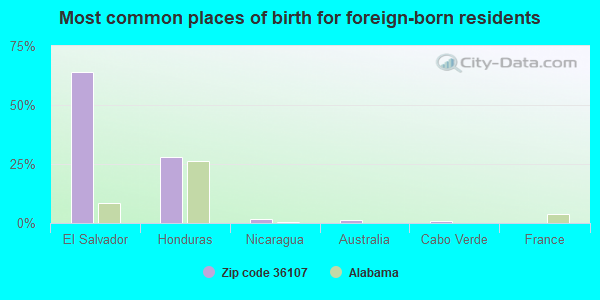
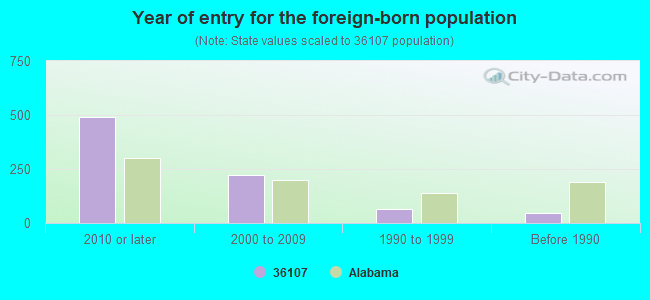
Foreign born population: 778 (10.3%) (6.7% of them are naturalized citizens)
Major facilities with environmental interests located in this zip code:
ASPHALT CONTRACTORS INC (1380 N MCDONOUGH ST in MONTGOMERY, AL)
AIR MINOR (AIRS/AFS) AIR SYNTHETIC MINOR (AIRS/AFS) CRITERIA AND HAZARDOUS AIR POLLUTANT INVENTORY (Inventory of air pollution sources) (Resource Conservation and Recovery Act (tracking hazardous waste)) Business SIC classification: ASPHALT PAVING MIXTURES AND BLOCKS Business NAICS classification: ASPHALT PAVING MIXTURE AND BLOCK MANUFACTURING.; ASPHALT PAVING MIXTURE AND BLOCK MANUFACTURING. Organizations: CHARLES L BRASSELL (CONTACT/OWNER)
CAPITOL HEIGHTS JUNIOR HIGH SCHOOL (116 FEDERAL DR in MONTGOMERY, AL)
(Geographic Names Information System) (National Center for Education Statistics) - STATE ID-0100 Organizations: MONTGOMERY COUNTY (SCHOOL DISTRICT)
LEE HIGH SCHOOL (225 ANN ST in MONTGOMERY, AL)
(Geographic Names Information System) (National Center for Education Statistics) - STATE ID-0400 Organizations: MONTGOMERY COUNTY (SCHOOL DISTRICT)
CHILDRENS CENTER (310 MADISON TERR in MONTGOMERY, AL)
(National Center for Education Statistics) - STATE ID-0150 Organizations: MONTGOMERY COUNTY (SCHOOL DISTRICT)
ACME DUST CONTROL (2509 HIWHLAND AVE in MONTGOMERY, AL)
BP OIL CO SITE #24273 (1425 ANN ST in MONTGOMERY, AL)
(Resource Conservation and Recovery Act (tracking hazardous waste)) Organizations: BP OIL CO. (CONTACT/OWNER)
CARBURETOR ELECTRIC (2119 MT MEIGS ROAD in MONTGOMERY, AL)
(Resource Conservation and Recovery Act (tracking hazardous waste)) Organizations: MARK COOK (CONTACT/OWNER)
BOOSTERS INC (2509 EAST FIFTH STREET in MONTGOMERY, AL)
Small Quantity Generators, between 100 kg and 1000 kg of hazardous waste/month (Resource Conservation and Recovery Act (tracking hazardous waste)) - notification Business NAICS classification: COMMERCIAL SCREEN PRINTING. Organizations: JACK D PARKS (CONTACT/OPERATOR)
, JACK PARKS (CONTACT/OWNER)
ENTEC STORE 103 (124 ANN STREET in MONTGOMERY, AL)
National Pollutant Discharge Elimination System NON-MAJOR (Tracking pollutant discharge elimination systems) - permit Business SIC classification: GASOLINE SERVICE STATIONS
ALABAMA POWER (CROCKETT PROPERTY) (8 CALHOUN ROAD in MONTGOMERY, AL)
COMPLIANCE ACTIVITY (Tracking inspections of insecticide, fungicide, and rodenticide, and toxic substances)
A&H FOOD MART (828 MADISON AVENUE in MONTGOMERY, AL)
ENFORCEMENT/COMPLIANCE ACTIVITY (Integrated Compliance Information System)
KYSER PROPERTY MANAGEMENT CO, INC (1537 JEAN ST in MONTGOMERY, AL)
ENFORCEMENT/COMPLIANCE ACTIVITY (Integrated Compliance Information System)
Housing units lacking complete plumbing facilities: 5.3% Housing units lacking complete kitchen facilities: 9.6%
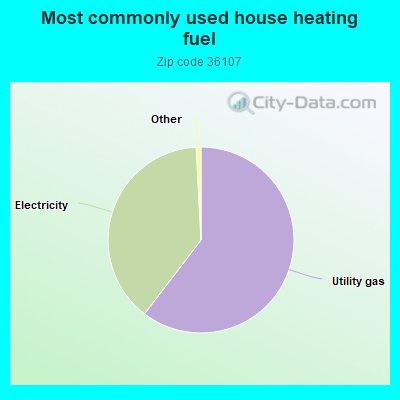
60.4%Utility gas
38.8%Electricity
Population in 1990: 10,345.
Place of birth for U.S.-born residents:
This state: 5,105
Northeast: 323
Midwest: 187
South: 940
West: 211
48% of the 36107 zip code residents lived in the same house 5 years ago. Out of people who lived in different houses, 66% lived in this county. Out of people who lived in different counties, 50% lived in Alabama.
70% of the 36107 zip code residents lived in the same house 1 year ago. Out of people who lived in different houses, 73% moved from this county. Out of people who lived in different houses, 3% moved from different county within same state. Out of people who lived in different houses, 14% moved from different state. Out of people who lived in different houses, 3% moved from abroad.
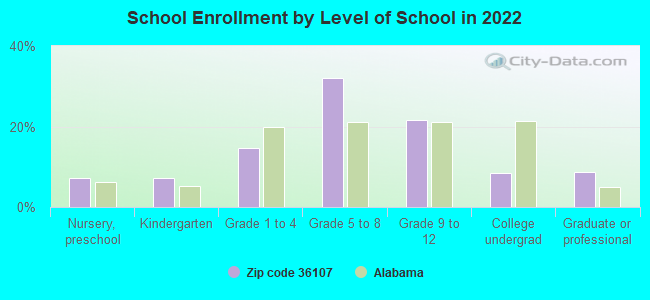
Private vs. public school enrollment:
Students in private schools in grades 1 to 8 (elementary and middle school): 52
Here:
6.2%
Alabama:
14.7%
Students in private schools in grades 9 to 12 (high school): 22
Here:
5.7%
Alabama:
16.3%
Students in private undergraduate colleges: 62
Here:
40.2%
Alabama:
14.6%
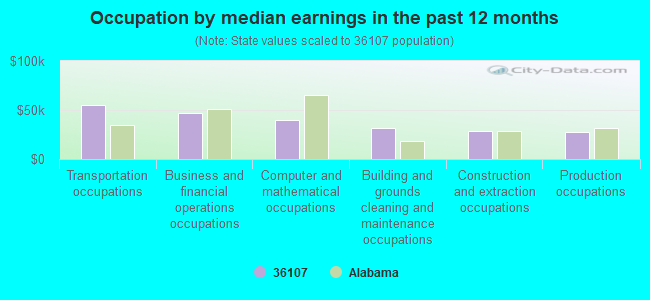
Occupation by median earnings in the past 12 months ($)
55,173Transportation occupations
47,050Business and financial operations occupations
39,745Computer and mathematical occupations
32,037Building and grounds cleaning and maintenance occupations
28,441Construction and extraction occupations
27,746Production occupations
Companies with federal contracts located in this zip code (MONTGOMERY, AL):
HAGAN CONSTRUCTION COMPANY INC (235 SOUTH LEWIS ST; small business) : $1,755,323 in 3 contractsfrom 2003 to 2004
$1,377,700 with Army for Maintenance, Repair or Alteration of Real Property -- Office Buildings. Signed on 2003-07-30. Completion date: 2005-01-03.
$353,495, same as above.Signed on 2004-08-09. Completion date: 2005-01-20.
$24,128, same as above.Signed on 2004-05-11. Completion date: 2004-10-15.
NATHAN SEGALL CO INC (1667 FEDERAL DR STE 12; small business) : $1,137,604 in 231 contractsfrom 2005 to 2006
Contracts for Fruits and Vegetables by Defense Logistics Agency Signed by year:2000: $0; 2001: $0; 2002: $0; 2003: $0; 2004: $0; 2005: $523,856; 2006: $613,748.
Biggest contracts:
$10,256 with Defense Logistics Agency for Fruits and Vegetables. Signed on 2005-11-16. Completion date: 2005-11-16.
$10,088, same as above.Signed on 2005-11-24. Completion date: 2005-11-24.
$10,046, same as above.Signed on 2005-11-28. Completion date: 2005-11-28.
$9,536, same as above.Signed on 2006-05-26. Completion date: 2006-05-26.
ELECTRONIC ENGINEERS, INC (2660 ZELDA RD; small business) : $148,748 in 5 contractsfrom 2002 to 2005
Contracts for Electrical Hardware and Supplies, Video Recording and Reproducing Equipment, Audio/Visual Services, Communications Security Equipment and Components by Centers for Disease Control and Prevention, Air Force Signed by year:2000: $0; 2001: $0; 2002: $25,952; 2003: $0; 2004: $83,195; 2005: $39,601; 2006: $0.
Biggest contracts:
$43,196 with Centers for Disease Control and Prevention for Electrical Hardware and Supplies. Taking place in GA. Signed on 2004-06-15. Completion date: 2004-07-30.
$39,999 with Centers for Disease Control and Prevention for Video Recording and Reproducing Equipment. Taking place in GA. Signed on 2004-08-30. Completion date: 2004-09-30.
$32,607 with Air Force for Audio/Visual Services. Taking place in FL. Signed on 2005-04-04. Completion date: 2005-02-01.
$25,952 with Air Force for Communications Security Equipment and Components. Signed on 2002-08-28. Completion date: 2002-08-28.
RAM ENTERPRISES, INC (1519 EAST ANN STREET; small business)
$116,098 with Air Force for ADP Input/Output and Storage Devices. Signed on 2003-09-20. Completion date: 2003-10-30.
ASSOCIATED MECHANICAL CONTRS (248 S LEWIS ST) : $54,476 in 5 contractsfrom 1999 to 2006
Contracts for Water Quality Support Services, Maintenance, Repair or Alteration of Real Property -- Office Buildings, Installation of Equipment -- Fire Control Equipment, Medical and Surgical Instruments, Equipment, and Supplies by Tennessee Valley Authority, Public Buildings Service, Air Force, Army, and others Signed by year:2000: $0; 2001: $0; 2002: $0; 2003: $10,306; 2004: $0; 2005: $0; 2006: $4,170.
Biggest contracts:
$40,000 with Tennessee Valley Authority for Water Quality Support Services. Signed on 1999-12-15. Completion date: 2000-02-15.
$6,545 with Public Buildings Service for Maintenance, Repair or Alteration of Real Property -- Office Buildings. Signed on 2003-02-15. Completion date: 2003-06-15.
$4,170 with Air Force for Installation of Equipment -- Fire Control Equipment. Signed on 2006-02-21. Completion date: 2006-03-23.
$3,266 with Army for Medical and Surgical Instruments, Equipment, and Supplies. Taking place in GA. Signed on 2003-04-04. Completion date: 2003-04-07.
CAPITOL COMMUNICATIONS, INC. (1576 MOUNT MEIGS RD; small business)
$49,236 with Air Force for Maintenance, Repair and Rebuilding of Equipment -- Communication, Detection, and Coherent Radiation Equipment. Signed on 1999-10-01. Completion date: 2000-09-30.
SHIRLEY A HAMILTON (2005 HARMON ST; small business) : $27,030 in 7 contractsfrom 2004 to 2006
Contracts for Recreation Site Maintenance Services (non-construction) by U.S. Army Corps of Engineers - civil program financing only, Army Signed by year:2000: $0; 2001: $0; 2002: $0; 2003: $0; 2004: $9,750; 2005: $12,160; 2006: $5,120.
Biggest contracts:
$7,680 with U.S. Army Corps of Engineers - civil program financing only for Recreation Site Maintenance Services (non-construction). Taking place in OK. Signed on 2005-03-17. Completion date: 2005-10-29.
$7,680 with Army for Recreation Site Maintenance Services (non-construction). Taking place in OK. Signed on 2005-03-17. Completion date: 2005-10-29.
$5,120, same as above.Signed on 2006-04-12. Completion date: 2006-09-01.
$4,875, same as above.Signed on 2004-04-13. Completion date: 2004-09-05.
COLE PLUMBING, INC (1900 MOUNT MEIGS RD; small business) : $24,325 in 6 contractsfrom 2004 to 2006
Contracts for Maintenance, Repair or Alteration of Real Property -- Other Utilities, Maintenance, Repair and Rebuilding of Equipment -- Water Purification and Sewage Treatment Equipment, Maintenance, Repair or Alteration of Real Property -- Other Industrial Buildings, Water Services, and moreby Army Signed by year:2000: $0; 2001: $0; 2002: $0; 2003: $0; 2004: $13,560; 2005: $6,993; 2006: $3,772.
Biggest contracts:
$6,993 with Army for Maintenance, Repair or Alteration of Real Property -- Other Utilities. Signed on 2005-05-25. Completion date: 2005-05-25.
$6,399 with Army for Maintenance, Repair and Rebuilding of Equipment -- Water Purification and Sewage Treatment Equipment. Signed on 2004-06-15. Completion date: 2004-06-30.
$3,860 with Army for Maintenance, Repair or Alteration of Real Property -- Other Industrial Buildings. Signed on 2004-03-10. Completion date: 2004-03-12.
$3,772 with Army for Water Services. Signed on 2006-02-03. Completion date: 2006-02-28.
FOLSOM, JR , WILLIAM P (2622 THRASHER ST; small business) : $8,225 in 3 contractsfrom 2004 to 2006
$11,500 with Air Force for Chaplain Services. Signed on 2004-10-01. Completion date: 2004-09-30.
$0 with Air Force for Other Administrative Support Services. Signed on 2006-04-05. Completion date: 2003-09-30.
-$3,275, same as above.Signed on 2006-04-05. Completion date: 2003-09-30.
GRAPHICS & MAILING SERVICE, IN (2026 LOCUST ST; small business)
$6,788 with Army for Mailing and Distribution Services. Signed on 2004-11-19. Completion date: 2005-09-30.
Top industries in this zip code by the number of employees in 2005:
2010 - 2018 National Fire Incident Reporting System (NFIRS) incidents
According to the data from the years 2010 - 2018 the average number of fires per year is 20. The highest number of reported fire incidents - 70 took place in 2018, and the least - 0 in 2011. The data has an increasing trend.
When looking into fire subcategories, the most incidents belonged to: Outside Fires (43.2%), and Structure Fires (33.5%).
Fire incident types reported to NFIRS in Zip Code 36107
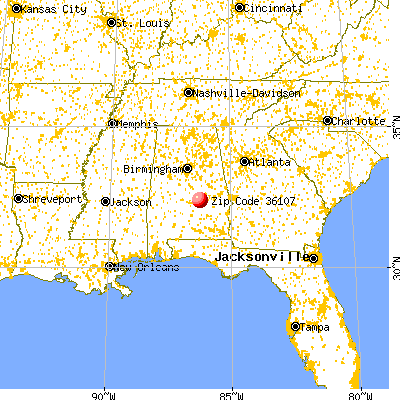


 Nearest zip codes: 36109, 36106, 36115, 36111, 36104, 36110.
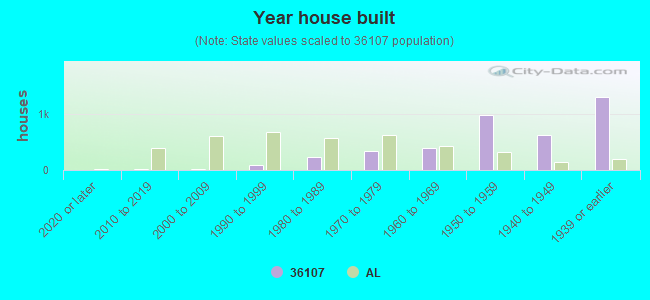


 According to the data from the years 2010 - 2018 the average number of fires per year is 20. The highest number of reported fire incidents - 70 took place in 2018, and the least - 0 in 2011. The data has an increasing trend.
 When looking into fire subcategories, the most incidents belonged to: Outside Fires (43.2%), and Structure Fires (33.5%).