Estimated zip code population in 2022: 15,219 Zip code population in 2010: 15,211 Zip code population in 2000: 15,246
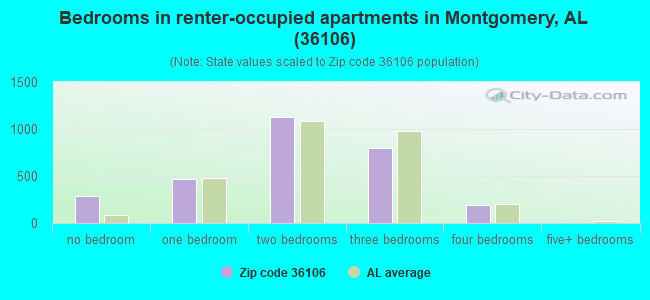
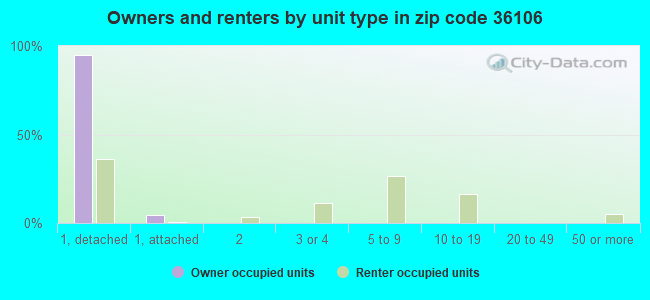
Houses and condos: 7,295 Renter-occupied apartments: 2,882
% of renters here:
44%
State:
30%
March 2022 cost of living index in zip code 36106: 85.0 (less than average, U.S. average is 100)
Land area: 6.1 sq. mi. Water area: 0.0 sq. mi.
Population density: 2,501 people per square mile
(average).
OSM Map
General Map
Google Map
MSN Map
OSM Map
General Map
Google Map
MSN Map
OSM Map
General Map
Google Map
MSN Map
OSM Map
General Map
Google Map
MSN Map
Please wait while loading the map...
Real estate property taxes paid for housing units in 2022:
This zip code:
0.3% ($671)
Alabama:
0.4% ($718)
Median real estate property taxes paid for housing units with mortgages in 2022: $683 (0.3%) Median real estate property taxes paid for housing units with no mortgage in 2022: $664 (0.3%)
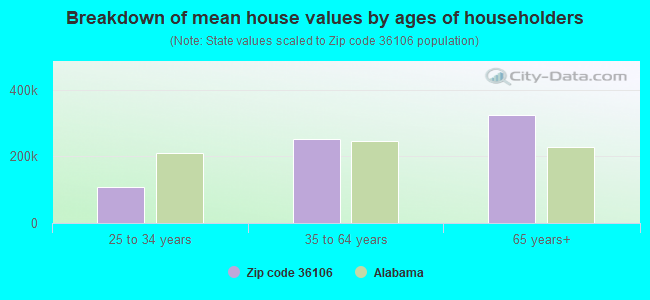
Estimated median house/condo value in 2022: $204,036
36106:
$204,036
Alabama:
$200,900
According to our research of Alabama and other state lists, there were 19 registered sex offenders living in 36106 zip code as of April 27, 2024. The ratio of all residents to sex offenders in zip code 36106 is 792 to 1. The ratio of registered sex offenders to all residents in this zip code is lower than the state average.
Median resident age:
This zip code:
36.5 years
Alabama median age:
39.6 years
Average household size:
This zip code:
2.1 people
Alabama:
2.5 people
Averages for the 2020 tax year for zip code 36106, filed in 2021:
Average Adjusted Gross Income (AGI) in 2020: $74,413 (Individual Income Tax Returns)
Here:
$74,413
State:
$63,984
Salary/wage: $53,423 (reported on 80.8% of returns)
Here:
$53,423
State:
$52,834
(% of AGI for various income ranges: 1255.1% for AGIs below $25k, 3929.7% for AGIs $25k-50k, 7228.5% for AGIs $50k-75k, 10045.3% for AGIs $75k-100k, 19021.1% for AGIs $100k-200k, 101231.4% for AGIs over 200k)
Taxable interest for individuals: $2,048 (reported on 29.2% of returns)
This zip code:
$2,048
Alabama:
$1,615
(% of AGI for various income ranges: 12.8% for AGIs below $25k, 11.9% for AGIs $25k-50k, 57.5% for AGIs $50k-75k, 123.2% for AGIs $75k-100k, 261.9% for AGIs $100k-200k, 2792.9% for AGIs over 200k)
Ordinary dividends: $14,054 (reported on 19.3% of returns)
Here:
$14,054
State:
$7,660
(% of AGI for various income ranges: 22.3% for AGIs below $25k, 43.0% for AGIs $25k-50k, 270.7% for AGIs $50k-75k, 427.4% for AGIs $75k-100k, 936.1% for AGIs $100k-200k, 15682.9% for AGIs over 200k)
Net capital gain/loss in AGI: +$32,915 (reported on 17.7% of returns)
Here:
+$32,915
State:
+$23,528
(% of AGI for various income ranges: 11.6% for AGIs below $25k, 17.3% for AGIs $25k-50k, 99.2% for AGIs $50k-75k, 209.7% for AGIs $75k-100k, 958.9% for AGIs $100k-200k, 48990.0% for AGIs over 200k)
Profit/loss from business: +$11,903 (reported on 20.1% of returns)
Here:
+$11,903
State:
+$9,534
(% of AGI for various income ranges: 47.6% for AGIs below $25k, 31.9% for AGIs $25k-50k, 85.3% for AGIs $50k-75k, 311.5% for AGIs $75k-100k, 795.6% for AGIs $100k-200k, 14935.7% for AGIs over 200k)
Taxable individual retirement arrangement distribution: $21,055 (reported on 7.5% of returns)
36106:
$21,055
Alabama:
$19,004
(% of AGI for various income ranges: 23.8% for AGIs below $25k, 59.6% for AGIs $25k-50k, 176.8% for AGIs $50k-75k, 317.1% for AGIs $75k-100k, 910.8% for AGIs $100k-200k, 5830.0% for AGIs over 200k)
Self-employed (Keogh) retirement plans: $27,150 (reported on 0.6% of returns)
36106:
$27,150
Alabama:
$26,467
(% of AGI for various income ranges: 1551.4% for AGIs over 200k)
Total itemized deductions: $40,700 (reported on 10.8% of returns)
Here:
$40,700
State:
$37,338
(% of AGI for various income ranges: 54.2% for AGIs below $25k, 137.0% for AGIs $25k-50k, 445.7% for AGIs $50k-75k, 1022.1% for AGIs $75k-100k, 1787.5% for AGIs $100k-200k, 20415.7% for AGIs over 200k)
Charity contributions: $19,061 (reported on 9.7% of returns)
Here:
$19,061
State:
$18,005
(% of AGI for various income ranges: 6.3% for AGIs below $25k, 46.3% for AGIs $25k-50k, 135.3% for AGIs $50k-75k, 317.1% for AGIs $75k-100k, 728.9% for AGIs $100k-200k, 10465.7% for AGIs over 200k)
Taxes paid: $5,876 (reported on 10.5% of returns)
36106:
$5,876
State:
$6,484
(% of AGI for various income ranges: 3.7% for AGIs below $25k, 14.9% for AGIs $25k-50k, 62.7% for AGIs $50k-75k, 120.3% for AGIs $75k-100k, 334.4% for AGIs $100k-200k, 2734.3% for AGIs over 200k)
Earned income credit: $2,674 (reported on 20.9% of returns)
Here:
$2,674
State:
$2,628
(% of AGI for various income ranges: 149.2% for AGIs below $25k, 80.1% for AGIs $25k-50k)
Percentage of individuals using paid preparers for their 2020 taxes: 91.0%
Here:
91%
State:
93%
(% for various income ranges: 91.3% for AGIs below $25k, 91.0% for AGIs $25k-50k, 89.5% for AGIs $50k-75k, 88.1% for AGIs $75k-100k, 92.5% for AGIs $100k-200k, 94.6% for AGIs over 200k)
Averages for the 2012 tax year for zip code 36106, filed in 2013:
Average Adjusted Gross Income (AGI) in 2012: $71,774 (Individual Income Tax Returns)
Here:
$71,774
State:
$52,001
Salary/wage: $51,583 (reported on 81.2% of returns)
Here:
$51,583
State:
$43,822
(% of AGI for various income ranges: 77.5% for AGIs below $25k, 81.6% for AGIs $25k-50k, 72.7% for AGIs $50k-75k, 65.7% for AGIs $75k-100k, 65.8% for AGIs $100k-200k, 36.9% for AGIs over 200k)
Taxable interest for individuals: $2,183 (reported on 33.6% of returns)
This zip code:
$2,183
Alabama:
$1,592
(% of AGI for various income ranges: 1.2% for AGIs below $25k, 0.7% for AGIs $25k-50k, 0.8% for AGIs $50k-75k, 1.0% for AGIs $75k-100k, 1.2% for AGIs $100k-200k, 1.0% for AGIs over 200k)
Ordinary dividends: $10,701 (reported on 24.2% of returns)
Here:
$10,701
State:
$5,697
(% of AGI for various income ranges: 2.4% for AGIs below $25k, 1.5% for AGIs $25k-50k, 2.5% for AGIs $50k-75k, 3.5% for AGIs $75k-100k, 3.2% for AGIs $100k-200k, 5.1% for AGIs over 200k)
Net capital gain/loss in AGI: +$37,768 (reported on 19.4% of returns)
Here:
+$37,768
State:
+$13,286
(% of AGI for various income ranges: 0.3% for AGIs below $25k, 0.9% for AGIs $50k-75k, 0.7% for AGIs $75k-100k, 1.5% for AGIs $100k-200k, 25.7% for AGIs over 200k)
Profit/loss from business: +$14,018 (reported on 19.1% of returns)
Here:
+$14,018
State:
+$9,151
(% of AGI for various income ranges: 7.7% for AGIs below $25k, 1.4% for AGIs $25k-50k, 1.6% for AGIs $50k-75k, 3.7% for AGIs $75k-100k, 4.0% for AGIs $100k-200k, 4.3% for AGIs over 200k)
Taxable individual retirement arrangement distribution: $17,322 (reported on 10.5% of returns)
36106:
$17,322
Alabama:
$14,992
(% of AGI for various income ranges: 1.9% for AGIs below $25k, 1.8% for AGIs $25k-50k, 2.4% for AGIs $50k-75k, 2.9% for AGIs $75k-100k, 3.8% for AGIs $100k-200k, 2.1% for AGIs over 200k)
Self-employment retirement plans: $22,950 (reported on 1.2% of returns)
36106:
$22,950
Alabama:
$20,904
Total itemized deductions: $24,328 (18% of AGI, reported on 38.0% of returns)
Here:
$24,328
State:
$21,388
Here:
18.1% of AGI
State:
20.1% of AGI
(% of AGI for various income ranges: 11.5% for AGIs below $25k, 12.2% for AGIs $25k-50k, 15.3% for AGIs $50k-75k, 15.7% for AGIs $75k-100k, 14.2% for AGIs $100k-200k, 11.1% for AGIs over 200k)
Charity contributions: $7,933 (reported on 34.4% of returns)
Here:
$7,933
State:
$5,925
(% of AGI for various income ranges: 1.6% for AGIs below $25k, 2.7% for AGIs $25k-50k, 3.9% for AGIs $50k-75k, 4.3% for AGIs $75k-100k, 4.3% for AGIs $100k-200k, 4.1% for AGIs over 200k)
Taxes paid: $5,796 (reported on 37.8% of returns)
36106:
$5,796
State:
$5,272
(% of AGI for various income ranges: 1.1% for AGIs below $25k, 1.9% for AGIs $25k-50k, 2.8% for AGIs $50k-75k, 3.2% for AGIs $75k-100k, 3.4% for AGIs $100k-200k, 3.6% for AGIs over 200k)
Earned income credit: $2,559 (reported on 20.2% of returns)
Here:
$2,559
State:
$2,646
(% of AGI for various income ranges: 9.3% for AGIs below $25k, 0.9% for AGIs $25k-50k)
Percentage of individuals using paid preparers for their 2012 taxes: 54.3%
Here:
54%
State:
60%
(% for various income ranges: 54.3% for AGIs below $25k, 47.2% for AGIs $25k-50k, 53.8% for AGIs $50k-75k, 51.7% for AGIs $75k-100k, 59.5% for AGIs $100k-200k, 82.4% for AGIs over 200k)
Averages for the 2004 tax year for zip code 36106, filed in 2005:
Average Adjusted Gross Income (AGI) in 2004: $71,148 (Individual Income Tax Returns)
Here:
$71,148
State:
$42,302
Salary/wage: $51,265 (reported on 79.4% of returns)
Here:
$51,265
State:
$36,626
(% of AGI for various income ranges: 283.5% for AGIs below $10k, 77.8% for AGIs $10k-25k, 76.1% for AGIs $25k-50k, 69.8% for AGIs $50k-75k, 67.9% for AGIs $75k-100k, 46.0% for AGIs over 100k)
Taxable interest for individuals: $3,237 (reported on 46.6% of returns)
This zip code:
$3,237
Alabama:
$1,827
(% of AGI for various income ranges: 20.7% for AGIs below $10k, 2.2% for AGIs $10k-25k, 2.0% for AGIs $25k-50k, 1.9% for AGIs $50k-75k, 2.1% for AGIs $75k-100k, 2.1% for AGIs over 100k)
Taxable dividends: $9,551 (reported on 33.9% of returns)
Here:
$9,551
State:
$4,206
(% of AGI for various income ranges: 31.3% for AGIs below $10k, 2.5% for AGIs $10k-25k, 2.3% for AGIs $25k-50k, 2.7% for AGIs $50k-75k, 3.4% for AGIs $75k-100k, 5.5% for AGIs over 100k)
Net capital gain/loss: +$20,146 (reported on 28.2% of returns)
Here:
+$20,146
State:
+$13,031
(% of AGI for various income ranges: -7.3% for AGIs below $10k, -0.5% for AGIs $10k-25k, 0.7% for AGIs $25k-50k, 1.4% for AGIs $50k-75k, 2.3% for AGIs $75k-100k, 12.5% for AGIs over 100k)
Profit/loss from business: +$16,107 (reported on 17.6% of returns)
Here:
+$16,107
State:
+$8,302
(% of AGI for various income ranges: -26.7% for AGIs below $10k, 4.0% for AGIs $10k-25k, 2.4% for AGIs $25k-50k, 2.4% for AGIs $50k-75k, 3.9% for AGIs $75k-100k, 4.8% for AGIs over 100k)
IRA payment deduction: $3,026 (reported on 3.0% of returns)
36106:
$3,026
Alabama:
$3,006
(% of AGI for various income ranges: 0.2% for AGIs $10k-25k, 0.3% for AGIs $25k-50k, 0.2% for AGIs $50k-75k, 0.2% for AGIs $75k-100k, 0.1% for AGIs over 100k)
Self-employed pension: $18,457 (reported on 1.5% of returns)
Here:
$18,457
Alabama:
$17,165
Total itemized deductions: $21,348 (17% of AGI, reported on 43.8% of returns)
Here:
$21,348
State:
$17,623
Here:
16.7% of AGI
State:
20.8% of AGI
(% of AGI for various income ranges: 59.1% for AGIs below $10k, 12.0% for AGIs $10k-25k, 15.6% for AGIs $25k-50k, 14.0% for AGIs $50k-75k, 15.0% for AGIs $75k-100k, 12.0% for AGIs over 100k)
Charity contributions deductions: $8,119 (6% of AGI, reported on 40.4% of returns)
Here:
$8,119
State:
$4,768
Here:
6.1% of AGI
State:
5.4% of AGI
(% of AGI for various income ranges: 5.3% for AGIs below $10k, 2.1% for AGIs $10k-25k, 3.5% for AGIs $25k-50k, 3.6% for AGIs $50k-75k, 4.3% for AGIs $75k-100k, 5.3% for AGIs over 100k)
Total tax: $15,107 (reported on 76.6% of returns)
36106:
$15,107
State:
$6,905
(% of AGI for various income ranges: 9.5% for AGIs below $10k, 3.8% for AGIs $10k-25k, 7.3% for AGIs $25k-50k, 10.1% for AGIs $50k-75k, 11.5% for AGIs $75k-100k, 21.1% for AGIs over 100k)
Earned income credit: $2,168 (reported on 15.0% of returns)
Here:
$2,168
State:
$2,048
Percentage of individuals using paid preparers for their 2004 taxes: 59.8%
Here:
60%
State:
65%
(% for various income ranges: 57.9% for AGIs below $10k, 61.3% for AGIs $10k-25k, 56.7% for AGIs $25k-50k, 55.4% for AGIs $50k-75k, 53.5% for AGIs $75k-100k, 71.6% for AGIs over 100k)
Household received Food Stamps/SNAP in the past 12 months: 896 Household did not receive Food Stamps/SNAP in the past 12 months: 5,745
Women who had a birth in the past 12 months: 167 (92 now married, 67 unmarried) Women who did not have a birth in the past 12 months: 4,012 (1,072 now married, 2,945 unmarried)
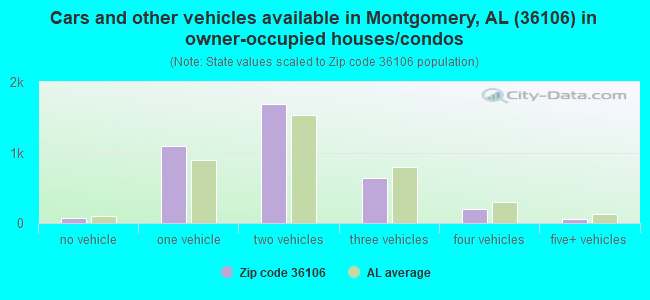
Housing units in zip code 36106 with a mortgage: 2,619 (233 second mortgage, 130 both second mortgage and home equity loan) Houses without a mortgage: 197
Median monthly owner costs for units with a mortgage: $1,268 Median monthly owner costs for units without a mortgage: $469
Residents with income below the poverty level in 2022:
This zip code:
13.7%
Whole state:
16.2%
Residents with income below 50% of the poverty level in 2022:
This zip code:
6.2%
Whole state:
8.6%
Median number of rooms in houses and condos:
Here:
7.2
State:
6.5
Median number of rooms in apartments:
Here:
4.5
State:
4.7
Notable locations in this zip code not listed on our city pages
1,125 married couples with children.
1,076 single-parent households (290 men, 786 women).
95.1% of residents of 36106 zip code speak English at home.
3.0% of residents speak Spanish at home (49% very well, 10% well, 32% not well, 8% not at all).
0.3% of residents speak other Indo-European language at home (52% very well, 48% well).
1.3% of residents speak Asian or Pacific Island language at home (56% very well, 41% well, 4% not well).
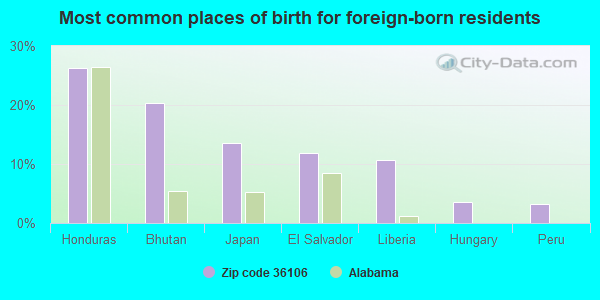
Foreign born population: 518 (3.4%) (21.3% of them are naturalized citizens)
Major facilities with environmental interests located in this zip code:
CLOVERDALE JUNIOR HIGH SCHOOL (1125 E FAIRVIEW AVE in MONTGOMERY, AL)
(National Center for Education Statistics) - STATE ID-0180 Organizations: MONTGOMERY COUNTY (SCHOOL DISTRICT)
AMERICAN LUBEFAST LLC #603 (2001 CARTER HILL ROAD in MONTGOMERY, AL)
(Resource Conservation and Recovery Act (tracking hazardous waste)) Business NAICS classification: AUTOMOTIVE OIL CHANGE AND LUBRICATION SHOPS. Alternative names: AMERICAN LUBEFAST LLC SUPER-LUBE #603
BRASCO PACKAGING (1566 JEAN STREET in MONTGOMERY, AL)
(Resource Conservation and Recovery Act (tracking hazardous waste)) Organizations: OPERNAME (CONTACT/OPERATOR)
, 3 B PACKAGING CO (CONTACT/OWNER)
CAPITOL CITY LAUNDRY (1000 E FAIRVIEW in MONTGOMERY, AL)
CHEVRON PRODUCTS CO (1220 PERRY HILL ROAD in MONTGOMERY, AL)
National Pollutant Discharge Elimination System NON-MAJOR (Tracking pollutant discharge elimination systems) - permit Business SIC classification: GASOLINE SERVICE STATIONS Alternative names: CHEVRON PRODTS PERRY HILL MTG
MONTGOMERY PLATING WORKS (1419 HIGHLAND AVE. in MONTGOMERY, AL)
SUPERFUND (Superfund database) (Resource Conservation and Recovery Act (tracking hazardous waste)) Organizations: OWNERNAME (CONTACT/OWNER)
Alternative names: OLD MONTGOMERY PLATING WORKS SITE
ASM RECYCLING INC (3800 MOBILE HIGHWAY in MONTGOMERY, AL)
National Pollutant Discharge Elimination System NON-MAJOR (Tracking pollutant discharge elimination systems) - permit Business SIC classification: SCRAP AND WASTE MATERIALS
ENTEC STORE 103 (3620 WETUMPKA in MONTGOMERY, AL)
National Pollutant Discharge Elimination System NON-MAJOR (Tracking pollutant discharge elimination systems) - permit Business SIC classification: GASOLINE SERVICE STATIONS Organizations: ENTEC STORE 106 (CONTACT/OWNER)
Alternative names: ENTEC STORE 106
MSDW ELEVATOR SHAFT (2898 ZELDA ROAD in MONTGOMERY, AL)
(Resource Conservation and Recovery Act (tracking hazardous waste))
BIG 10 TIRE STORES INC STORE #82 (2769 ZELDA ROAD in MONTGOMERY, AL)
Conditionally Exempt Small Quantity Generators, less than 100 kg/month of hazardous waste (Resource Conservation and Recovery Act (tracking hazardous waste)) - notification Organizations: BIG 10 TIRE STORE #82 (CONTACT/OPERATOR)
CARMICHAEL CLIMATE STORAGE LLC (DAVID WEBB in MONTGOMERY, AL)
National Pollutant Discharge Elimination System NON-MAJOR (Tracking pollutant discharge elimination systems) - permit Business SIC classification: GENERAL CONTRACTORS-INDUSTRIAL BUILDINGS AND WAREHOUSES
ALABAMA POWER COMPANY (2460 EAST FIFTH ST. in MONTGOMERY, AL)
COMPLIANCE ACTIVITY (Tracking inspections of insecticide, fungicide, and rodenticide, and toxic substances)
CAROL COKER PROPERTY (1713 SYLVAN DRIVE in MONTGOMERY, AL)
COMPLIANCE ACTIVITY (Tracking inspections of insecticide, fungicide, and rodenticide, and toxic substances)
Housing units lacking complete plumbing facilities: 1.5% Housing units lacking complete kitchen facilities: 3.1%
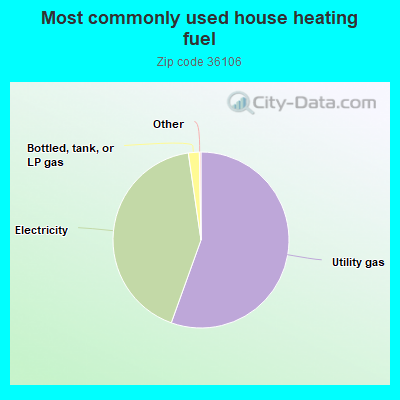
55.5%Utility gas
42.2%Electricity
2.0%Bottled, tank, or LP gas
Population in 1990: 15,744.
Place of birth for U.S.-born residents:
This state: 9,732
Northeast: 668
Midwest: 979
South: 2,799
West: 390
49% of the 36106 zip code residents lived in the same house 5 years ago. Out of people who lived in different houses, 46% lived in this county. Out of people who lived in different counties, 50% lived in Alabama.
84% of the 36106 zip code residents lived in the same house 1 year ago. Out of people who lived in different houses, 54% moved from this county. Out of people who lived in different houses, 9% moved from different county within same state. Out of people who lived in different houses, 33% moved from different state. Out of people who lived in different houses, 3% moved from abroad.
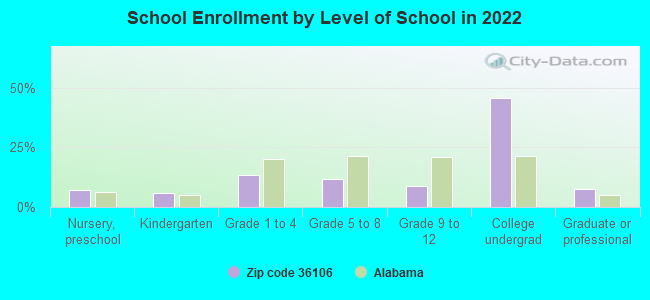
Private vs. public school enrollment:
Students in private schools in grades 1 to 8 (elementary and middle school): 387
Here:
35.5%
Alabama:
14.7%
Students in private schools in grades 9 to 12 (high school): 168
Here:
42.8%
Alabama:
16.3%
Students in private undergraduate colleges: 606
Here:
31.8%
Alabama:
14.6%
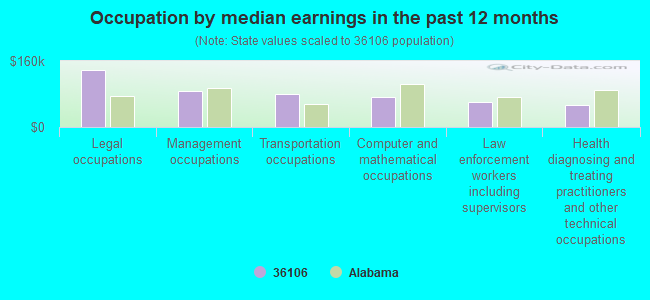
Occupation by median earnings in the past 12 months ($)
137,234Legal occupations
87,334Management occupations
81,150Transportation occupations
72,984Computer and mathematical occupations
59,422Law enforcement workers including supervisors
53,708Health diagnosing and treating practitioners and other technical occupations
Companies with biggest federal contracts located in this zip code (MONTGOMERY, AL):
CAPITOL FILMWORKS INC (909 FOREST AVE; small business) : $4,364,364 in 24 contractsfrom 1999 to 2006
Contracts for Audio/Visual Services, Arts/Graphics Services, Photographic Developing and Finishing Equipment by Air Force, Department of Veterans Affairs Signed by year:2000: $600,960; 2001: $36,300; 2002: $887,463; 2003: $673,018; 2004: $672,231; 2005: $671,698; 2006: -$6,745.
Biggest contracts:
$1,343,396 with Air Force for Audio/Visual Services. Signed on 2005-10-01. Completion date: 2006-09-30.
$829,439, same as above.Signed on 1999-10-14. Completion date: 2000-09-30.
$726,000, same as above.Signed on 2000-12-13. Completion date: 2001-09-30.
$669,888, same as above.Signed on 2004-10-01. Completion date: 2005-09-30.
PENN & SONS INC (4252 CARMICHAEL ROAD; small business) : $3,573,407 in 40 contractsfrom 2002 to 2006
Contracts for Custodial Janitorial Services, Other Housekeeping Services, Maintenance, Repair and Rebuilding of Equipment -- Cleaning Equipment and Supplies, Miscellaneous Items, and moreby Air Force, Department of Veterans Affairs, Army Signed by year:2000: $0; 2001: $0; 2002: $250,436; 2003: $1,235,272; 2004: $814,103; 2005: $839,183; 2006: $434,413.
Biggest contracts:
$530,274 with Air Force for Custodial Janitorial Services. Signed on 2003-10-01. Completion date: 2004-09-30.
$512,505 with Air Force for Other Housekeeping Services. Signed on 2004-10-01. Completion date: 2005-09-30.
$361,324, same as above.Signed on 2003-02-01. Completion date: 2003-09-30.
$262,139, same as above.Signed on 2005-10-01. Completion date: 2006-03-31.
INTEGRATED COMPUTER SOLUTIONS, (4126 CARMICHAEL CT; small business) : $3,055,166 in 21 contractsfrom 2000 to 2006
Contracts for Other ADP and Telecommunications Services (includes data storage on tapes, compact disks, etc.), ADP Facility Operation and Maintenance Services, Automated Information System Design and Integration Services, ADP Support Equipment, and moreby Defense Information Systems Agency, Department of Defense, Air Force, Offices, Boards and Divisions (includes Attorney General, Deputy Attorney General, etc.), and others Signed by year:2000: $146,717; 2001: $197,895; 2002: $499,616; 2003: $858,766; 2004: $394,213; 2005: $1,003,918; 2006: -$45,959.
Biggest contracts:
$412,070 with Defense Information Systems Agency for Other ADP and Telecommunications Services (includes data storage on tapes, compact disks, etc.). Signed on 2005-11-10. Completion date: 2006-11-30.
$394,213 with Department of Defense for ADP Facility Operation and Maintenance Services. Signed on 2004-10-19. Completion date: 2005-11-30.
$394,129 with Defense Information Systems Agency for Other ADP and Telecommunications Services (includes data storage on tapes, compact disks, etc.). Signed on 2005-10-01. Completion date: 2007-09-30.
$393,702 with Defense Information Systems Agency for Automated Information System Design and Integration Services. Signed on 2003-11-13. Completion date: 2004-11-30.
ENVIRONMENTAL SOLUTIONS & TECH (1803 W FOURTH STREET; small business) : $1,255,322 in 21 contractsfrom 2001 to 2005
Contracts for Other Environmental Services, Studies, and Analytical Support, Water Quality Support Services by Army Signed by year:2000: $0; 2001: $269,050; 2002: $198,951; 2003: $409,806; 2004: $240,025; 2005: $137,490; 2006: $0.
Biggest contracts:
$99,790 with Army for Other Environmental Services, Studies, and Analytical Support. Signed on 2005-03-28. Completion date: 2006-08-31.
$99,713, same as above.Signed on 2003-03-11. Completion date: 2003-06-15.
$99,691, same as above.Signed on 2004-05-19. Completion date: 2005-05-31.
$99,691, same as above.Signed on 2003-02-13. Completion date: 2004-04-30.
BULLARD-COOK INC (1831 GILLESPIE DR; small business) : $1,094,636 in 12 contractsfrom 2003 to 2006
Contracts for Construction of Structures and Facilities -- Other Industrial Buildings, Construction of Structures and Facilities -- Miscellaneous Buildings by Army Signed by year:2000: $0; 2001: $0; 2002: $0; 2003: $515,000; 2004: $9,450; 2005: $552,204; 2006: $17,982.
Biggest contracts:
$549,400 with Army for Construction of Structures and Facilities -- Other Industrial Buildings. Signed on 2005-09-09. Completion date: 2006-10-13.
$515,000 with Army for Construction of Structures and Facilities -- Miscellaneous Buildings. Signed on 2003-09-29. Completion date: 2004-06-25.
$12,681 with Army for Construction of Structures and Facilities -- Other Industrial Buildings. Signed on 2006-04-25. Completion date: 2006-10-13.
$5,536 with Army for Construction of Structures and Facilities -- Miscellaneous Buildings. Signed on 2004-02-05. Completion date: 2004-06-25.
DATABANK ABS, LLC (1811 BRITTON LANE; small business) : $216,989 in 2 contractsfrom 2000 to 2002
$151,700 with Army for Installation of Equipment -- Miscellaneous. Taking place in GA. Signed on 2002-02-11. Completion date: 2002-04-22.
$65,289 with Army for Miscellaneous Office Machines. Taking place in ME. Signed on 2000-09-29. Completion date: 2000-12-01.
ROYAL TYPEWRITER COMPANY OF MO (1555 LAKE ST; small business) : $125,065 in 7 contractsfrom 2000 to 2005
Contracts for Printing, Duplicating, and Bookbinding Equipment, Miscellaneous Office Machines, ADP Input/Output and Storage Devices by Army Signed by year:2000: $70,474; 2001: $0; 2002: $0; 2003: $0; 2004: $44,246; 2005: $10,345; 2006: $0.
Biggest contracts:
$36,306 with Army for Printing, Duplicating, and Bookbinding Equipment. Signed on 2000-03-07. Completion date: 2000-04-15.
$34,168, same as above.Signed on 2000-02-25. Completion date: 2000-03-30.
$21,635, same as above.Signed on 2004-09-25. Completion date: 2004-11-15.
$11,985, same as above.Signed on 2004-06-22. Completion date: 2004-07-22.
BTL TECHNOLOGIES INC (4183 CARMICHAEL RD STE C; small business)
$57,867 with Air Force for Medical/Psychiatric Consultation Services. Taking place in TX. Signed on 2006-02-17. Completion date: 2006-09-30.
APARTMENT FINDERS OF MONTGOMER (4252 CARMICHAEL RD STE 223; small business) : $41,665 in 4 contractsin 2004
$18,486 with Air Force for Lodging - Hotel/Motel. Signed on 2004-10-01. Completion date: 2004-10-31.
$18,486, same as above.Signed on 2004-11-01. Completion date: 2004-11-30.
$2,844, same as above.Signed on 2004-10-01. Completion date: 2004-09-30.
$1,849, same as above.Signed on 2004-12-01. Completion date: 2004-12-03.
REAL ESTATE APPRAISERS LLC (4111-A WALL ST; small business) : $30,700 in 2 contractsfrom 2002 to 2004
$17,000 with Army for Topographic Maps, Charts and Geodesic Products. Signed on 2004-09-13. Completion date: 2004-11-23.
$13,700 with U.S. Army Corps of Engineers - civil program financing only for Real Property Appraisals Services (SIC 6531). Signed on 2002-12-09. Completion date: 2002-12-13.
Top industries in this zip code by the number of employees in 2005:
Health Care and Social Assistance: General Medical and Surgical Hospitals (over 1000 employees: 1 establishment)
Health Care and Social Assistance: Offices of Physicians (except Mental Health Specialists) (100-249: 1, 50-99: 2, 20-49: 10, 10-19: 13, 5-9: 19, 1-4: 30)
2016 - 2018 National Fire Incident Reporting System (NFIRS) incidents
Based on the data from the years 2016 - 2018 the average number of fires per year is 51. The highest number of fires - 54 took place in 2017, and the least - 46 in 2018. The data has a dropping trend.
When looking into fire subcategories, the most incidents belonged to: Structure Fires (36.6%), and Outside Fires (35.9%).
Fire incident types reported to NFIRS in Zip Code 36106

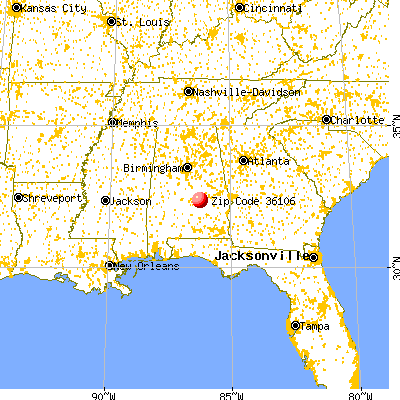


 Nearest zip codes: 36111, 36107, 36109, 36115, 36104, 36116.


 Based on the data from the years 2016 - 2018 the average number of fires per year is 51. The highest number of fires - 54 took place in 2017, and the least - 46 in 2018. The data has a dropping trend.
 When looking into fire subcategories, the most incidents belonged to: Structure Fires (36.6%), and Outside Fires (35.9%).