Estimated zip code population in 2022: 45,862 Zip code population in 2010: 43,790 Zip code population in 2000: 38,411
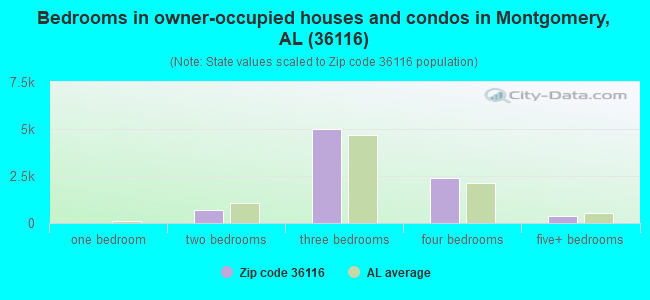
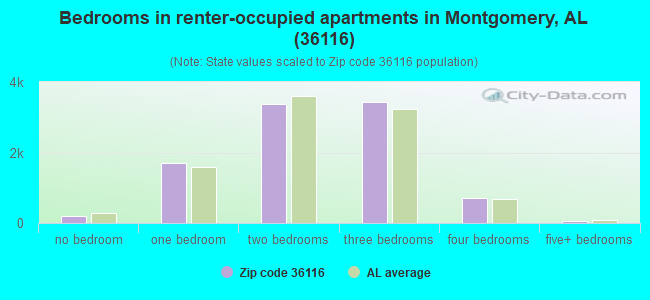
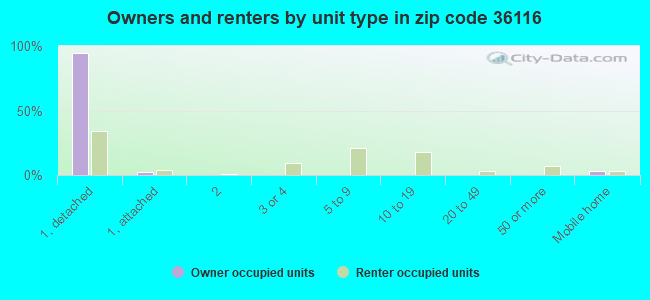
Houses and condos: 20,226 Renter-occupied apartments: 9,445
% of renters here:
52%
State:
30%
March 2022 cost of living index in zip code 36116: 84.8 (less than average, U.S. average is 100)
Land area: 56.1 sq. mi. Water area: 0.7 sq. mi.
Population density: 818 people per square mile
(low).
OSM Map
General Map
Google Map
MSN Map
OSM Map
General Map
Google Map
MSN Map
OSM Map
General Map
Google Map
MSN Map
OSM Map
General Map
Google Map
MSN Map
Please wait while loading the map...
Real estate property taxes paid for housing units in 2022:
This zip code:
0.3% ($493)
Alabama:
0.4% ($718)
Median real estate property taxes paid for housing units with mortgages in 2022: $513 (0.3%) Median real estate property taxes paid for housing units with no mortgage in 2022: $426 (0.4%)
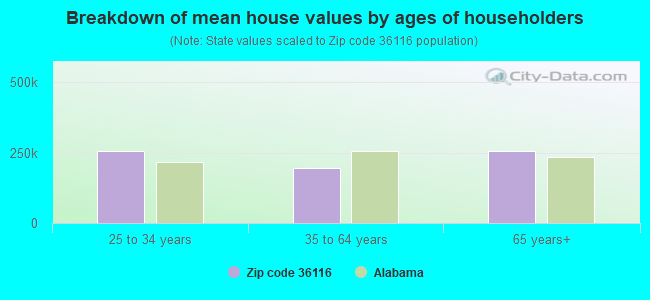
Estimated median house/condo value in 2022: $147,036
36116:
$147,036
Alabama:
$200,900
According to our research of Alabama and other state lists, there were 49 registered sex offenders living in 36116 zip code as of April 27, 2024. The ratio of all residents to sex offenders in zip code 36116 is 921 to 1. The ratio of registered sex offenders to all residents in this zip code is lower than the state average.
Median resident age:
This zip code:
34.0 years
Alabama median age:
39.6 years
Average household size:
This zip code:
2.5 people
Alabama:
2.5 people
Averages for the 2020 tax year for zip code 36116, filed in 2021:
Average Adjusted Gross Income (AGI) in 2020: $44,894 (Individual Income Tax Returns)
Here:
$44,894
State:
$63,984
Salary/wage: $38,200 (reported on 87.4% of returns)
Here:
$38,200
State:
$52,834
(% of AGI for various income ranges: 1305.2% for AGIs below $25k, 3921.1% for AGIs $25k-50k, 7512.0% for AGIs $50k-75k, 10424.1% for AGIs $75k-100k, 20128.0% for AGIs $100k-200k, 80069.0% for AGIs over 200k)
Taxable interest for individuals: $1,366 (reported on 16.2% of returns)
This zip code:
$1,366
Alabama:
$1,615
(% of AGI for various income ranges: 3.5% for AGIs below $25k, 7.6% for AGIs $25k-50k, 19.1% for AGIs $50k-75k, 51.2% for AGIs $75k-100k, 142.4% for AGIs $100k-200k, 2281.0% for AGIs over 200k)
Ordinary dividends: $6,102 (reported on 6.9% of returns)
Here:
$6,102
State:
$7,660
(% of AGI for various income ranges: 4.7% for AGIs below $25k, 8.7% for AGIs $25k-50k, 38.9% for AGIs $50k-75k, 98.1% for AGIs $75k-100k, 329.3% for AGIs $100k-200k, 4392.0% for AGIs over 200k)
Net capital gain/loss in AGI: +$18,016 (reported on 5.9% of returns)
Here:
+$18,016
State:
+$23,528
(% of AGI for various income ranges: 0.9% for AGIs below $25k, 7.5% for AGIs $25k-50k, 36.8% for AGIs $50k-75k, 99.4% for AGIs $75k-100k, 460.0% for AGIs $100k-200k, 16271.0% for AGIs over 200k)
Profit/loss from business: +$2,947 (reported on 17.5% of returns)
Here:
+$2,947
State:
+$9,534
(% of AGI for various income ranges: 37.9% for AGIs below $25k, 123.4% for AGIs $75k-100k, 445.4% for AGIs $100k-200k, 7137.0% for AGIs over 200k)
Taxable individual retirement arrangement distribution: $14,564 (reported on 3.5% of returns)
36116:
$14,564
Alabama:
$19,004
(% of AGI for various income ranges: 11.3% for AGIs below $25k, 27.2% for AGIs $25k-50k, 85.9% for AGIs $50k-75k, 203.6% for AGIs $75k-100k, 690.6% for AGIs $100k-200k, 1381.0% for AGIs over 200k)
Self-employed (Keogh) retirement plans: $27,633 (reported on 0.2% of returns)
36116:
$27,633
Alabama:
$26,467
(% of AGI for various income ranges: 829.0% for AGIs over 200k)
Total itemized deductions: $30,202 (reported on 6.6% of returns)
Here:
$30,202
State:
$37,338
(% of AGI for various income ranges: 20.0% for AGIs below $25k, 93.1% for AGIs $25k-50k, 417.8% for AGIs $50k-75k, 757.3% for AGIs $75k-100k, 1790.2% for AGIs $100k-200k, 11515.0% for AGIs over 200k)
Charity contributions: $13,160 (reported on 5.9% of returns)
Here:
$13,160
State:
$18,005
(% of AGI for various income ranges: 2.9% for AGIs below $25k, 32.0% for AGIs $25k-50k, 154.0% for AGIs $50k-75k, 263.0% for AGIs $75k-100k, 742.0% for AGIs $100k-200k, 5297.0% for AGIs over 200k)
Taxes paid: $4,740 (reported on 6.5% of returns)
36116:
$4,740
State:
$6,484
(% of AGI for various income ranges: 1.6% for AGIs below $25k, 10.1% for AGIs $25k-50k, 62.9% for AGIs $50k-75k, 115.8% for AGIs $75k-100k, 326.3% for AGIs $100k-200k, 1844.0% for AGIs over 200k)
Earned income credit: $2,900 (reported on 34.1% of returns)
Here:
$2,900
State:
$2,628
(% of AGI for various income ranges: 195.1% for AGIs below $25k, 116.4% for AGIs $25k-50k)
Percentage of individuals using paid preparers for their 2020 taxes: 90.5%
Here:
91%
State:
93%
(% for various income ranges: 91.4% for AGIs below $25k, 90.7% for AGIs $25k-50k, 88.0% for AGIs $50k-75k, 88.9% for AGIs $75k-100k, 89.1% for AGIs $100k-200k, 94.3% for AGIs over 200k)
Averages for the 2012 tax year for zip code 36116, filed in 2013:
Average Adjusted Gross Income (AGI) in 2012: $37,138 (Individual Income Tax Returns)
Here:
$37,138
State:
$52,001
Salary/wage: $33,270 (reported on 89.8% of returns)
Here:
$33,270
State:
$43,822
(% of AGI for various income ranges: 87.6% for AGIs below $25k, 91.3% for AGIs $25k-50k, 82.7% for AGIs $50k-75k, 76.0% for AGIs $75k-100k, 72.2% for AGIs $100k-200k, 57.7% for AGIs over 200k)
Taxable interest for individuals: $1,204 (reported on 14.9% of returns)
This zip code:
$1,204
Alabama:
$1,592
(% of AGI for various income ranges: 0.2% for AGIs below $25k, 0.2% for AGIs $25k-50k, 0.5% for AGIs $50k-75k, 0.7% for AGIs $75k-100k, 0.6% for AGIs $100k-200k, 1.2% for AGIs over 200k)
Ordinary dividends: $3,720 (reported on 6.7% of returns)
Here:
$3,720
State:
$5,697
(% of AGI for various income ranges: 0.3% for AGIs below $25k, 0.3% for AGIs $25k-50k, 0.6% for AGIs $50k-75k, 0.6% for AGIs $75k-100k, 1.2% for AGIs $100k-200k, 1.5% for AGIs over 200k)
Net capital gain/loss in AGI: +$6,853 (reported on 4.8% of returns)
Here:
+$6,853
State:
+$13,286
(% of AGI for various income ranges: 0.2% for AGIs $75k-100k, 0.9% for AGIs $100k-200k, 6.2% for AGIs over 200k)
Profit/loss from business: +$5,011 (reported on 16.0% of returns)
Here:
+$5,011
State:
+$9,151
(% of AGI for various income ranges: 5.7% for AGIs below $25k, 0.6% for AGIs $50k-75k, 1.4% for AGIs $75k-100k, 2.5% for AGIs $100k-200k, 5.0% for AGIs over 200k)
Taxable individual retirement arrangement distribution: $13,637 (reported on 3.6% of returns)
36116:
$13,637
Alabama:
$14,992
(% of AGI for various income ranges: 0.6% for AGIs below $25k, 0.6% for AGIs $25k-50k, 1.5% for AGIs $50k-75k, 2.3% for AGIs $75k-100k, 2.3% for AGIs $100k-200k, 1.6% for AGIs over 200k)
Self-employment retirement plans: $28,533 (reported on 0.2% of returns)
36116:
$28,533
Alabama:
$20,904
Total itemized deductions: $18,208 (24% of AGI, reported on 25.6% of returns)
Here:
$18,208
State:
$21,388
Here:
24.1% of AGI
State:
20.1% of AGI
(% of AGI for various income ranges: 5.3% for AGIs below $25k, 12.6% for AGIs $25k-50k, 16.3% for AGIs $50k-75k, 15.6% for AGIs $75k-100k, 15.4% for AGIs $100k-200k, 12.2% for AGIs over 200k)
Charity contributions: $5,369 (reported on 23.4% of returns)
Here:
$5,369
State:
$5,925
(% of AGI for various income ranges: 0.9% for AGIs below $25k, 3.1% for AGIs $25k-50k, 4.4% for AGIs $50k-75k, 4.7% for AGIs $75k-100k, 4.6% for AGIs $100k-200k, 3.7% for AGIs over 200k)
Taxes paid: $3,512 (reported on 25.4% of returns)
36116:
$3,512
State:
$5,272
(% of AGI for various income ranges: 0.6% for AGIs below $25k, 1.8% for AGIs $25k-50k, 2.8% for AGIs $50k-75k, 3.0% for AGIs $75k-100k, 3.5% for AGIs $100k-200k, 4.0% for AGIs over 200k)
Earned income credit: $3,023 (reported on 39.2% of returns)
Here:
$3,023
State:
$2,646
(% of AGI for various income ranges: 14.2% for AGIs below $25k, 1.6% for AGIs $25k-50k)
Percentage of individuals using paid preparers for their 2012 taxes: 55.4%
Here:
55%
State:
60%
(% for various income ranges: 57.6% for AGIs below $25k, 52.9% for AGIs $25k-50k, 51.1% for AGIs $50k-75k, 53.2% for AGIs $75k-100k, 52.6% for AGIs $100k-200k, 71.4% for AGIs over 200k)
Averages for the 2004 tax year for zip code 36116, filed in 2005:
Average Adjusted Gross Income (AGI) in 2004: $32,361 (Individual Income Tax Returns)
Here:
$32,361
State:
$42,302
Salary/wage: $29,647 (reported on 91.6% of returns)
Here:
$29,647
State:
$36,626
(% of AGI for various income ranges: 114.4% for AGIs below $10k, 92.7% for AGIs $10k-25k, 91.3% for AGIs $25k-50k, 85.3% for AGIs $50k-75k, 81.4% for AGIs $75k-100k, 63.9% for AGIs over 100k)
Taxable interest for individuals: $1,212 (reported on 19.7% of returns)
This zip code:
$1,212
Alabama:
$1,827
(% of AGI for various income ranges: 2.0% for AGIs below $10k, 0.4% for AGIs $10k-25k, 0.4% for AGIs $25k-50k, 0.6% for AGIs $50k-75k, 1.1% for AGIs $75k-100k, 1.2% for AGIs over 100k)
Taxable dividends: $2,655 (reported on 9.4% of returns)
Here:
$2,655
State:
$4,206
(% of AGI for various income ranges: 2.0% for AGIs below $10k, 0.3% for AGIs $10k-25k, 0.4% for AGIs $25k-50k, 0.6% for AGIs $50k-75k, 0.7% for AGIs $75k-100k, 1.6% for AGIs over 100k)
Net capital gain/loss: +$13,384 (reported on 6.7% of returns)
Here:
+$13,384
State:
+$13,031
(% of AGI for various income ranges: 0.4% for AGIs below $10k, 0.0% for AGIs $10k-25k, 0.0% for AGIs $25k-50k, 0.3% for AGIs $50k-75k, 0.7% for AGIs $75k-100k, 11.6% for AGIs over 100k)
Profit/loss from business: +$3,331 (reported on 15.2% of returns)
Here:
+$3,331
State:
+$8,302
(% of AGI for various income ranges: -2.8% for AGIs below $10k, 0.9% for AGIs $10k-25k, -0.4% for AGIs $25k-50k, 1.5% for AGIs $50k-75k, 1.9% for AGIs $75k-100k, 4.9% for AGIs over 100k)
IRA payment deduction: $2,628 (reported on 1.2% of returns)
36116:
$2,628
Alabama:
$3,006
(% of AGI for various income ranges: 0.1% for AGIs $10k-25k, 0.1% for AGIs $25k-50k, 0.1% for AGIs $50k-75k, 0.1% for AGIs $75k-100k, 0.1% for AGIs over 100k)
Self-employed pension: $25,833 (reported on 0.2% of returns)
Here:
$25,833
Alabama:
$17,165
Total itemized deductions: $15,256 (25% of AGI, reported on 29.2% of returns)
Here:
$15,256
State:
$17,623
Here:
24.8% of AGI
State:
20.8% of AGI
(% of AGI for various income ranges: 8.9% for AGIs below $10k, 6.6% for AGIs $10k-25k, 15.4% for AGIs $25k-50k, 18.0% for AGIs $50k-75k, 16.6% for AGIs $75k-100k, 14.0% for AGIs over 100k)
Charity contributions deductions: $4,317 (7% of AGI, reported on 27.1% of returns)
Here:
$4,317
State:
$4,768
Here:
6.9% of AGI
State:
5.4% of AGI
(% of AGI for various income ranges: 0.9% for AGIs below $10k, 1.3% for AGIs $10k-25k, 3.8% for AGIs $25k-50k, 5.0% for AGIs $50k-75k, 4.6% for AGIs $75k-100k, 4.2% for AGIs over 100k)
Total tax: $4,788 (reported on 56.5% of returns)
36116:
$4,788
State:
$6,905
(% of AGI for various income ranges: 2.5% for AGIs below $10k, 2.1% for AGIs $10k-25k, 5.2% for AGIs $25k-50k, 8.5% for AGIs $50k-75k, 10.4% for AGIs $75k-100k, 17.3% for AGIs over 100k)
Earned income credit: $2,440 (reported on 40.9% of returns)
Here:
$2,440
State:
$2,048
Percentage of individuals using paid preparers for their 2004 taxes: 59.6%
Here:
60%
State:
65%
(% for various income ranges: 54.4% for AGIs below $10k, 65.3% for AGIs $10k-25k, 58.5% for AGIs $25k-50k, 53.9% for AGIs $50k-75k, 53.6% for AGIs $75k-100k, 56.0% for AGIs over 100k)
Likely homosexual households (counted as self-reported same-sex unmarried-partner households)
Lesbian couples: 0.0% of all households
Gay men: 0.1% of all households
Household received Food Stamps/SNAP in the past 12 months: 4,376 Household did not receive Food Stamps/SNAP in the past 12 months: 13,849
Women who had a birth in the past 12 months: 631 (391 now married, 224 unmarried) Women who did not have a birth in the past 12 months: 11,790 (3,135 now married, 8,671 unmarried)
Housing units in zip code 36116 with a mortgage: 6,316 (560 second mortgage, 273 both second mortgage and home equity loan) Houses without a mortgage: 65
Median monthly owner costs for units with a mortgage: $1,157 Median monthly owner costs for units without a mortgage: $405
Residents with income below the poverty level in 2022:
This zip code:
24.7%
Whole state:
16.2%
Residents with income below 50% of the poverty level in 2022:
This zip code:
13.5%
Whole state:
8.6%
Median number of rooms in houses and condos:
Here:
6.5
State:
6.5
Median number of rooms in apartments:
Here:
4.5
State:
4.7
Notable locations in this zip code not listed on our city pages
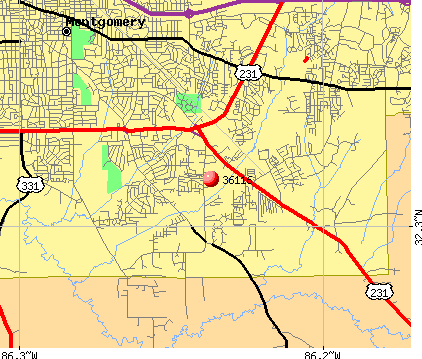
Notable locations in zip code 36116: Colonial Acres Country Club (A), Rolling Hills Golf and Racquet Club (B), Macedonia Neighborhood Center (C), Pinedale Community Center (D), Rolling Hills Lakes Volunteer Fire Department (E), Montgomery Fire Department Station 9 (F). Display/hide their locations on the map
Shopping Centers: Norman Bridge South Shopping Center (1), Twin Oaks Village Shopping Center (2), Vaughn Plaza Shopping Center (3), Capital Plaza Shopping Center (4). Display/hide their locations on the map
Churches in zip code 36116 include: Oak Grove Church (A), Our Lady Queen of Mercy Church (B), Troy Chapel (C), Bethelonnia Church (D), Aldersgate Church (E), Woodley Road Alliance Church (F), Woodley East Church (G), Valley Park Baptist Church (H), Temple Baptist Church (I). Display/hide their locations on the map
Lakes and reservoirs: Miller Pond (A), Lake Lecroy (B), Brewbaker Lake (C), Brewbaker Number Two Lake (D), Herman Gibson Lake (E), Davis Lake Number Two (F), Rhodes Lake (G), Rolling Lake (H). Display/hide their locations on the map
3,804 married couples with children.
6,765 single-parent households (898 men, 5,867 women).
93.9% of residents of 36116 zip code speak English at home.
2.1% of residents speak Spanish at home (60% very well, 12% well, 12% not well, 16% not at all).
1.8% of residents speak other Indo-European language at home (76% very well, 15% well, 9% not well).
1.5% of residents speak Asian or Pacific Island language at home (72% very well, 14% well, 12% not well, 2% not at all).
0.4% of residents speak other language at home (84% very well, 16% well).
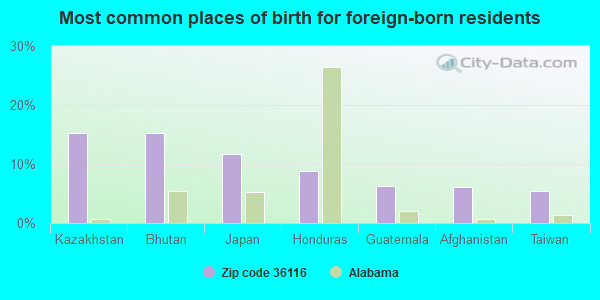
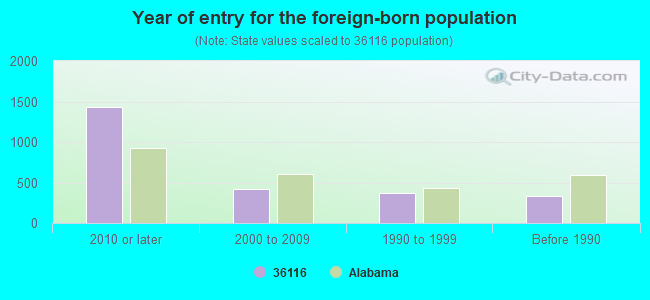
Foreign born population: 2,159 (4.7%) (27.5% of them are naturalized citizens)
Major facilities with environmental interests located in this zip code:
COBB PONTIAC-CADILLAC INC (2820 EASTERN BYPASS in MONTGOMERY, AL)
AIR MINOR (AIRS/AFS) (Integrated Compliance Information System) - ICIS-04-1999-0029, FORMAL ENFORCEMENT ACTION Conditionally Exempt Small Quantity Generators, less than 100 kg/month of hazardous waste (Resource Conservation and Recovery Act (tracking hazardous waste)) Business SIC classification: GENERAL AUTOMOTIVE REPAIR SHOPS Business NAICS classification: GENERAL AUTOMOTIVE REPAIR.; AUTOMOTIVE BODY, PAINT, AND INTERIOR REPAIR AND MAINTENANCE.; AUTOMOTIVE OIL CHANGE AND LUBRICATION SHOPS. Organizations: GREG JOHNSEN (CONTACT/OPERATOR)
, SONIC AUTOMOTIVE (CONTACT/OWNER)
Alternative names: CLASSIC CADILLAC PONTIAC
QUALITY ANALYTICAL LABORATORIES INC (2567 FAIRLANE DRIVE in MONTGOMERY, AL)
STATE MASTER (New Jersey environmental info) - NJEMS-AL537, LABORATORY CERTIFICATION (Resource Conservation and Recovery Act (tracking hazardous waste)) Organizations: OPERNAME (CONTACT/OPERATOR)
, ARONOV REALTY INC (CONTACT/OWNER)
APPLETON WIRE (5655 BELL RD. in MONTGOMERY, AL)
National Pollutant Discharge Elimination System NON-MAJOR (Tracking pollutant discharge elimination systems) - permit (Resource Conservation and Recovery Act (tracking hazardous waste)) TRI REPORTER (Tracking of toxic chemicals releasing facilities) Business SIC classification: BROADWOVEN FABRIC MILLS, MANMADE FIBER AND SILK; COATED FABRICS, NOT RUBBERIZED Organizations: APPLETON WIRE CO (CONTACT/OWNER)
, ALBANY INTERNATIONAL CORP (CONTACT/OWNER)
Alternative names: ALBANY INTN'L APPLETON WIRE DIVISION
BREWBAKER JUNIOR HIGH SCHOOL (4425 BREWBAKER DR in MONTGOMERY, AL)
(Geographic Names Information System) (National Center for Education Statistics) - STATE ID-0090 Organizations: MONTGOMERY COUNTY (SCHOOL DISTRICT)
MCINNIS SCHOOL (3500 MCINNIS RD in MONTGOMERY, AL)
(Geographic Names Information System) (National Center for Education Statistics) - STATE ID-0455 Organizations: MONTGOMERY COUNTY (SCHOOL DISTRICT)
BREWBAKER INTERMEDIATE SCHOOL (4455 BREWBAKER DR in MONTGOMERY, AL)
(National Center for Education Statistics) - STATE ID-0085 Organizations: MONTGOMERY COUNTY (SCHOOL DISTRICT)
BREWBAKER PRIMARY SCHOOL (4445 BREWBAKER DR in MONTGOMERY, AL)
(National Center for Education Statistics) - STATE ID-0095 Organizations: MONTGOMERY COUNTY (SCHOOL DISTRICT)
BREWBAKER TECHNOLOGY MAGNET HIGH SCHOOL (4405 BREWBAKER DR in MONTGOMERY, AL)
(National Center for Education Statistics) - STATE ID-0097 Organizations: MONTGOMERY COUNTY (SCHOOL DISTRICT)
OAK HILLS WATER COMPANY LAGOON (TROTTMAN ROAD in MONTGOMERY, AL)
National Pollutant Discharge Elimination System NON-MAJOR (Tracking pollutant discharge elimination systems) - permit Business SIC classification: MEMBERSHIP SPORTS AND RECREATION CLUBS
AMERICAN LUBEFAST LLC #609 (3191 EASTERN BLVD in MONTGOMERY, AL)
(Resource Conservation and Recovery Act (tracking hazardous waste)) Business NAICS classification: AUTOMOTIVE OIL CHANGE AND LUBRICATION SHOPS. Alternative names: AMERICAN LUBEFAST LLC CUPER-LUBE #609
MONTGOMERY PUBLIC SCHOOLS PUPIL TRANSPTN (5000 TROY HIGHWAY in MONTGOMERY, AL)
(Resource Conservation and Recovery Act (tracking hazardous waste))
AB DICK COMPANY (1125 E SOUTH BLVD in MONTGOMERY, AL)
PROVOST AVENUE PROPERTY (5947 PROVOST AVENUE in MONTGOMERY, AL)
(Resource Conservation and Recovery Act (tracking hazardous waste))
Housing units lacking complete plumbing facilities: 2.0% Housing units lacking complete kitchen facilities: 2.3%
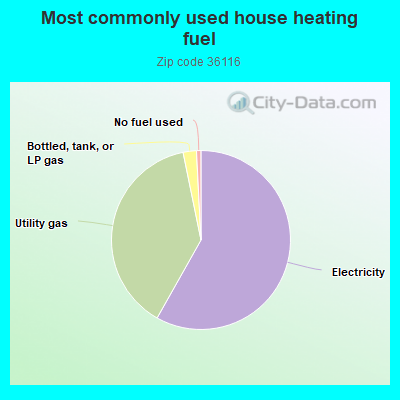
58.0%Electricity
38.5%Utility gas
2.4%Bottled, tank, or LP gas
0.8%No fuel used
Population in 1990: 32,314. Population change in the 1990s: +6,097 (+18.9%).
Place of birth for U.S.-born residents:
This state: 34,669
Northeast: 1,447
Midwest: 1,593
South: 4,673
West: 889
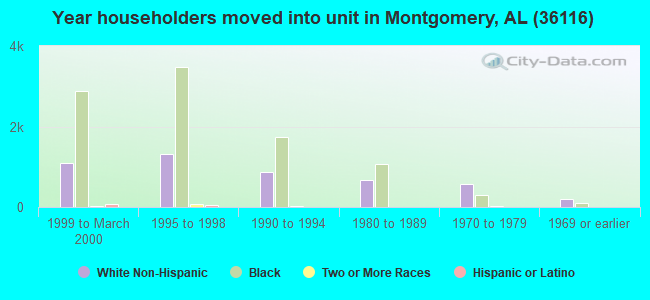
48% of the 36116 zip code residents lived in the same house 5 years ago. Out of people who lived in different houses, 66% lived in this county. Out of people who lived in different counties, 50% lived in Alabama.
81% of the 36116 zip code residents lived in the same house 1 year ago. Out of people who lived in different houses, 56% moved from this county. Out of people who lived in different houses, 9% moved from different county within same state. Out of people who lived in different houses, 25% moved from different state. Out of people who lived in different houses, 8% moved from abroad.
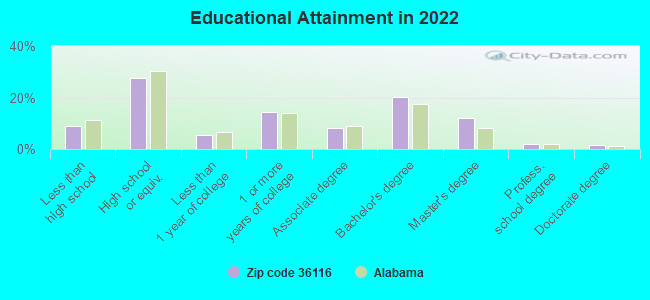
Private vs. public school enrollment:
Students in private schools in grades 1 to 8 (elementary and middle school): 517
Here:
10.6%
Alabama:
14.7%
Students in private schools in grades 9 to 12 (high school): 355
Here:
11.0%
Alabama:
16.3%
Students in private undergraduate colleges: 298
Here:
17.9%
Alabama:
14.6%
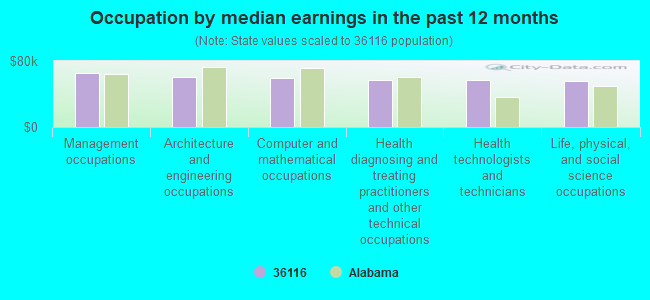
Occupation by median earnings in the past 12 months ($)
65,005Management occupations
60,550Architecture and engineering occupations
59,606Computer and mathematical occupations
56,948Health diagnosing and treating practitioners and other technical occupations
56,479Health technologists and technicians
55,492Life, physical, and social science occupations
Companies with biggest federal contracts located in this zip code (MONTGOMERY, AL):
MMI-FEDERAL MARKETING SERVICE (6101 BREWBAKER BOULEVARD) : $85,644,502 in 86 contractsfrom 1999 to 2006
Contracts for Tents and Tarpaulins, Luggage, Pest, Disease, and Frost Control Equipment, Outerwear, Women's, and moreby Army, Defense Logistics Agency, Navy, Bureau of Land Management, and others Signed by year:2000: $11,576,842; 2001: $11,320,023; 2002: $23,336,340; 2003: $34,934,033; 2004: $2,370,607; 2005: $2,005,406; 2006: $23,251.
Biggest contracts:
$6,084,437 with Army for Tents and Tarpaulins. Taking place in NY. Signed on 2000-09-28. Completion date: 2001-04-12.
$5,845,242 with Army for Luggage. Taking place in NY. Signed on 2001-12-27. Completion date: 2002-08-27.
$5,000,000 with Army for Tents and Tarpaulins. Taking place in NY. Signed on 2000-07-14. Completion date: 2001-01-30.
$4,987,450, same as above.Signed on 2002-12-09. Completion date: 2003-08-07.
ALABAMA DEPARTMENT OF REHABILI (2129 EAST SOUTH BOULEVARD; small business) : $34,719,253 in 228 contractsfrom 1999 to 2006
Contracts for Food Services, Rehabilitative Engineering -- Basic Research (R&D), Vending and Coin Operated Machines by Air Force, Office of the Secretary, Department of Homeland Security, U.S. Coast Guard, Army, and others Signed by year:2000: $932,284; 2001: $0; 2002: $3,793,197; 2003: $4,824,300; 2004: $9,006,365; 2005: $13,804,717; 2006: $1,900,166.
Biggest contracts:
$8,284,780 with Air Force for Food Services. Signed on 2005-10-01. Completion date: 2006-09-30.
$4,186,178, same as above.Signed on 2004-10-01. Completion date: 2005-09-30.
$4,086,000, same as above.Signed on 2003-11-10. Completion date: 2004-09-30.
$3,793,197, same as above.Signed on 2002-10-30. Completion date: 2003-09-30.
THORINGTON ELECTRICAL/CONSTRUC (6117 CHERRY HILL ROAD; small business) : $7,043,587 in 51 contractsfrom 2000 to 2006
Contracts for Construction of Structures and Facilities -- Miscellaneous Buildings, Maintenance, Repair or Alteration of Real Property -- Miscellaneous Buildings, Electrical Control Equipment, Maintenance, Repair or Alteration of Real Property -- Other Administrative Facilities and Service Buildings, and moreby Air Force Signed by year:2000: $1,113,014; 2001: $1,369,591; 2002: $2,610,223; 2003: $16,745; 2004: $0; 2005: $971,413; 2006: $962,601.
Biggest contracts:
$962,601 with Air Force for Construction of Structures and Facilities -- Miscellaneous Buildings. Signed on 2006-04-30. Completion date: 2007-05-10.
$825,288, same as above.Signed on 2005-09-30. Completion date: 2007-02-28.
$581,689 with Air Force for Maintenance, Repair or Alteration of Real Property -- Miscellaneous Buildings. Signed on 2000-03-24. Completion date: 2000-11-20.
$499,620, same as above.Signed on 2001-09-27. Completion date: 2002-03-26.
DAVID ARMSTER (1311 E SOUTH BLVD; small business) : $2,097,072 in 29 contractsfrom 2000 to 2006
Contracts for Maintenance, Repair or Alteration of Real Property -- Hospitals and Infirmaries, Construction of Structures and Facilities -- Office Buildings, Maintenance, Repair or Alteration of Real Property -- Other Administrative Facilities and Service Buildings, Maintenance, Repair or Alteration of Real Property -- Fuel Supply Facilities, and moreby Department of Veterans Affairs, Army, Air Force Signed by year:2000: $100,493; 2001: $58,189; 2002: $33,165; 2003: $509,799; 2004: $656,201; 2005: $734,071; 2006: $5,154.
Biggest contracts:
$484,846 with Department of Veterans Affairs for Maintenance, Repair or Alteration of Real Property -- Hospitals and Infirmaries. Taking place in GA. Signed on 2003-12-31. Completion date: 2005-03-31.
$389,984 with Department of Veterans Affairs for Construction of Structures and Facilities -- Office Buildings. Signed on 2005-08-22. Completion date: 2006-06-30.
$260,869 with Army for Maintenance, Repair or Alteration of Real Property -- Other Administrative Facilities and Service Buildings. Signed on 2005-05-04. Completion date: 2005-09-27.
$259,895 with Army for Maintenance, Repair or Alteration of Real Property -- Fuel Supply Facilities. Signed on 2004-09-26. Completion date: 2005-04-05.
QUALISYS, L L C (2540 FAIRLANE DRIVE) : $850,900 in 14 contractsfrom 2000 to 2004
Contracts for ADPE System Configuration, ADP Software, Other ADP and Telecommunications Services (includes data storage on tapes, compact disks, etc.), ADP Support Equipment by Air Force Signed by year:2000: $80,614; 2001: $347,716; 2002: $197,389; 2003: $140,449; 2004: $84,732; 2005: $0; 2006: $0.
Biggest contracts:
$165,934 with Air Force for ADPE System Configuration. Taking place in OH. Signed on 2001-09-27. Completion date: 2002-09-07.
$107,250, same as above.Signed on 2001-09-29. Completion date: 2002-09-28.
$84,732 with Air Force for ADP Software. Signed on 2004-01-13. Completion date: 2005-01-12.
$80,614 with Air Force for ADPE System Configuration. Signed on 2000-12-22. Completion date: 2001-09-30.
POMEROY IT SOLUTIONS (2567 FAIRLANE DR SUITE 400) : $352,000 in 10 contractsfrom 2002 to 2006
Contracts for Installation of Equipment -- Communication, Detection, and Coherent Radiation Equipment, Telephone and Telegraph Equipment, Maintenance, Repair and Rebuilding of Equipment -- Communication, Detection, and Coherent Radiation Equipment, Maintenance, Repair and Rebuilding of Equipment -- Automatic Data Processing Equipment (Including Firmware), Software, Supplies and Support Equipment by Air Force, Army Signed by year:2000: $0; 2001: $0; 2002: $316,000; 2003: $12,000; 2004: $12,000; 2005: $4,500; 2006: $7,500.
Biggest contracts:
$316,000 with Air Force for Installation of Equipment -- Communication, Detection, and Coherent Radiation Equipment. Signed on 2002-06-21. Completion date: 2002-08-13.
$12,000 with Army for Telephone and Telegraph Equipment. Signed on 2004-10-07. Completion date: 2005-09-30.
$12,000 with Army for Maintenance, Repair and Rebuilding of Equipment -- Communication, Detection, and Coherent Radiation Equipment. Signed on 2003-10-08. Completion date: 2004-09-30.
$5,000 with Army for Maintenance, Repair and Rebuilding of Equipment -- Automatic Data Processing Equipment (Including Firmware), Software, Supplies and Support Equipment. Signed on 2006-03-31. Completion date: 2006-09-30.
W AND W ENTERPRISES,LLC (6565 NARROWLANE ROAD; small business) : $276,889 in 15 contractsfrom 2000 to 2006
Contracts for Maintenance, Repair or Alteration of Real Property -- Miscellaneous Buildings, Floor Coverings, Maintenance, Repair and Rebuilding of Equipment -- Household and Commercial Furnishings and Appliances, Maintenance, Repair or Alteration of Real Property -- Office Buildings by Air Force, Department of Veterans Affairs Signed by year:2000: $13,499; 2001: $44,954; 2002: $115,120; 2003: $29,191; 2004: $31,090; 2005: $32,339; 2006: $10,696.
Biggest contracts:
$39,271 with Air Force for Maintenance, Repair or Alteration of Real Property -- Miscellaneous Buildings. Signed on 2001-04-27. Completion date: 2001-05-25.
$36,000 with Department of Veterans Affairs for Floor Coverings. Signed on 2002-09-15. Completion date: 2002-09-15.
$32,339 with Air Force for Maintenance, Repair and Rebuilding of Equipment -- Household and Commercial Furnishings and Appliances. Taking place in MS. Signed on 2005-10-03. Completion date: 2006-06-30.
$31,090, same as above.Signed on 2004-10-12. Completion date: 2005-09-30.
SHARON R HUBBERT (4312 MEADOW WALK CT; small business) : $166,006 in 6 contractsfrom 2001 to 2005
Contracts for Program Management/Support Services by Army Signed by year:2000: $0; 2001: $30,006; 2002: $0; 2003: $40,000; 2004: $48,000; 2005: $48,000; 2006: $0.
Biggest contracts:
$48,000 with Army for Program Management/Support Services. Signed on 2005-10-16. Completion date: 2006-09-30.
$40,000, same as above.Signed on 2004-10-22. Completion date: 2003-09-30.
$40,000, same as above.Signed on 2003-10-17. Completion date: 2003-09-30.
$30,006, same as above.Signed on 2001-12-26. Completion date: 2002-09-30.
JANE MCCARTHY (2312 W ABERDEEN DR; small business) : $105,172 in 5 contractsfrom 2003 to 2005
Contracts for Other Professional Services, Landscaping/Groundskeeping Services by Air Force Signed by year:2000: $0; 2001: $0; 2002: $0; 2003: $34,636; 2004: $34,680; 2005: $35,856; 2006: $0.
Biggest contracts:
$34,680 with Air Force for Other Professional Services. Signed on 2004-10-01. Completion date: 2005-09-30.
$34,636 with Air Force for Landscaping/Groundskeeping Services. Signed on 2003-10-01. Completion date: 2004-09-30.
$30,056 with Air Force for Other Professional Services. Signed on 2005-11-30. Completion date: 2006-09-30.
$2,900, same as above.Signed on 2005-10-25. Completion date: 2005-11-30.
MOSES, ROSA B (1051 QUEENSBURY DR; small business)
$33,750 with Army for Food Services. Signed on 2005-10-25. Completion date: 2008-09-30.
Top industries in this zip code by the number of employees in 2005:
Health Care and Social Assistance: General Medical and Surgical Hospitals (over 1000 employees: 1 establishment)
2010 - 2018 National Fire Incident Reporting System (NFIRS) incidents
According to the data from the years 2010 - 2018 the average number of fires per year is 54. The highest number of reported fire incidents - 177 took place in 2018, and the least - 0 in 2012. The data has an increasing trend.
When looking into fire subcategories, the most incidents belonged to: Structure Fires (41.0%), and Outside Fires (32.1%).
Fire incident types reported to NFIRS in Zip Code 36116

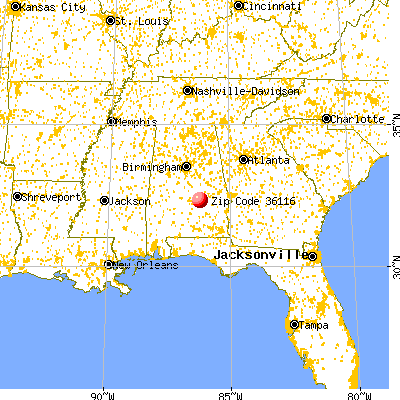


 Nearest zip codes: 36111, 36106, 36105, 36109, 36117, 36107.


 According to the data from the years 2010 - 2018 the average number of fires per year is 54. The highest number of reported fire incidents - 177 took place in 2018, and the least - 0 in 2012. The data has an increasing trend.
 When looking into fire subcategories, the most incidents belonged to: Structure Fires (41.0%), and Outside Fires (32.1%).