Estimated zip code population in 2022: 5,581 Zip code population in 2010: 5,420 Zip code population in 2000: 5,129
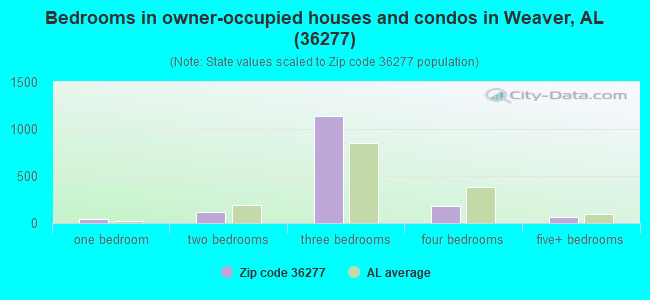
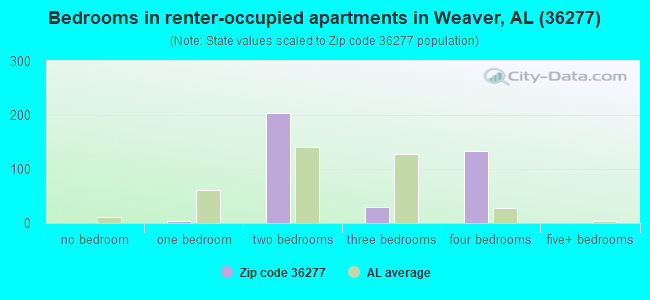
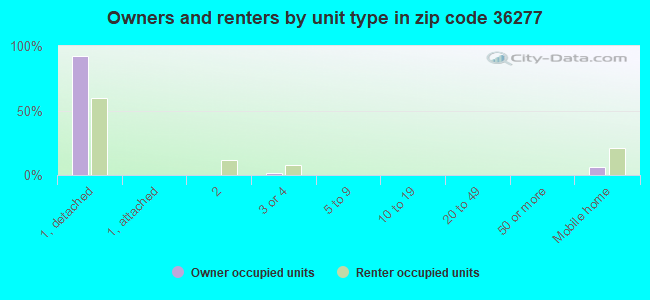
Houses and condos: 2,076 Renter-occupied apartments: 360
% of renters here:
19%
State:
30%
March 2022 cost of living index in zip code 36277: 80.8 (low, U.S. average is 100)
Land area: 8.4 sq. mi. Water area: 0.1 sq. mi.
Population density: 664 people per square mile
(low).
OSM Map
General Map
Google Map
MSN Map
OSM Map
General Map
Google Map
MSN Map
OSM Map
General Map
Google Map
MSN Map
OSM Map
General Map
Google Map
MSN Map
Please wait while loading the map...
Real estate property taxes paid for housing units in 2022:
This zip code:
0.4% ($597)
Alabama:
0.4% ($718)
Median real estate property taxes paid for housing units with mortgages in 2022: $684 (0.4%) Median real estate property taxes paid for housing units with no mortgage in 2022: $389 (0.4%)
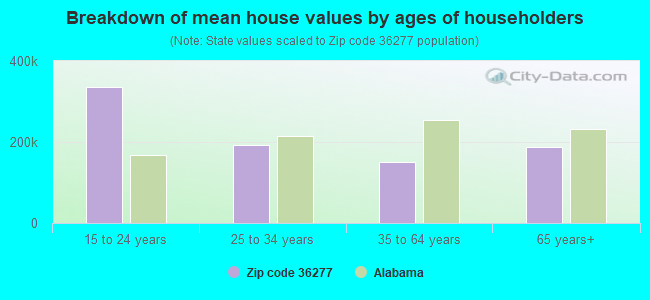
Estimated median house/condo value in 2022: $147,036
36277:
$147,036
Alabama:
$200,900
According to our research of Alabama and other state lists, there were 6 registered sex offenders living in 36277 zip code as of April 27, 2024. The ratio of all residents to sex offenders in zip code 36277 is 877 to 1. The ratio of registered sex offenders to all residents in this zip code is lower than the state average.
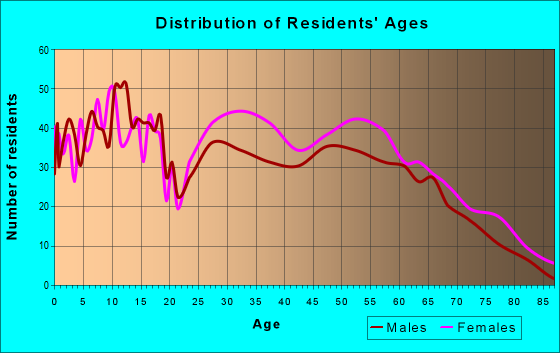
Median resident age:
This zip code:
35.8 years
Alabama median age:
39.6 years
Average household size:
This zip code:
2.9 people
Alabama:
2.5 people
Averages for the 2020 tax year for zip code 36277, filed in 2021:
Average Adjusted Gross Income (AGI) in 2020: $47,339 (Individual Income Tax Returns)
Here:
$47,339
State:
$63,984
Salary/wage: $42,602 (reported on 83.1% of returns)
Here:
$42,602
State:
$52,834
(% of AGI for various income ranges: 1174.1% for AGIs below $25k, 3603.6% for AGIs $25k-50k, 6079.1% for AGIs $50k-75k, 8507.9% for AGIs $75k-100k, 15009.3% for AGIs $100k-200k)
Taxable interest for individuals: $812 (reported on 23.3% of returns)
This zip code:
$812
Alabama:
$1,615
(% of AGI for various income ranges: 7.1% for AGIs below $25k, 20.8% for AGIs $25k-50k, 28.9% for AGIs $50k-75k, 40.5% for AGIs $75k-100k, 85.0% for AGIs $100k-200k)
Ordinary dividends: $3,510 (reported on 8.0% of returns)
Here:
$3,510
State:
$7,660
(% of AGI for various income ranges: 3.8% for AGIs below $25k, 23.9% for AGIs $25k-50k, 18.6% for AGIs $50k-75k, 60.0% for AGIs $75k-100k, 251.4% for AGIs $100k-200k)
Net capital gain/loss in AGI: +$3,811 (reported on 7.2% of returns)
Here:
+$3,811
State:
+$23,528
(% of AGI for various income ranges: 2.0% for AGIs below $25k, 9.3% for AGIs $25k-50k, 30.0% for AGIs $50k-75k, 13.2% for AGIs $75k-100k, 347.1% for AGIs $100k-200k)
Profit/loss from business: +$5,984 (reported on 12.4% of returns)
Here:
+$5,984
State:
+$9,534
(% of AGI for various income ranges: 83.2% for AGIs below $25k, 9.5% for AGIs $25k-50k, 21.7% for AGIs $50k-75k, 174.7% for AGIs $75k-100k, 600.0% for AGIs $100k-200k)
Taxable individual retirement arrangement distribution: $12,156 (reported on 6.4% of returns)
36277:
$12,156
Alabama:
$19,004
(% of AGI for various income ranges: 29.7% for AGIs below $25k, 51.0% for AGIs $25k-50k, 114.6% for AGIs $50k-75k, 136.3% for AGIs $75k-100k, 555.7% for AGIs $100k-200k)
Total itemized deductions: $25,450 (reported on 4.0% of returns)
Here:
$25,450
State:
$37,338
(% of AGI for various income ranges: 186.2% for AGIs $25k-50k, 165.1% for AGIs $50k-75k, 593.6% for AGIs $100k-200k)
Charity contributions: $12,975 (reported on 3.2% of returns)
Here:
$12,975
State:
$18,005
(% of AGI for various income ranges: 63.8% for AGIs $25k-50k, 75.4% for AGIs $50k-75k, 275.0% for AGIs $100k-200k)
Taxes paid: $3,811 (reported on 3.6% of returns)
36277:
$3,811
State:
$6,484
(% of AGI for various income ranges: 8.5% for AGIs $25k-50k, 25.1% for AGIs $50k-75k, 145.0% for AGIs $100k-200k)
Earned income credit: $2,412 (reported on 20.5% of returns)
Here:
$2,412
State:
$2,628
(% of AGI for various income ranges: 115.9% for AGIs below $25k, 76.2% for AGIs $25k-50k)
Percentage of individuals using paid preparers for their 2020 taxes: 94.8%
Here:
95%
State:
93%
(% for various income ranges: 93.9% for AGIs below $25k, 94.7% for AGIs $25k-50k, 97.7% for AGIs $50k-75k, 96.0% for AGIs $75k-100k, 90.9% for AGIs $100k-200k)
Averages for the 2012 tax year for zip code 36277, filed in 2013:
Average Adjusted Gross Income (AGI) in 2012: $39,886 (Individual Income Tax Returns)
Here:
$39,886
State:
$52,001
Salary/wage: $37,907 (reported on 81.6% of returns)
Here:
$37,907
State:
$43,822
(% of AGI for various income ranges: 71.4% for AGIs below $25k, 78.4% for AGIs $25k-50k, 78.4% for AGIs $50k-75k, 83.9% for AGIs $75k-100k, 72.9% for AGIs $100k-200k)
Taxable interest for individuals: $706 (reported on 25.9% of returns)
This zip code:
$706
Alabama:
$1,592
(% of AGI for various income ranges: 0.8% for AGIs below $25k, 0.4% for AGIs $25k-50k, 0.3% for AGIs $50k-75k, 0.5% for AGIs $75k-100k, 0.4% for AGIs $100k-200k)
Ordinary dividends: $1,455 (reported on 9.2% of returns)
Here:
$1,455
State:
$5,697
(% of AGI for various income ranges: 0.7% for AGIs below $25k, 0.2% for AGIs $25k-50k, 0.3% for AGIs $50k-75k, 0.2% for AGIs $75k-100k, 0.4% for AGIs $100k-200k)
Profit/loss from business: +$3,852 (reported on 13.0% of returns)
Here:
+$3,852
State:
+$9,151
(% of AGI for various income ranges: 5.7% for AGIs below $25k, 0.8% for AGIs $25k-50k, 0.5% for AGIs $50k-75k, 0.1% for AGIs $75k-100k, 0.9% for AGIs $100k-200k)
Taxable individual retirement arrangement distribution: $8,735 (reported on 7.1% of returns)
36277:
$8,735
Alabama:
$14,992
(% of AGI for various income ranges: 1.8% for AGIs below $25k, 1.6% for AGIs $25k-50k, 1.4% for AGIs $50k-75k, 3.0% for AGIs $75k-100k)
Total itemized deductions: $15,819 (25% of AGI, reported on 23.8% of returns)
Here:
$15,819
State:
$21,388
Here:
25.0% of AGI
State:
20.1% of AGI
(% of AGI for various income ranges: 6.9% for AGIs below $25k, 9.7% for AGIs $25k-50k, 9.3% for AGIs $50k-75k, 10.1% for AGIs $75k-100k, 10.6% for AGIs $100k-200k)
Charity contributions: $4,340 (reported on 20.1% of returns)
Here:
$4,340
State:
$5,925
(% of AGI for various income ranges: 0.9% for AGIs below $25k, 1.9% for AGIs $25k-50k, 2.4% for AGIs $50k-75k, 2.7% for AGIs $75k-100k, 2.7% for AGIs $100k-200k)
Taxes paid: $3,027 (reported on 23.4% of returns)
36277:
$3,027
State:
$5,272
(% of AGI for various income ranges: 0.6% for AGIs below $25k, 1.3% for AGIs $25k-50k, 1.7% for AGIs $50k-75k, 2.3% for AGIs $75k-100k, 2.9% for AGIs $100k-200k)
Earned income credit: $2,305 (reported on 24.3% of returns)
Here:
$2,305
State:
$2,646
(% of AGI for various income ranges: 7.9% for AGIs below $25k, 1.5% for AGIs $25k-50k)
Percentage of individuals using paid preparers for their 2012 taxes: 54.4%
Here:
54%
State:
60%
(% for various income ranges: 50.0% for AGIs below $25k, 53.6% for AGIs $25k-50k, 61.0% for AGIs $50k-75k, 60.0% for AGIs $75k-100k, 61.5% for AGIs $100k-200k)
Averages for the 2004 tax year for zip code 36277, filed in 2005:
Average Adjusted Gross Income (AGI) in 2004: $33,722 (Individual Income Tax Returns)
Here:
$33,722
State:
$42,302
Salary/wage: $31,864 (reported on 83.5% of returns)
Here:
$31,864
State:
$36,626
(% of AGI for various income ranges: 80.6% for AGIs below $10k, 70.9% for AGIs $10k-25k, 79.3% for AGIs $25k-50k, 83.6% for AGIs $50k-75k, 85.3% for AGIs $75k-100k, 66.9% for AGIs over 100k)
Taxable interest for individuals: $819 (reported on 35.4% of returns)
This zip code:
$819
Alabama:
$1,827
(% of AGI for various income ranges: 3.8% for AGIs below $10k, 1.7% for AGIs $10k-25k, 0.7% for AGIs $25k-50k, 0.5% for AGIs $50k-75k, 0.5% for AGIs $75k-100k, 0.9% for AGIs over 100k)
Taxable dividends: $1,132 (reported on 11.9% of returns)
Here:
$1,132
State:
$4,206
(% of AGI for various income ranges: 0.4% for AGIs below $10k, 1.0% for AGIs $10k-25k, 0.3% for AGIs $25k-50k, 0.2% for AGIs $50k-75k, 0.1% for AGIs $75k-100k, 0.7% for AGIs over 100k)
Net capital gain/loss: +$751 (reported on 8.7% of returns)
Here:
+$751
State:
+$13,031
(% of AGI for various income ranges: -0.4% for AGIs below $10k, -0.2% for AGIs $10k-25k, 0.1% for AGIs $25k-50k, 0.1% for AGIs $50k-75k, -0.0% for AGIs $75k-100k, 1.9% for AGIs over 100k)
Profit/loss from business: +$4,655 (reported on 11.1% of returns)
Here:
+$4,655
State:
+$8,302
(% of AGI for various income ranges: 5.8% for AGIs below $10k, 3.7% for AGIs $10k-25k, 1.7% for AGIs $25k-50k, 0.9% for AGIs $50k-75k, 0.5% for AGIs $75k-100k)
IRA payment deduction: $2,941 (reported on 1.4% of returns)
36277:
$2,941
Alabama:
$3,006
Total itemized deductions: $13,921 (25% of AGI, reported on 21.5% of returns)
Here:
$13,921
State:
$17,623
Here:
24.7% of AGI
State:
20.8% of AGI
(% of AGI for various income ranges: 5.6% for AGIs below $10k, 7.0% for AGIs $10k-25k, 7.7% for AGIs $25k-50k, 9.6% for AGIs $50k-75k, 11.3% for AGIs $75k-100k, 10.5% for AGIs over 100k)
Charity contributions deductions: $3,711 (6% of AGI, reported on 19.3% of returns)
Here:
$3,711
State:
$4,768
Here:
6.4% of AGI
State:
5.4% of AGI
(% of AGI for various income ranges: 0.5% for AGIs below $10k, 1.3% for AGIs $10k-25k, 1.8% for AGIs $25k-50k, 2.3% for AGIs $50k-75k, 2.6% for AGIs $75k-100k, 3.5% for AGIs over 100k)
Total tax: $3,653 (reported on 72.0% of returns)
36277:
$3,653
State:
$6,905
(% of AGI for various income ranges: 2.1% for AGIs below $10k, 3.4% for AGIs $10k-25k, 6.0% for AGIs $25k-50k, 8.2% for AGIs $50k-75k, 10.6% for AGIs $75k-100k, 16.3% for AGIs over 100k)
Earned income credit: $1,835 (reported on 20.6% of returns)
Here:
$1,835
State:
$2,048
Percentage of individuals using paid preparers for their 2004 taxes: 67.8%
Here:
68%
State:
65%
(% for various income ranges: 62.7% for AGIs below $10k, 69.5% for AGIs $10k-25k, 72.4% for AGIs $25k-50k, 61.4% for AGIs $50k-75k, 69.3% for AGIs $75k-100k, 70.5% for AGIs over 100k)
Likely homosexual households (counted as self-reported same-sex unmarried-partner households)
Lesbian couples: 1.2% of all households
Gay men: 0.0% of all households
Household received Food Stamps/SNAP in the past 12 months: 279 Household did not receive Food Stamps/SNAP in the past 12 months: 1,628
Women who had a birth in the past 12 months: 40 (0 now married, 31 unmarried) Women who did not have a birth in the past 12 months: 1,372 (786 now married, 584 unmarried)
Housing units in zip code 36277 with a mortgage: 936 (38 second mortgage, 40 both second mortgage and home equity loan) Median monthly owner costs for units with a mortgage: $1,076 Median monthly owner costs for units without a mortgage: $315
Residents with income below the poverty level in 2022:
This zip code:
14.5%
Whole state:
16.2%
Residents with income below 50% of the poverty level in 2022:
This zip code:
9.9%
Whole state:
8.6%
Median number of rooms in houses and condos:
Here:
6.4
State:
6.5
Median number of rooms in apartments:
Here:
4.9
State:
4.7
Notable locations in this zip code not listed on our city pages
Churches in zip code 36277 include: Hall Chapel Congregational Holiness Church (A), West Weaver Baptist Church (B), Weaver First United Methodist Church (C), Weaver Congregational Methodist Church (D), First Baptist Church (E), Jacksonville Congregational Holiness Church (F). Display/hide their locations on the map
Size of family households: 498 2-persons, 384 3-persons, 130 4-persons, 145 5-persons, 147 6-persons, 49 7-or-more-persons
Size of nonfamily households: 447 1-person, 86 2-persons, 16 3-persons
874 married couples with children.
245 single-parent households (133 men, 112 women).
96.4% of residents of 36277 zip code speak English at home.
2.5% of residents speak Spanish at home (64% very well, 36% well).
0.3% of residents speak other Indo-European language at home (100% very well).
0.4% of residents speak Asian or Pacific Island language at home (100% very well).
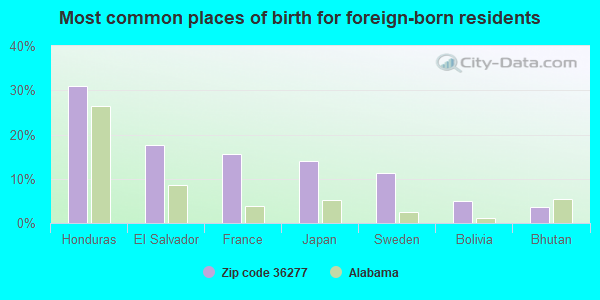
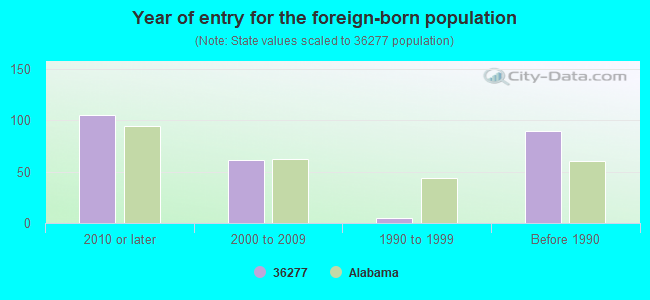
Foreign born population: 151 (2.7%) (43.3% of them are naturalized citizens)
This zip code:
2.7%
Whole state:
3.8%
31%Honduras
18%El Salvador
15%France
14%Japan
11%Sweden
5%Bolivia
4%Bhutan
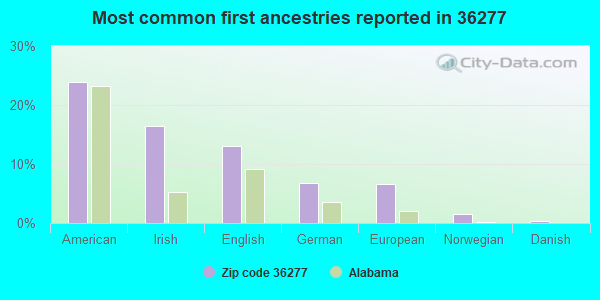
24%American
16%Irish
13%English
7%German
7%European
2%Norwegian
0%Danish
Year of entry for the foreign-born population
1052010 or later
612000 to 2009
51990 to 1999
89Before 1990
Facilities with environmental interests located in this zip code:
WEAVER ELEMENTARY SCHOOL (444 SCHOOL DR in WEAVER, AL)
(Geographic Names Information System) (National Center for Education Statistics) - STATE ID-0175 Organizations: CALHOUN COUNTY (SCHOOL DISTRICT)
WEAVER HIGH SCHOOL (917 CLAIRMONT DR in WEAVER, AL)
(Geographic Names Information System) (National Center for Education Statistics) - STATE ID-0180 Organizations: CALHOUN COUNTY (SCHOOL DISTRICT)
WEAVER CITY OF (THE STATE OF ALABAMA in WEAVER, AL)
National Pollutant Discharge Elimination System NON-MAJOR (Tracking pollutant discharge elimination systems) - permit Business SIC classification: NONCLASSIFIABLE ESTABLISHMENTS
SHINING STAR (GARY PUGH in WEAVER, AL)
National Pollutant Discharge Elimination System NON-MAJOR (Tracking pollutant discharge elimination systems) - permit Business SIC classification: GENERAL CONTRACTORS-SINGLE-FAMILY HOUSES Alternative names: GARY PUGH SHINING STAR
Housing units lacking complete plumbing facilities: 1.8% Housing units lacking complete kitchen facilities: 2.7%
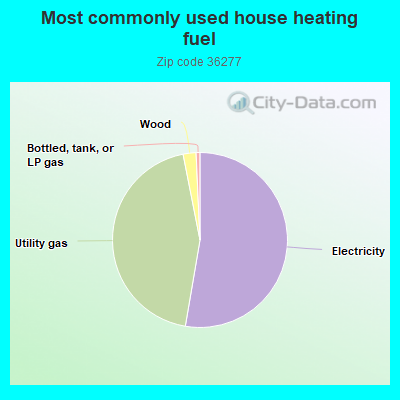
52.8%Electricity
44.3%Utility gas
2.4%Wood
0.7%Bottled, tank, or LP gas
Population in 1990: 7,453.
Place of birth for U.S.-born residents:
This state: 3,923
Northeast: 97
Midwest: 194
South: 980
West: 122
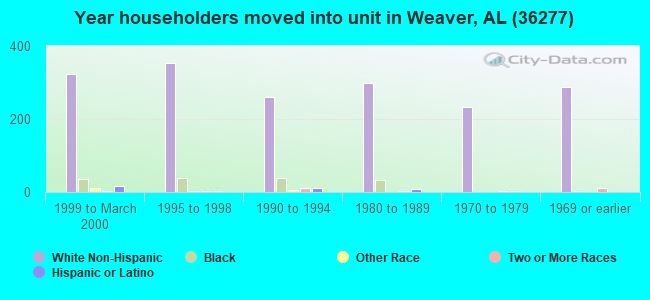
64% of the 36277 zip code residents lived in the same house 5 years ago. Out of people who lived in different houses, 73% lived in this county. Out of people who lived in different counties, 50% lived in Alabama.
81% of the 36277 zip code residents lived in the same house 1 year ago. Out of people who lived in different houses, 70% moved from this county. Out of people who lived in different houses, 7% moved from different county within same state. Out of people who lived in different houses, 17% moved from different state.
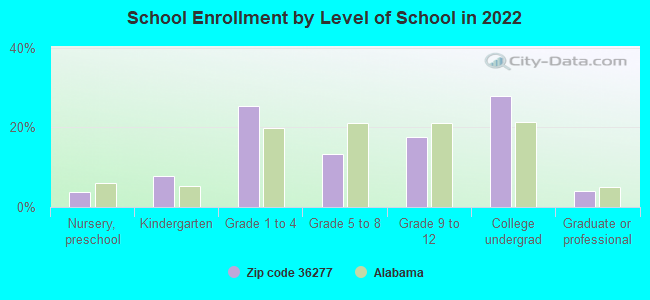
Private vs. public school enrollment:
Students in private schools in grades 1 to 8 (elementary and middle school): 57
Here:
11.2%
Alabama:
14.7%
Students in private schools in grades 9 to 12 (high school): 70
Here:
29.4%
Alabama:
16.3%
Students in private undergraduate colleges: 48
Here:
13.3%
Alabama:
14.6%
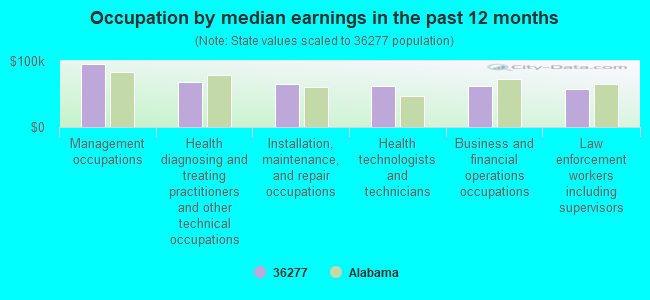
Occupation by median earnings in the past 12 months ($)
94,969Management occupations
68,399Health diagnosing and treating practitioners and other technical occupations
64,526Installation, maintenance, and repair occupations
62,100Health technologists and technicians
61,876Business and financial operations occupations
57,184Law enforcement workers including supervisors
Companies with federal contracts located in this zip code:
VANOVER, REBA (1422 CLAIRMONT DR in WEAVER, AL; small business)
$29,120 with Army for Other Social Services. Signed on 2002-06-18. Completion date: 2003-07-07.
Top industries in this zip code by the number of employees in 2005:
Other Services (except Public Administration): Religious Organizations (5-9 employees: 2 establishments, 1-4 employees: 4 establishments)
Other Services (except Public Administration): Other Personal Care Services (5-9: 1, 1-4: 1)
Construction: Plumbing, Heating, and Air-Conditioning Contractors (5-9: 1)
Construction: Residential Remodelers (1-4: 1)
Health Care and Social Assistance: Offices of All Other Miscellaneous Health Practitioners (1-4: 1)
Finance and Insurance: Direct Property and Casualty Insurance Carriers (1-4: 1)
Other Services (except Public Administration): Labor Unions and Similar Labor Organizations (1-4: 1)
Professional, Scientific, and Technical Services: Human Resources and Executive Search Consulting Services (1-4: 1)
Home Mortgage Disclosure Act Aggregated Statistics For Year 2009 (Based on 2 partial tracts)
A) FHA, FSA/RHS & VA Home Purchase Loans
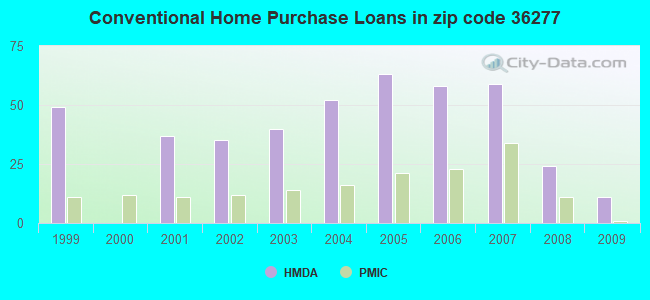
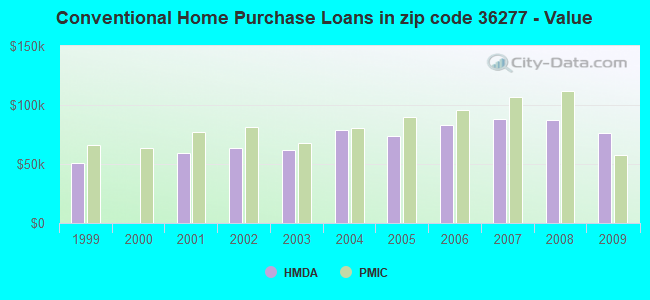
B) Conventional Home Purchase Loans
C) Refinancings
D) Home Improvement Loans
F) Non-occupant Loans on < 5 Family Dwellings (A B C & D)
G) Loans On Manufactured Home Dwelling (A B C & D)
Number
Average Value
Number
Average Value
Number
Average Value
Number
Average Value
Number
Average Value
Number
Average Value
LOANS ORIGINATED
26
$116,899
11
$76,330
67
$107,516
8
$34,561
6
$52,023
5
$41,278
APPLICATIONS APPROVED, NOT ACCEPTED
2
$62,885
1
$46,790
7
$116,391
1
$103,950
1
$39,510
2
$83,050
APPLICATIONS DENIED
4
$84,230
5
$73,244
32
$111,378
7
$48,973
2
$47,595
4
$56,000
APPLICATIONS WITHDRAWN
0
$0
3
$70,053
22
$112,054
1
$3,520
0
$0
0
$0
FILES CLOSED FOR INCOMPLETENESS
1
$182,120
1
$113,200
7
$109,993
0
$0
1
$42,760
0
$0
Aggregated Statistics For Year 2008 (Based on 2 partial tracts)
A) FHA, FSA/RHS & VA Home Purchase Loans
B) Conventional Home Purchase Loans
C) Refinancings
D) Home Improvement Loans
F) Non-occupant Loans on < 5 Family Dwellings (A B C & D)
G) Loans On Manufactured Home Dwelling (A B C & D)
Number
Average Value
Number
Average Value
Number
Average Value
Number
Average Value
Number
Average Value
Number
Average Value
LOANS ORIGINATED
31
$114,018
24
$87,032
69
$91,605
10
$34,618
16
$66,276
5
$43,686
APPLICATIONS APPROVED, NOT ACCEPTED
1
$79,810
2
$63,305
7
$76,767
2
$59,925
2
$68,815
1
$39,010
APPLICATIONS DENIED
5
$140,064
9
$73,770
53
$104,289
13
$26,582
7
$76,551
7
$52,533
APPLICATIONS WITHDRAWN
2
$104,240
2
$145,325
24
$103,257
1
$20,830
2
$60,300
0
$0
FILES CLOSED FOR INCOMPLETENESS
0
$0
2
$96,090
5
$89,816
0
$0
1
$21,130
1
$4,020
Aggregated Statistics For Year 2007 (Based on 2 partial tracts)
A) FHA, FSA/RHS & VA Home Purchase Loans
B) Conventional Home Purchase Loans
C) Refinancings
D) Home Improvement Loans
F) Non-occupant Loans on < 5 Family Dwellings (A B C & D)
G) Loans On Manufactured Home Dwelling (A B C & D)
Number
Average Value
Number
Average Value
Number
Average Value
Number
Average Value
Number
Average Value
Number
Average Value
LOANS ORIGINATED
16
$112,132
59
$88,199
73
$81,806
19
$60,048
20
$58,354
10
$41,238
APPLICATIONS APPROVED, NOT ACCEPTED
1
$57,950
8
$88,014
12
$97,033
3
$20,667
2
$75,195
4
$51,525
APPLICATIONS DENIED
5
$107,078
17
$72,694
49
$91,913
16
$49,997
2
$70,000
5
$43,360
APPLICATIONS WITHDRAWN
1
$65,150
6
$147,407
18
$96,124
6
$59,768
1
$111,110
0
$0
FILES CLOSED FOR INCOMPLETENESS
1
$57,350
4
$117,102
6
$93,615
1
$25,300
0
$0
0
$0
Aggregated Statistics For Year 2006 (Based on 2 partial tracts)
A) FHA, FSA/RHS & VA Home Purchase Loans
B) Conventional Home Purchase Loans
C) Refinancings
D) Home Improvement Loans
E) Loans on Dwellings For 5+ Families
F) Non-occupant Loans on < 5 Family Dwellings (A B C & D)
G) Loans On Manufactured Home Dwelling (A B C & D)
Number
Average Value
Number
Average Value
Number
Average Value
Number
Average Value
Number
Average Value
Number
Average Value
Number
Average Value
LOANS ORIGINATED
19
$115,375
58
$83,389
79
$82,109
15
$44,955
1
$234,810
16
$64,552
4
$79,888
APPLICATIONS APPROVED, NOT ACCEPTED
1
$114,650
6
$75,525
13
$75,832
1
$28,040
0
$0
1
$86,080
1
$66,150
APPLICATIONS DENIED
1
$77,860
24
$72,080
55
$82,083
18
$33,140
0
$0
3
$84,983
9
$48,253
APPLICATIONS WITHDRAWN
0
$0
6
$88,623
28
$89,468
3
$64,413
0
$0
1
$137,290
1
$62,890
FILES CLOSED FOR INCOMPLETENESS
0
$0
4
$102,302
15
$96,017
0
$0
0
$0
1
$36,220
0
$0
Aggregated Statistics For Year 2005 (Based on 2 partial tracts)
A) FHA, FSA/RHS & VA Home Purchase Loans
B) Conventional Home Purchase Loans
C) Refinancings
D) Home Improvement Loans
E) Loans on Dwellings For 5+ Families
F) Non-occupant Loans on < 5 Family Dwellings (A B C & D)
G) Loans On Manufactured Home Dwelling (A B C & D)
Number
Average Value
Number
Average Value
Number
Average Value
Number
Average Value
Number
Average Value
Number
Average Value
Number
Average Value
LOANS ORIGINATED
18
$96,412
63
$73,596
75
$79,256
12
$30,644
0
$0
17
$58,245
9
$27,937
APPLICATIONS APPROVED, NOT ACCEPTED
0
$0
6
$65,553
20
$81,192
1
$17,640
0
$0
1
$70,830
2
$50,280
APPLICATIONS DENIED
3
$67,293
18
$62,979
52
$74,984
14
$43,935
1
$150,930
3
$109,270
12
$48,393
APPLICATIONS WITHDRAWN
1
$82,190
9
$92,144
41
$93,303
4
$57,805
0
$0
1
$108,040
0
$0
FILES CLOSED FOR INCOMPLETENESS
1
$29,180
2
$104,460
12
$77,248
1
$67,120
0
$0
1
$91,730
0
$0
Aggregated Statistics For Year 2004 (Based on 2 partial tracts)
A) FHA, FSA/RHS & VA Home Purchase Loans
B) Conventional Home Purchase Loans
C) Refinancings
D) Home Improvement Loans
F) Non-occupant Loans on < 5 Family Dwellings (A B C & D)
G) Loans On Manufactured Home Dwelling (A B C & D)
Number
Average Value
Number
Average Value
Number
Average Value
Number
Average Value
Number
Average Value
Number
Average Value
LOANS ORIGINATED
13
$81,678
52
$79,136
77
$69,791
12
$27,529
13
$72,854
11
$47,161
APPLICATIONS APPROVED, NOT ACCEPTED
0
$0
6
$107,883
22
$73,602
2
$11,900
1
$69,180
3
$66,363
APPLICATIONS DENIED
0
$0
14
$54,531
58
$73,609
11
$30,159
1
$28,830
10
$40,592
APPLICATIONS WITHDRAWN
1
$143,100
3
$83,497
22
$82,472
2
$22,755
0
$0
2
$33,710
FILES CLOSED FOR INCOMPLETENESS
0
$0
1
$120,940
32
$89,535
2
$29,935
0
$0
0
$0
Aggregated Statistics For Year 2003 (Based on 2 partial tracts)
A) FHA, FSA/RHS & VA Home Purchase Loans
B) Conventional Home Purchase Loans
C) Refinancings
D) Home Improvement Loans
E) Loans on Dwellings For 5+ Families
F) Non-occupant Loans on < 5 Family Dwellings (A B C & D)
Number
Average Value
Number
Average Value
Number
Average Value
Number
Average Value
Number
Average Value
Number
Average Value
LOANS ORIGINATED
14
$79,535
40
$61,616
136
$72,658
11
$18,609
3
$70,433
11
$58,589
APPLICATIONS APPROVED, NOT ACCEPTED
0
$0
6
$54,223
18
$68,838
2
$24,495
0
$0
2
$65,490
APPLICATIONS DENIED
2
$82,280
18
$48,513
64
$66,490
7
$24,653
0
$0
3
$52,493
APPLICATIONS WITHDRAWN
1
$51,820
2
$54,635
27
$77,631
1
$45,780
0
$0
1
$58,390
FILES CLOSED FOR INCOMPLETENESS
0
$0
4
$72,322
10
$67,091
2
$42,765
0
$0
0
$0
Aggregated Statistics For Year 2002 (Based on 2 partial tracts)
A) FHA, FSA/RHS & VA Home Purchase Loans
B) Conventional Home Purchase Loans
C) Refinancings
D) Home Improvement Loans
F) Non-occupant Loans on < 5 Family Dwellings (A B C & D)
Number
Average Value
Number
Average Value
Number
Average Value
Number
Average Value
Number
Average Value
LOANS ORIGINATED
14
$79,059
35
$63,781
99
$68,260
8
$23,974
12
$48,377
APPLICATIONS APPROVED, NOT ACCEPTED
1
$33,180
8
$55,602
16
$63,643
0
$0
1
$38,410
APPLICATIONS DENIED
1
$71,440
12
$47,538
53
$60,468
8
$20,560
3
$37,813
APPLICATIONS WITHDRAWN
0
$0
2
$34,505
25
$67,837
1
$24,980
1
$35,720
FILES CLOSED FOR INCOMPLETENESS
2
$74,570
2
$64,980
15
$66,572
0
$0
1
$53,540
Aggregated Statistics For Year 2001 (Based on 2 partial tracts)
A) FHA, FSA/RHS & VA Home Purchase Loans
B) Conventional Home Purchase Loans
C) Refinancings
D) Home Improvement Loans
F) Non-occupant Loans on < 5 Family Dwellings (A B C & D)
Number
Average Value
Number
Average Value
Number
Average Value
Number
Average Value
Number
Average Value
LOANS ORIGINATED
16
$64,434
37
$59,447
88
$62,608
13
$16,797
8
$48,690
APPLICATIONS APPROVED, NOT ACCEPTED
1
$34,440
6
$41,875
13
$66,498
3
$30,720
2
$36,335
APPLICATIONS DENIED
1
$91,600
20
$44,021
31
$58,711
5
$19,036
3
$49,573
APPLICATIONS WITHDRAWN
0
$0
5
$68,598
12
$62,400
0
$0
0
$0
FILES CLOSED FOR INCOMPLETENESS
0
$0
1
$84,510
6
$58,857
0
$0
0
$0
Aggregated Statistics For Year 1999 (Based on 2 partial tracts)
A) FHA, FSA/RHS & VA Home Purchase Loans
B) Conventional Home Purchase Loans
C) Refinancings
D) Home Improvement Loans
F) Non-occupant Loans on < 5 Family Dwellings (A B C & D)
Detailed PMIC statistics for the following Tracts:0017.00
, 0018.00
2005 - 2018 National Fire Incident Reporting System (NFIRS) incidents
According to the data from the years 2005 - 2018 the average number of fires per year is 9. The highest number of reported fire incidents - 30 took place in 2011, and the least - 0 in 2006. The data has an increasing trend.
When looking into fire subcategories, the most incidents belonged to: Structure Fires (69.9%), and Outside Fires (21.1%).
Fire incident types reported to NFIRS in Zip Code 36277
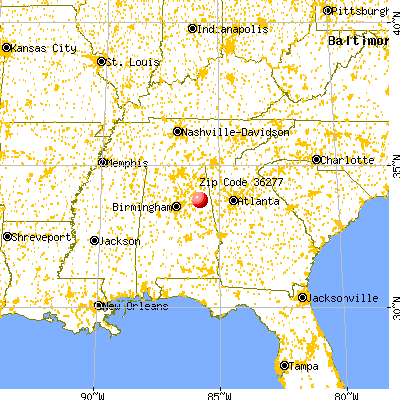


 Nearest zip codes: 36206, 36205, 36250, 36265, 36201, 36207.


 According to the data from the years 2005 - 2018 the average number of fires per year is 9. The highest number of reported fire incidents - 30 took place in 2011, and the least - 0 in 2006. The data has an increasing trend.
 When looking into fire subcategories, the most incidents belonged to: Structure Fires (69.9%), and Outside Fires (21.1%).