Estimated zip code population in 2022: 7,685 Zip code population in 2010: 6,591 Zip code population in 2000: 4,907
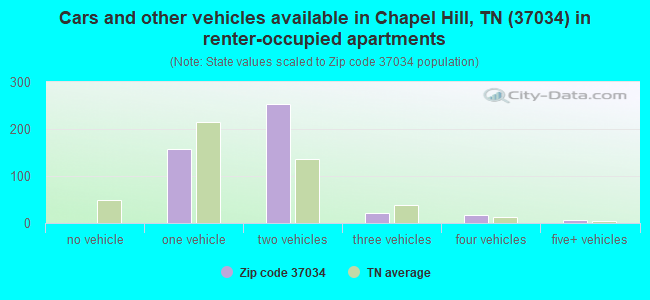
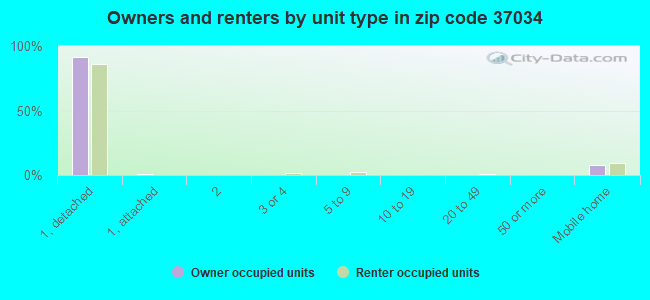
Houses and condos: 3,293 Renter-occupied apartments: 453
% of renters here:
15%
State:
33%
March 2022 cost of living index in zip code 37034: 81.6 (low, U.S. average is 100)
Land area: 71.6 sq. mi. Water area: 0.2 sq. mi.
Population density: 107 people per square mile
(very low).
OSM Map
General Map
Google Map
MSN Map
OSM Map
General Map
Google Map
MSN Map
OSM Map
General Map
Google Map
MSN Map
OSM Map
General Map
Google Map
MSN Map
Please wait while loading the map...
Real estate property taxes paid for housing units in 2022:
This zip code:
0.4% ($1,454)
Tennessee:
0.5% ($1,376)
Median real estate property taxes paid for housing units with mortgages in 2022: $1,509 (0.4%) Median real estate property taxes paid for housing units with no mortgage in 2022: $1,227 (0.5%)
Business Search- 14 Million verified businesses
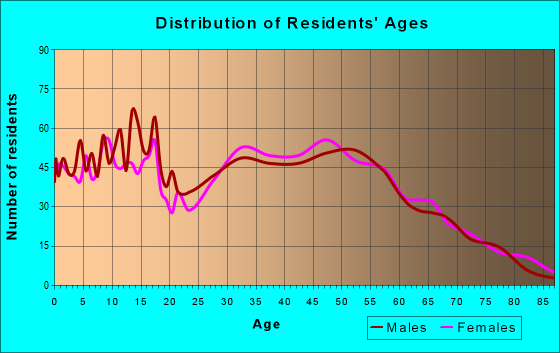
Males: 3,649
(47.5%)
Females: 4,035
(52.5%)
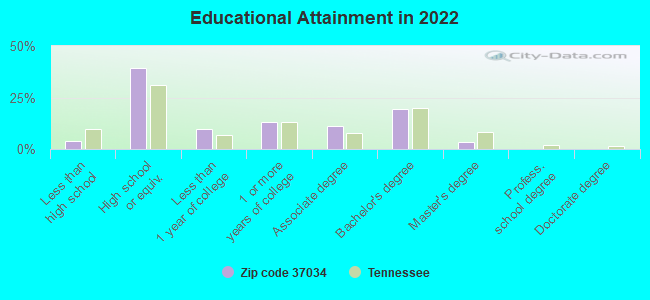
For population 25 years and over in 37034:
High school or higher: 96.3%
Bachelor's degree or higher: 23.2%
Graduate or professional degree: 3.5%
Unemployed: 3.7%
Mean travel time to work (commute): 34.3 minutes
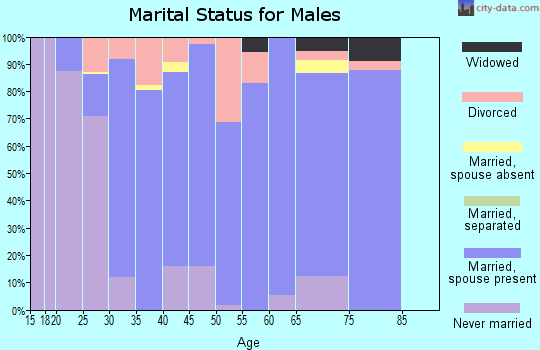
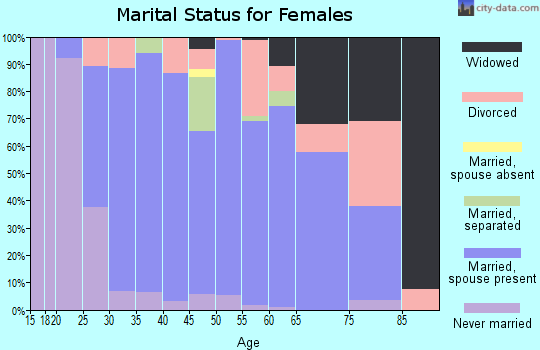
For population 15 years and over in 37034:
Never married: 22.7%
Now married: 59.7%
Separated: 1.2%
Widowed: 3.6%
Divorced: 12.8%
Zip code 37034 compared to state average:
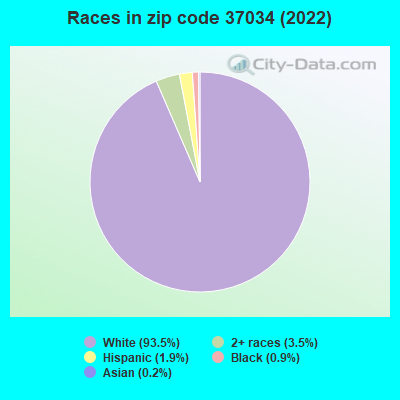
Black race population percentage significantly below state average.
Hispanic race population percentage significantly below state average.
Foreign-born population percentage significantly below state average.
Renting percentage below state average.
Length of stay since moving in significantly above state average.
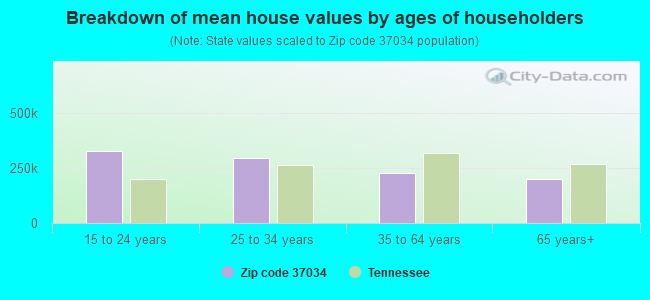
Estimated median house/condo value in 2022: $330,078
37034:
$330,078
Tennessee:
$284,800
According to our research of Tennessee and other state lists, there were 16 registered sex offenders living in 37034 zip code as of April 27, 2024. The ratio of all residents to sex offenders in zip code 37034 is 459 to 1. The ratio of registered sex offenders to all residents in this zip code is lower than the state average.
Median resident age:
This zip code:
39.8 years
Tennessee median age:
39.2 years
Average household size:
This zip code:
2.5 people
Tennessee:
2.4 people
Averages for the 2020 tax year for zip code 37034, filed in 2021:
Average Adjusted Gross Income (AGI) in 2020: $63,750 (Individual Income Tax Returns)
Here:
$63,750
State:
$69,014
Salary/wage: $57,767 (reported on 86.2% of returns)
Here:
$57,767
State:
$55,872
(% of AGI for various income ranges: 1114.5% for AGIs below $25k, 3593.5% for AGIs $25k-50k, 6481.2% for AGIs $50k-75k, 9564.0% for AGIs $75k-100k, 17049.8% for AGIs $100k-200k, 65145.0% for AGIs over 200k)
Taxable interest for individuals: $757 (reported on 27.0% of returns)
This zip code:
$757
Tennessee:
$1,945
(% of AGI for various income ranges: 17.6% for AGIs below $25k, 15.0% for AGIs $25k-50k, 21.9% for AGIs $50k-75k, 18.5% for AGIs $75k-100k, 37.4% for AGIs $100k-200k, 1020.0% for AGIs over 200k)
Ordinary dividends: $1,578 (reported on 11.2% of returns)
Here:
$1,578
State:
$8,105
(% of AGI for various income ranges: 7.3% for AGIs below $25k, 21.2% for AGIs $25k-50k, 25.0% for AGIs $50k-75k, 14.8% for AGIs $75k-100k, 53.0% for AGIs $100k-200k, 265.0% for AGIs over 200k)
Net capital gain/loss in AGI: +$18,013 (reported on 11.2% of returns)
Here:
+$18,013
State:
+$33,664
(% of AGI for various income ranges: 3.9% for AGIs below $25k, 17.0% for AGIs $25k-50k, 57.8% for AGIs $50k-75k, 141.5% for AGIs $75k-100k, 478.4% for AGIs $100k-200k, 24915.0% for AGIs over 200k)
Profit/loss from business: +$18,474 (reported on 17.0% of returns)
Here:
+$18,474
State:
+$18,991
(% of AGI for various income ranges: 168.1% for AGIs below $25k, 213.8% for AGIs $25k-50k, 285.0% for AGIs $50k-75k, 405.8% for AGIs $75k-100k, 686.7% for AGIs $100k-200k, 16810.0% for AGIs over 200k)
Taxable individual retirement arrangement distribution: $16,068 (reported on 6.2% of returns)
37034:
$16,068
Tennessee:
$20,036
(% of AGI for various income ranges: 51.2% for AGIs below $25k, 61.6% for AGIs $25k-50k, 103.4% for AGIs $50k-75k, 119.5% for AGIs $75k-100k, 479.5% for AGIs $100k-200k)
Total itemized deductions: $28,315 (reported on 3.2% of returns)
Here:
$28,315
State:
$40,136
(% of AGI for various income ranges: 66.0% for AGIs below $25k, 116.2% for AGIs $50k-75k, 128.5% for AGIs $75k-100k, 298.8% for AGIs $100k-200k, 3565.0% for AGIs over 200k)
Charity contributions: $7,073 (reported on 2.8% of returns)
Here:
$7,073
State:
$19,852
(% of AGI for various income ranges: 40.9% for AGIs $50k-75k, 125.8% for AGIs $100k-200k)
Taxes paid: $4,892 (reported on 3.2% of returns)
37034:
$4,892
State:
$6,038
(% of AGI for various income ranges: 9.3% for AGIs below $25k, 14.7% for AGIs $50k-75k, 24.0% for AGIs $75k-100k, 54.4% for AGIs $100k-200k, 755.0% for AGIs over 200k)
Earned income credit: $2,253 (reported on 12.2% of returns)
Here:
$2,253
State:
$2,391
(% of AGI for various income ranges: 79.1% for AGIs below $25k, 62.5% for AGIs $25k-50k, 1.9% for AGIs $50k-75k)
Percentage of individuals using paid preparers for their 2020 taxes: 96.0%
Here:
96%
State:
93%
(% for various income ranges: 94.0% for AGIs below $25k, 95.9% for AGIs $25k-50k, 97.3% for AGIs $50k-75k, 96.2% for AGIs $75k-100k, 97.1% for AGIs $100k-200k, 100.0% for AGIs over 200k)
Averages for the 2012 tax year for zip code 37034, filed in 2013:
Average Adjusted Gross Income (AGI) in 2012: $45,871 (Individual Income Tax Returns)
Here:
$45,871
State:
$53,767
Salary/wage: $42,318 (reported on 88.1% of returns)
Here:
$42,318
State:
$45,421
(% of AGI for various income ranges: 77.6% for AGIs below $25k, 83.2% for AGIs $25k-50k, 81.4% for AGIs $50k-75k, 88.1% for AGIs $75k-100k, 81.3% for AGIs $100k-200k, 61.2% for AGIs over 200k)
Taxable interest for individuals: $747 (reported on 24.5% of returns)
This zip code:
$747
Tennessee:
$1,732
(% of AGI for various income ranges: 1.1% for AGIs below $25k, 0.4% for AGIs $25k-50k, 0.3% for AGIs $50k-75k, 0.2% for AGIs $75k-100k, 0.3% for AGIs $100k-200k, 0.3% for AGIs over 200k)
Ordinary dividends: $835 (reported on 10.5% of returns)
Here:
$835
State:
$6,739
(% of AGI for various income ranges: 0.4% for AGIs below $25k, 0.2% for AGIs $25k-50k, 0.1% for AGIs $50k-75k, 0.3% for AGIs $100k-200k)
Net capital gain/loss in AGI: +$5,007 (reported on 9.2% of returns)
Here:
+$5,007
State:
+$19,082
(% of AGI for various income ranges: 0.3% for AGIs below $25k, 0.3% for AGIs $25k-50k, 0.7% for AGIs $50k-75k, 0.4% for AGIs $75k-100k, 3.5% for AGIs $100k-200k)
Profit/loss from business: +$11,163 (reported on 15.6% of returns)
Here:
+$11,163
State:
+$15,240
(% of AGI for various income ranges: 8.4% for AGIs below $25k, 3.3% for AGIs $25k-50k, 2.9% for AGIs $50k-75k, 1.0% for AGIs $75k-100k, 7.0% for AGIs $100k-200k)
Taxable individual retirement arrangement distribution: $11,725 (reported on 6.8% of returns)
37034:
$11,725
Tennessee:
$15,505
(% of AGI for various income ranges: 2.6% for AGIs below $25k, 1.4% for AGIs $25k-50k, 3.1% for AGIs $50k-75k, 2.5% for AGIs $100k-200k)
Total itemized deductions: $16,371 (22% of AGI, reported on 19.7% of returns)
Here:
$16,371
State:
$21,976
Here:
21.6% of AGI
State:
17.8% of AGI
(% of AGI for various income ranges: 6.2% for AGIs below $25k, 5.9% for AGIs $25k-50k, 7.8% for AGIs $50k-75k, 8.1% for AGIs $75k-100k, 9.5% for AGIs $100k-200k)
Charity contributions: $3,556 (reported on 13.9% of returns)
Here:
$3,556
State:
$6,709
(% of AGI for various income ranges: 0.6% for AGIs below $25k, 0.6% for AGIs $25k-50k, 1.1% for AGIs $50k-75k, 1.3% for AGIs $75k-100k, 2.1% for AGIs $100k-200k)
Taxes paid: $3,310 (reported on 19.7% of returns)
37034:
$3,310
State:
$4,829
(% of AGI for various income ranges: 1.0% for AGIs below $25k, 0.9% for AGIs $25k-50k, 1.6% for AGIs $50k-75k, 1.7% for AGIs $75k-100k, 2.3% for AGIs $100k-200k)
Earned income credit: $2,168 (reported on 19.4% of returns)
Here:
$2,168
State:
$2,404
(% of AGI for various income ranges: 6.3% for AGIs below $25k, 1.2% for AGIs $25k-50k)
Percentage of individuals using paid preparers for their 2012 taxes: 52.7%
Here:
53%
State:
52%
(% for various income ranges: 48.6% for AGIs below $25k, 54.2% for AGIs $25k-50k, 57.4% for AGIs $50k-75k, 56.7% for AGIs $75k-100k, 50.0% for AGIs $100k-200k, 66.7% for AGIs over 200k)
Averages for the 2004 tax year for zip code 37034, filed in 2005:
Average Adjusted Gross Income (AGI) in 2004: $39,571 (Individual Income Tax Returns)
Here:
$39,571
State:
$44,088
Salary/wage: $38,720 (reported on 88.4% of returns)
Here:
$38,720
State:
$38,825
(% of AGI for various income ranges: 109.4% for AGIs below $10k, 80.0% for AGIs $10k-25k, 85.8% for AGIs $25k-50k, 90.2% for AGIs $50k-75k, 93.2% for AGIs $75k-100k, 74.1% for AGIs over 100k)
Taxable interest for individuals: $1,140 (reported on 35.4% of returns)
This zip code:
$1,140
Tennessee:
$1,802
(% of AGI for various income ranges: 8.0% for AGIs below $10k, 1.9% for AGIs $10k-25k, 1.0% for AGIs $25k-50k, 0.7% for AGIs $50k-75k, 0.3% for AGIs $75k-100k, 1.2% for AGIs over 100k)
Taxable dividends: $735 (reported on 14.0% of returns)
Here:
$735
State:
$3,727
(% of AGI for various income ranges: 1.4% for AGIs below $10k, 0.4% for AGIs $10k-25k, 0.2% for AGIs $25k-50k, 0.3% for AGIs $50k-75k, 0.0% for AGIs $75k-100k, 0.4% for AGIs over 100k)
Net capital gain/loss: +$7,204 (reported on 9.6% of returns)
Here:
+$7,204
State:
+$15,776
(% of AGI for various income ranges: 2.5% for AGIs below $10k, 0.6% for AGIs $10k-25k, 0.8% for AGIs $25k-50k, 1.0% for AGIs $50k-75k, 0.5% for AGIs $75k-100k, 6.7% for AGIs over 100k)
Profit/loss from business: +$9,695 (reported on 16.7% of returns)
Here:
+$9,695
State:
+$12,882
(% of AGI for various income ranges: 2.9% for AGIs below $10k, 6.7% for AGIs $10k-25k, 4.3% for AGIs $25k-50k, 1.6% for AGIs $50k-75k, 2.2% for AGIs $75k-100k, 9.4% for AGIs over 100k)
IRA payment deduction: $2,300 (reported on 0.8% of returns)
37034:
$2,300
Tennessee:
$2,934
Total itemized deductions: $14,140 (22% of AGI, reported on 22.9% of returns)
Here:
$14,140
State:
$18,035
Here:
21.7% of AGI
State:
19.9% of AGI
(% of AGI for various income ranges: 13.3% for AGIs below $10k, 4.6% for AGIs $10k-25k, 7.5% for AGIs $25k-50k, 8.6% for AGIs $50k-75k, 10.1% for AGIs $75k-100k, 8.0% for AGIs over 100k)
Charity contributions deductions: $2,937 (4% of AGI, reported on 17.7% of returns)
Here:
$2,937
State:
$5,167
Here:
4.3% of AGI
State:
5.3% of AGI
(% of AGI for various income ranges: 0.6% for AGIs $10k-25k, 0.9% for AGIs $25k-50k, 1.4% for AGIs $50k-75k, 1.6% for AGIs $75k-100k, 1.9% for AGIs over 100k)
Total tax: $4,760 (reported on 77.4% of returns)
37034:
$4,760
State:
$7,482
(% of AGI for various income ranges: 4.3% for AGIs below $10k, 4.3% for AGIs $10k-25k, 6.5% for AGIs $25k-50k, 8.4% for AGIs $50k-75k, 10.8% for AGIs $75k-100k, 17.2% for AGIs over 100k)
Earned income credit: $1,698 (reported on 15.1% of returns)
Here:
$1,698
State:
$1,826
Percentage of individuals using paid preparers for their 2004 taxes: 59.6%
Here:
60%
State:
60%
(% for various income ranges: 53.9% for AGIs below $10k, 61.0% for AGIs $10k-25k, 62.5% for AGIs $25k-50k, 58.3% for AGIs $50k-75k, 56.3% for AGIs $75k-100k, 71.8% for AGIs over 100k)
Household received Food Stamps/SNAP in the past 12 months: 68 Household did not receive Food Stamps/SNAP in the past 12 months: 2,963
Women who had a birth in the past 12 months: 77 (64 now married, 13 unmarried) Women who did not have a birth in the past 12 months: 1,728 (944 now married, 784 unmarried)
Housing units in zip code 37034 with a mortgage: 1,767 (65 second mortgage, 51 both second mortgage and home equity loan) Median monthly owner costs for units with a mortgage: $1,440 Median monthly owner costs for units without a mortgage: $425
Residents with income below the poverty level in 2022:
This zip code:
7.3%
Whole state:
13.3%
Residents with income below 50% of the poverty level in 2022:
This zip code:
6.4%
Whole state:
7.1%
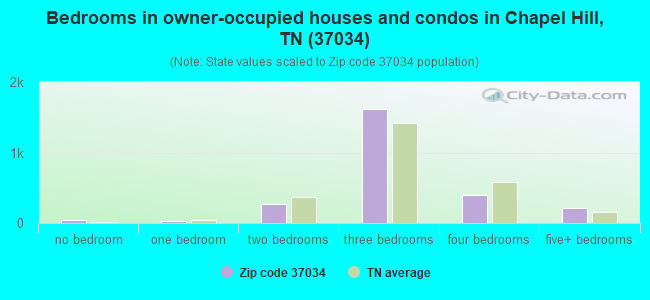
Median number of rooms in houses and condos:
Here:
6.2
State:
6.5
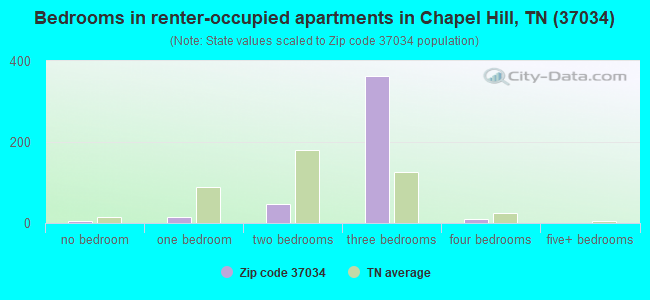
Median number of rooms in apartments:
Here:
5.1
State:
4.4
Notable locations in this zip code not listed on our city pages
Churches in zip code 37034 include: Mount Zion Church (A), Lily Hill Church (B), Rays Chapel United Methodist Church (C), Cedar Dell Church (D), Cedar Grove Church (E), Mount Vernon Church (F), Corinth Church (G), Holts Corner Baptist Church (H), Caney Springs United Methodist Church (I). Display/hide their locations on the map
Cemeteries: Swanson Cemetery (1), Joyce Cemetery (2), King Cemetery (3), Wilson Cemetery (4), Winn Cemetery (5), Lee Cemetery (6), Beasley Cemetery (7). Display/hide their locations on the map
Streams, rivers, and creeks: Lick Creek (A), Jones Creek (B), Clem Creek (C), Dry Branch (D), Plum Branch (E), Osteen Branch (F), North Fork Creek (G), Thick Creek (H), Taylor Branch (I). Display/hide their locations on the map
Size of family households: 967 2-persons, 509 3-persons, 468 4-persons, 138 5-persons, 53 6-persons, 112 7-or-more-persons
Size of nonfamily households: 713 1-person, 51 2-persons
971 married couples with children.
283 single-parent households (123 men, 160 women).
96.6% of residents of 37034 zip code speak English at home.
2.2% of residents speak Spanish at home (100% very well).
0.9% of residents speak other Indo-European language at home (100% very well).
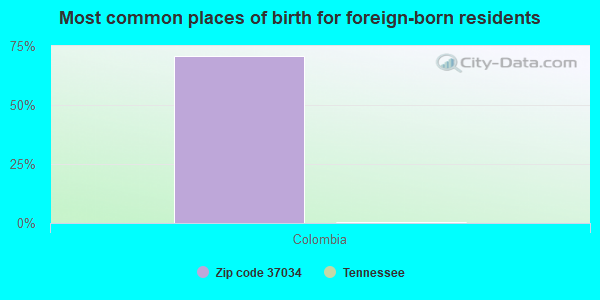
Foreign born population: 105 (1.4%) (100.0% of them are naturalized citizens)
This zip code:
1.4%
Whole state:
5.6%
71%Colombia
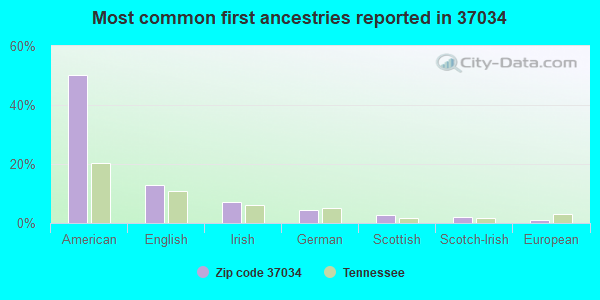
50%American
13%English
7%Irish
4%German
3%Scottish
2%Scotch-Irish
1%European
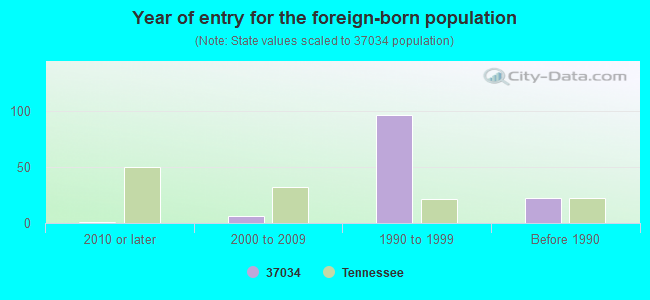
Year of entry for the foreign-born population
12010 or later
62000 to 2009
961990 to 1999
22Before 1990
Facilities with environmental interests located in this zip code:
CHAPEL HILL ELEM (415 S HORTON PKWY in CHAPEL HILL, TN)
(National Center for Education Statistics) - STATE ID-0007 Organizations: MARSHALL COUNTY SCHOOL DISTRCT (SCHOOL DISTRICT)
CHAPEL HILL STP (HIGHWAY 99 in CHAPEL HILL, TN)
National Pollutant Discharge Elimination System NON-MAJOR (Tracking pollutant discharge elimination systems) - permit Business SIC classification: SEWERAGE SYSTEMS Organizations: HORACE HILL JR (CONTACT/OWNER)
Alternative names: CHAPEL HILL WWTP
Housing units lacking complete plumbing facilities: 5.6% Housing units lacking complete kitchen facilities: 5.5%
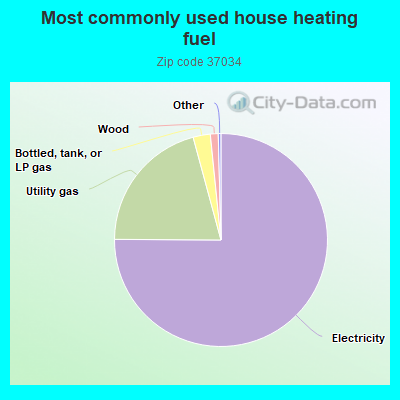
75.1%Electricity
20.7%Utility gas
2.6%Bottled, tank, or LP gas
1.2%Wood
Population in 1990: 2,912. Population change in the 1990s: +1,995 (+68.5%).
Place of birth for U.S.-born residents:
This state: 4,684
Northeast: 598
Midwest: 929
South: 810
West: 534
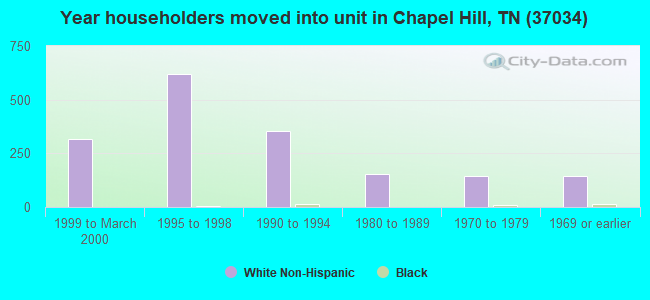
54% of the 37034 zip code residents lived in the same house 5 years ago. Out of people who lived in different houses, 35% lived in this county. Out of people who lived in different counties, 50% lived in Tennessee.
92% of the 37034 zip code residents lived in the same house 1 year ago. Out of people who lived in different houses, 20% moved from this county. Out of people who lived in different houses, 74% moved from different county within same state. Out of people who lived in different houses, 12% moved from different state.
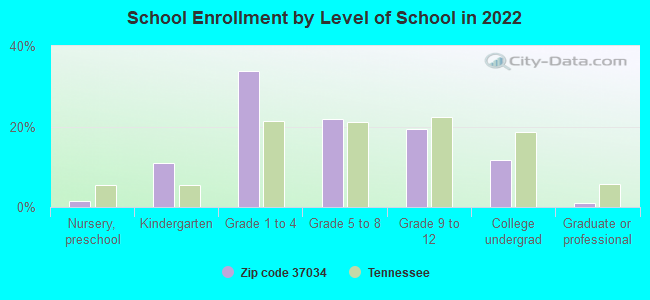
Private vs. public school enrollment:
Students in private schools in grades 1 to 8 (elementary and middle school): 354
Here:
42.1%
Tennessee:
15.0%
Students in private schools in grades 9 to 12 (high school): 3
Here:
1.4%
Tennessee:
16.2%
Students in private undergraduate colleges: 63
Here:
36.2%
Tennessee:
23.5%
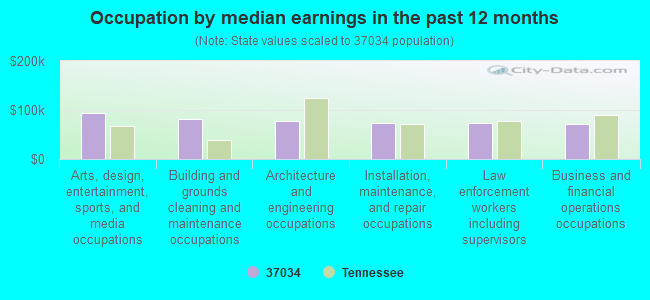
Occupation by median earnings in the past 12 months ($)
93,025Arts, design, entertainment, sports, and media occupations
81,172Building and grounds cleaning and maintenance occupations
77,272Architecture and engineering occupations
73,998Installation, maintenance, and repair occupations
73,130Law enforcement workers including supervisors
70,639Business and financial operations occupations
Top industries in this zip code by the number of employees in 2005:
Other Services (except Public Administration): Religious Organizations (10-19: 1, 5-9: 1, 1-4: 2)
Finance and Insurance: Commercial Banking (10-19: 1, 5-9: 1)
Other Services (except Public Administration): General Automotive Repair (5-9: 1, 1-4: 4)
Fatal accident statistics in 2012:
Fatal accident count: 1
Vehicles involved in fatal accidents: 2
Fatal accidents caused by drunken drivers: 1
Fatalities: 1
Persons involved in fatal accidents: 2
Pedestrians involved in fatal accidents: 0
Fatal accident statistics in 2010:
Fatal accident count: 1
Vehicles involved in fatal accidents: 1
Fatal accidents caused by drunken drivers: 0
Fatalities: 1
Persons involved in fatal accidents: 1
Pedestrians involved in fatal accidents: 0
2002 - 2018 National Fire Incident Reporting System (NFIRS) incidents
Based on the data from the years 2002 - 2018 the average number of fires per year is 33. The highest number of fire incidents - 63 took place in 2010, and the least - 4 in 2002. The data has a growing trend.
When looking into fire subcategories, the most incidents belonged to: Outside Fires (52.6%), and Structure Fires (32.0%).
Fire incident types reported to NFIRS in Zip Code 37034


 Nearest zip codes: 37060, 37180, 37046, 37153, 37091, 37174.


 Based on the data from the years 2002 - 2018 the average number of fires per year is 33. The highest number of fire incidents - 63 took place in 2010, and the least - 4 in 2002. The data has a growing trend.
 When looking into fire subcategories, the most incidents belonged to: Outside Fires (52.6%), and Structure Fires (32.0%).