Estimated zip code population in 2022: 28,679 Zip code population in 2010: 27,024 Zip code population in 2000: 24,325
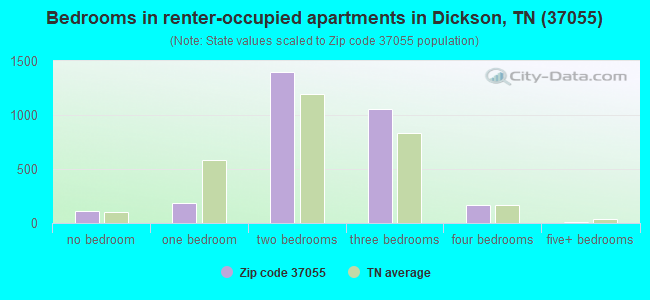
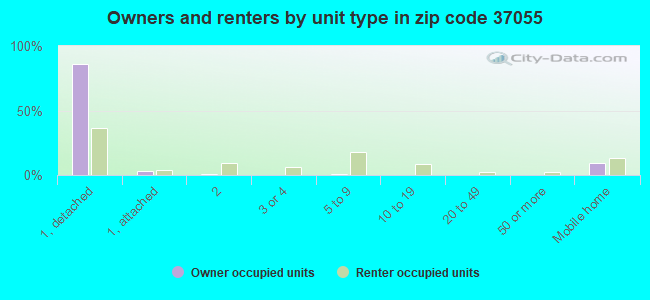
Houses and condos: 12,271 Renter-occupied apartments: 2,938
% of renters here:
26%
State:
33%
March 2022 cost of living index in zip code 37055: 88.0 (less than average, U.S. average is 100)
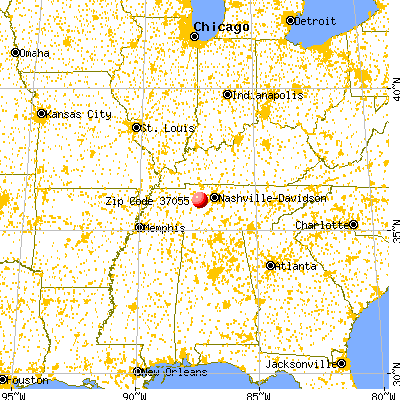
Land area: 203.1 sq. mi. Water area: 0.2 sq. mi.
Population density: 141 people per square mile
(very low).
OSM Map
General Map
Google Map
MSN Map
OSM Map
General Map
Google Map
MSN Map
OSM Map
General Map
Google Map
MSN Map
OSM Map
General Map
Google Map
MSN Map
Please wait while loading the map...
Real estate property taxes paid for housing units in 2022:
This zip code:
0.5% ($1,370)
Tennessee:
0.5% ($1,376)
Median real estate property taxes paid for housing units with mortgages in 2022: $1,411 (0.5%) Median real estate property taxes paid for housing units with no mortgage in 2022: $1,285 (0.5%)
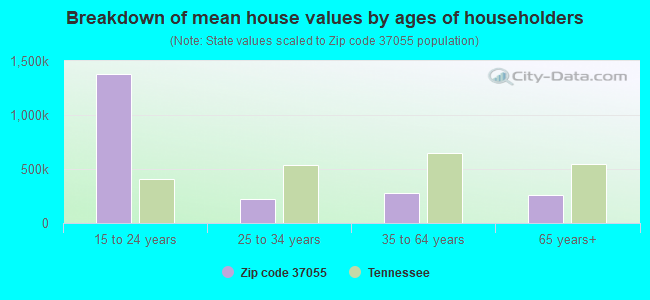
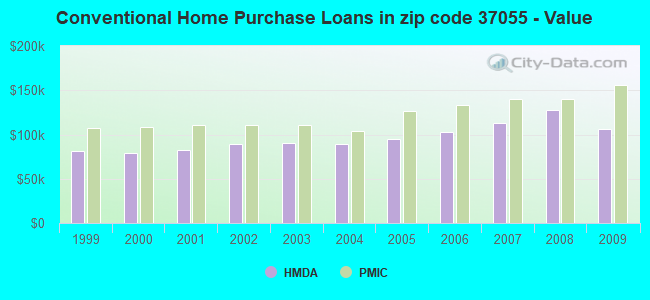
Estimated median house/condo value in 2022: $282,959
37055:
$282,959
Tennessee:
$284,800
According to our research of Tennessee and other state lists, there were 65 registered sex offenders living in 37055 zip code as of April 27, 2024. The ratio of all residents to sex offenders in zip code 37055 is 424 to 1. The ratio of registered sex offenders to all residents in this zip code is lower than the state average.
Median resident age:
This zip code:
37.3 years
Tennessee median age:
39.2 years
Average household size:
This zip code:
2.5 people
Tennessee:
2.4 people
Averages for the 2020 tax year for zip code 37055, filed in 2021:
Average Adjusted Gross Income (AGI) in 2020: $54,118 (Individual Income Tax Returns)
Here:
$54,118
State:
$69,014
Salary/wage: $47,796 (reported on 82.9% of returns)
Here:
$47,796
State:
$55,872
(% of AGI for various income ranges: 1136.8% for AGIs below $25k, 3646.5% for AGIs $25k-50k, 6377.9% for AGIs $50k-75k, 9289.1% for AGIs $75k-100k, 16003.1% for AGIs $100k-200k, 84214.3% for AGIs over 200k)
Taxable interest for individuals: $1,314 (reported on 24.5% of returns)
This zip code:
$1,314
Tennessee:
$1,945
(% of AGI for various income ranges: 13.6% for AGIs below $25k, 16.1% for AGIs $25k-50k, 34.3% for AGIs $50k-75k, 44.6% for AGIs $75k-100k, 97.3% for AGIs $100k-200k, 2258.6% for AGIs over 200k)
Ordinary dividends: $3,779 (reported on 10.3% of returns)
Here:
$3,779
State:
$8,105
(% of AGI for various income ranges: 10.4% for AGIs below $25k, 15.1% for AGIs $25k-50k, 42.1% for AGIs $50k-75k, 65.8% for AGIs $75k-100k, 139.8% for AGIs $100k-200k, 2802.9% for AGIs over 200k)
Net capital gain/loss in AGI: +$19,177 (reported on 9.6% of returns)
Here:
+$19,177
State:
+$33,664
(% of AGI for various income ranges: 7.0% for AGIs below $25k, 23.2% for AGIs $25k-50k, 78.7% for AGIs $50k-75k, 168.2% for AGIs $75k-100k, 676.9% for AGIs $100k-200k, 21661.4% for AGIs over 200k)
Profit/loss from business: +$16,820 (reported on 16.3% of returns)
Here:
+$16,820
State:
+$18,991
(% of AGI for various income ranges: 148.1% for AGIs below $25k, 178.3% for AGIs $25k-50k, 274.1% for AGIs $50k-75k, 304.3% for AGIs $75k-100k, 1096.2% for AGIs $100k-200k, 13747.1% for AGIs over 200k)
Taxable individual retirement arrangement distribution: $17,860 (reported on 6.6% of returns)
37055:
$17,860
Tennessee:
$20,036
(% of AGI for various income ranges: 40.1% for AGIs below $25k, 64.8% for AGIs $25k-50k, 163.0% for AGIs $50k-75k, 193.3% for AGIs $75k-100k, 602.0% for AGIs $100k-200k, 4058.6% for AGIs over 200k)
Self-employed (Keogh) retirement plans: $23,580 (reported on 0.4% of returns)
37055:
$23,580
Tennessee:
$28,955
(% of AGI for various income ranges: 1684.3% for AGIs over 200k)
Total itemized deductions: $33,375 (reported on 3.0% of returns)
Here:
$33,375
State:
$40,136
(% of AGI for various income ranges: 17.8% for AGIs below $25k, 49.2% for AGIs $25k-50k, 111.5% for AGIs $50k-75k, 161.6% for AGIs $75k-100k, 464.6% for AGIs $100k-200k, 5537.1% for AGIs over 200k)
Charity contributions: $13,003 (reported on 2.4% of returns)
Here:
$13,003
State:
$19,852
(% of AGI for various income ranges: 9.6% for AGIs $25k-50k, 18.4% for AGIs $50k-75k, 37.8% for AGIs $75k-100k, 159.1% for AGIs $100k-200k, 2591.4% for AGIs over 200k)
Taxes paid: $5,353 (reported on 2.8% of returns)
37055:
$5,353
State:
$6,038
(% of AGI for various income ranges: 1.4% for AGIs below $25k, 5.6% for AGIs $25k-50k, 12.7% for AGIs $50k-75k, 28.0% for AGIs $75k-100k, 76.8% for AGIs $100k-200k, 964.3% for AGIs over 200k)
Earned income credit: $2,259 (reported on 19.3% of returns)
Here:
$2,259
State:
$2,391
(% of AGI for various income ranges: 103.4% for AGIs below $25k, 69.9% for AGIs $25k-50k, 1.5% for AGIs $50k-75k)
Percentage of individuals using paid preparers for their 2020 taxes: 94.2%
Here:
94%
State:
93%
(% for various income ranges: 93.5% for AGIs below $25k, 94.7% for AGIs $25k-50k, 94.5% for AGIs $50k-75k, 95.2% for AGIs $75k-100k, 93.9% for AGIs $100k-200k, 96.4% for AGIs over 200k)
Averages for the 2012 tax year for zip code 37055, filed in 2013:
Average Adjusted Gross Income (AGI) in 2012: $42,104 (Individual Income Tax Returns)
Here:
$42,104
State:
$53,767
Salary/wage: $37,939 (reported on 84.8% of returns)
Here:
$37,939
State:
$45,421
(% of AGI for various income ranges: 76.8% for AGIs below $25k, 82.7% for AGIs $25k-50k, 81.1% for AGIs $50k-75k, 81.6% for AGIs $75k-100k, 75.5% for AGIs $100k-200k, 47.9% for AGIs over 200k)
Taxable interest for individuals: $1,222 (reported on 26.6% of returns)
This zip code:
$1,222
Tennessee:
$1,732
(% of AGI for various income ranges: 1.3% for AGIs below $25k, 0.7% for AGIs $25k-50k, 0.4% for AGIs $50k-75k, 0.6% for AGIs $75k-100k, 0.7% for AGIs $100k-200k, 1.4% for AGIs over 200k)
Ordinary dividends: $2,792 (reported on 10.6% of returns)
Here:
$2,792
State:
$6,739
(% of AGI for various income ranges: 0.7% for AGIs below $25k, 0.5% for AGIs $25k-50k, 0.5% for AGIs $50k-75k, 0.4% for AGIs $75k-100k, 0.9% for AGIs $100k-200k, 1.5% for AGIs over 200k)
Net capital gain/loss in AGI: +$9,002 (reported on 7.7% of returns)
Here:
+$9,002
State:
+$19,082
(% of AGI for various income ranges: 0.2% for AGIs below $25k, 0.3% for AGIs $25k-50k, 0.6% for AGIs $50k-75k, 0.7% for AGIs $75k-100k, 2.3% for AGIs $100k-200k, 8.7% for AGIs over 200k)
Profit/loss from business: +$13,016 (reported on 15.5% of returns)
Here:
+$13,016
State:
+$15,240
(% of AGI for various income ranges: 8.6% for AGIs below $25k, 3.5% for AGIs $25k-50k, 2.8% for AGIs $50k-75k, 2.5% for AGIs $75k-100k, 3.6% for AGIs $100k-200k, 12.1% for AGIs over 200k)
Taxable individual retirement arrangement distribution: $12,036 (reported on 7.3% of returns)
37055:
$12,036
Tennessee:
$15,505
(% of AGI for various income ranges: 2.1% for AGIs below $25k, 1.8% for AGIs $25k-50k, 1.8% for AGIs $50k-75k, 2.1% for AGIs $75k-100k, 3.8% for AGIs $100k-200k)
Self-employment retirement plans: $16,620 (reported on 0.4% of returns)
37055:
$16,620
Tennessee:
$22,567
Total itemized deductions: $18,387 (22% of AGI, reported on 18.1% of returns)
Here:
$18,387
State:
$21,976
Here:
21.8% of AGI
State:
17.8% of AGI
(% of AGI for various income ranges: 5.2% for AGIs below $25k, 6.9% for AGIs $25k-50k, 8.2% for AGIs $50k-75k, 8.5% for AGIs $75k-100k, 10.1% for AGIs $100k-200k, 8.3% for AGIs over 200k)
Charity contributions: $4,792 (reported on 13.3% of returns)
Here:
$4,792
State:
$6,709
(% of AGI for various income ranges: 0.5% for AGIs below $25k, 0.9% for AGIs $25k-50k, 1.2% for AGIs $50k-75k, 1.7% for AGIs $75k-100k, 2.5% for AGIs $100k-200k, 2.7% for AGIs over 200k)
Taxes paid: $3,590 (reported on 17.8% of returns)
37055:
$3,590
State:
$4,829
(% of AGI for various income ranges: 0.8% for AGIs below $25k, 1.2% for AGIs $25k-50k, 1.5% for AGIs $50k-75k, 1.7% for AGIs $75k-100k, 2.2% for AGIs $100k-200k, 1.7% for AGIs over 200k)
Earned income credit: $2,302 (reported on 24.1% of returns)
Here:
$2,302
State:
$2,404
(% of AGI for various income ranges: 7.7% for AGIs below $25k, 1.3% for AGIs $25k-50k)
Percentage of individuals using paid preparers for their 2012 taxes: 54.2%
Here:
54%
State:
52%
(% for various income ranges: 50.5% for AGIs below $25k, 54.8% for AGIs $25k-50k, 58.4% for AGIs $50k-75k, 56.8% for AGIs $75k-100k, 61.6% for AGIs $100k-200k, 78.6% for AGIs over 200k)
Averages for the 2004 tax year for zip code 37055, filed in 2005:
Average Adjusted Gross Income (AGI) in 2004: $36,795 (Individual Income Tax Returns)
Here:
$36,795
State:
$44,088
Salary/wage: $34,670 (reported on 86.7% of returns)
Here:
$34,670
State:
$38,825
(% of AGI for various income ranges: 114.3% for AGIs below $10k, 79.9% for AGIs $10k-25k, 87.4% for AGIs $25k-50k, 86.6% for AGIs $50k-75k, 85.4% for AGIs $75k-100k, 64.3% for AGIs over 100k)
Taxable interest for individuals: $1,468 (reported on 33.8% of returns)
This zip code:
$1,468
Tennessee:
$1,802
(% of AGI for various income ranges: 5.6% for AGIs below $10k, 2.0% for AGIs $10k-25k, 1.1% for AGIs $25k-50k, 1.1% for AGIs $50k-75k, 1.0% for AGIs $75k-100k, 1.4% for AGIs over 100k)
Taxable dividends: $1,861 (reported on 13.4% of returns)
Here:
$1,861
State:
$3,727
(% of AGI for various income ranges: 2.0% for AGIs below $10k, 0.6% for AGIs $10k-25k, 0.4% for AGIs $25k-50k, 0.4% for AGIs $50k-75k, 0.4% for AGIs $75k-100k, 1.5% for AGIs over 100k)
Net capital gain/loss: +$9,804 (reported on 10.2% of returns)
Here:
+$9,804
State:
+$15,776
(% of AGI for various income ranges: -1.0% for AGIs below $10k, 0.3% for AGIs $10k-25k, 0.4% for AGIs $25k-50k, 0.9% for AGIs $50k-75k, 2.0% for AGIs $75k-100k, 9.9% for AGIs over 100k)
Profit/loss from business: +$10,118 (reported on 16.8% of returns)
Here:
+$10,118
State:
+$12,882
(% of AGI for various income ranges: 7.2% for AGIs below $10k, 5.8% for AGIs $10k-25k, 2.9% for AGIs $25k-50k, 3.3% for AGIs $50k-75k, 2.7% for AGIs $75k-100k, 8.7% for AGIs over 100k)
IRA payment deduction: $3,174 (reported on 1.6% of returns)
37055:
$3,174
Tennessee:
$2,934
(% of AGI for various income ranges: 0.1% for AGIs $10k-25k, 0.1% for AGIs $25k-50k, 0.1% for AGIs $50k-75k, 0.2% for AGIs $75k-100k, 0.2% for AGIs over 100k)
Self-employed pension: $12,154 (reported on 0.5% of returns)
Here:
$12,154
Tennessee:
$16,857
Total itemized deductions: $15,797 (23% of AGI, reported on 21.3% of returns)
Here:
$15,797
State:
$18,035
Here:
22.6% of AGI
State:
19.9% of AGI
(% of AGI for various income ranges: 6.7% for AGIs below $10k, 5.6% for AGIs $10k-25k, 8.2% for AGIs $25k-50k, 9.9% for AGIs $50k-75k, 10.3% for AGIs $75k-100k, 10.9% for AGIs over 100k)
Charity contributions deductions: $3,656 (5% of AGI, reported on 16.9% of returns)
Here:
$3,656
State:
$5,167
Here:
4.9% of AGI
State:
5.3% of AGI
(% of AGI for various income ranges: 0.4% for AGIs below $10k, 0.6% for AGIs $10k-25k, 1.1% for AGIs $25k-50k, 1.6% for AGIs $50k-75k, 2.2% for AGIs $75k-100k, 2.9% for AGIs over 100k)
Total tax: $4,934 (reported on 72.8% of returns)
37055:
$4,934
State:
$7,482
(% of AGI for various income ranges: 4.2% for AGIs below $10k, 4.0% for AGIs $10k-25k, 6.5% for AGIs $25k-50k, 8.7% for AGIs $50k-75k, 10.5% for AGIs $75k-100k, 18.5% for AGIs over 100k)
Earned income credit: $1,851 (reported on 20.8% of returns)
Here:
$1,851
State:
$1,826
Percentage of individuals using paid preparers for their 2004 taxes: 62.2%
Here:
62%
State:
60%
(% for various income ranges: 54.9% for AGIs below $10k, 65.0% for AGIs $10k-25k, 63.7% for AGIs $25k-50k, 63.2% for AGIs $50k-75k, 56.9% for AGIs $75k-100k, 73.7% for AGIs over 100k)
Household received Food Stamps/SNAP in the past 12 months: 1,076 Household did not receive Food Stamps/SNAP in the past 12 months: 10,311
Women who had a birth in the past 12 months: 393 (177 now married, 210 unmarried) Women who did not have a birth in the past 12 months: 6,039 (3,069 now married, 2,970 unmarried)
Housing units in zip code 37055 with a mortgage: 4,693 (486 second mortgage, 447 both second mortgage and home equity loan) Houses without a mortgage: 127
Median monthly owner costs for units with a mortgage: $1,332 Median monthly owner costs for units without a mortgage: $427
Residents with income below the poverty level in 2022:
This zip code:
12.2%
Whole state:
13.3%
Residents with income below 50% of the poverty level in 2022:
This zip code:
7.3%
Whole state:
7.1%
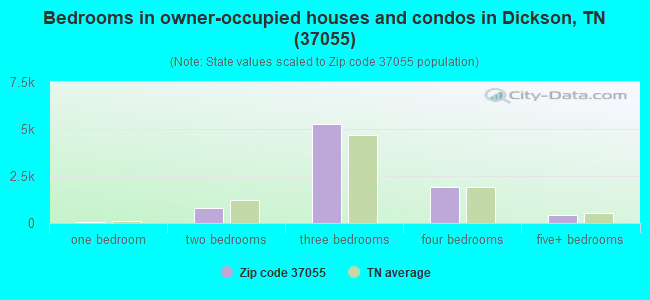
Median number of rooms in houses and condos:
Here:
6.2
State:
6.5
Median number of rooms in apartments:
Here:
4.8
State:
4.4
Notable locations in this zip code not listed on our city pages
Notable locations in zip code 37055: Dickson County Industrial Park (A), Mount Sinai (B), Dickson Golf and Country Club (C), Donegan Crossing (D), Sylvia - Yellow Creek Fire Department (E), Tennessee City Volunteer Fire Department Station 2 (F), City of Dickson Fire Department Station 2 (G), Dickson County Rescue Squad (H), Tennessee City Volunteer Fire Department (I), City of Dickson Fire Department Station 1 (J), Dickson Municipal Building (K), First Call Ambulance Service Dickson (L), Dickson County Ambulance Service (M). Display/hide their locations on the map
Churches in zip code 37055 include: Mount Lebanon Church (A), Maple Grove Missionary Baptist Church (B), Jason Chapel Church of the Nazarene (C), Fairview Baptist Church (D), Bethel Church (E), Bear Creek Freewill Baptist Church (F), Sycamore Church (G), Pond Church (H), Kedron Church (I). Display/hide their locations on the map
Cemeteries: Humble Cemetery (1), Seals Cemetery (2), Thompson Cemetery (3), Tucker Cemetery (4), Union Cemetery (5), Vineyard Cemetery (6), Weems Cemetery (7). Display/hide their locations on the map
Lakes and reservoirs: Indian Pond (A), Twin Lake (B), Stewarts Lake (C), Dickson Lake (D), Luther Lake (E), Craig Lake Number Two (F), Luther Lake Number One (G), Simmons Lake (H). Display/hide their locations on the map
Streams, rivers, and creeks: Leech Branch (A), Worley Furnace Branch (B), Johnson Branch (C), Jenkins Creek (D), Hunt Branch (E), Grab Creek (F), Fielder Branch (G), Fannie Branch (H), Dry Hollow Branch (I). Display/hide their locations on the map
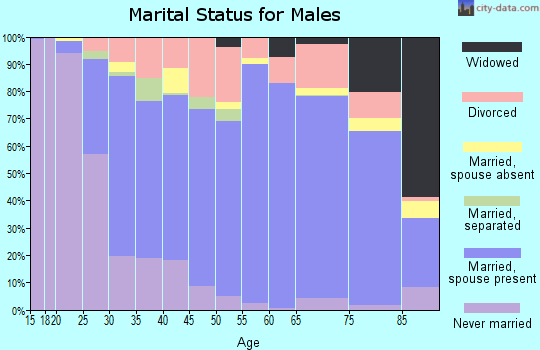
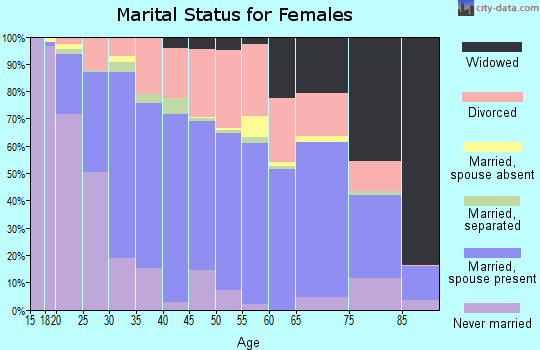
3,737 married couples with children.
1,949 single-parent households (277 men, 1,672 women).
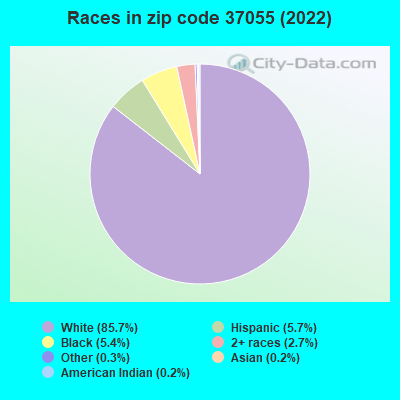
96.8% of residents of 37055 zip code speak English at home.
2.6% of residents speak Spanish at home (60% very well, 7% well, 12% not well, 21% not at all).
0.3% of residents speak other Indo-European language at home (64% very well, 23% well, 13% not well).
0.1% of residents speak Asian or Pacific Island language at home (64% very well, 3% well, 33% not well).
0.1% of residents speak other language at home (100% very well).
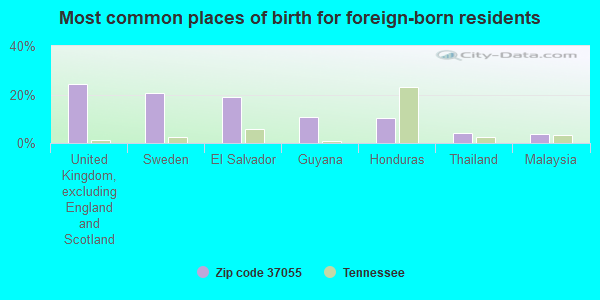
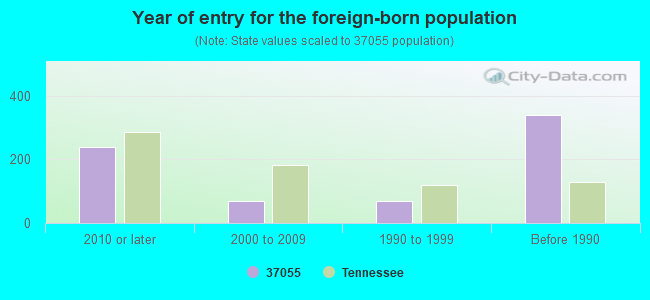
Foreign born population: 613 (2.1%) (46.2% of them are naturalized citizens)
Major facilities with environmental interests located in this zip code:
DICKSON COUNTY HIGH SCHOOL (509 HENSLEE DR in DICKSON, TN)
(Geographic Names Information System) (National Center for Education Statistics) - STATE ID-0025 Organizations: DICKSON COUNTY SCHOOL DISTRICT (SCHOOL DISTRICT)
DICKSON ELEMENTARY SCHOOL (120 W BROAD ST in DICKSON, TN)
(Geographic Names Information System) (National Center for Education Statistics) - STATE ID-0020 Organizations: DICKSON COUNTY SCHOOL DISTRICT (SCHOOL DISTRICT)
CENTENNIAL ELEM (198 UPPER LAKE DR in DICKSON, TN)
(National Center for Education Statistics) - STATE ID-0008 Organizations: DICKSON COUNTY SCHOOL DISTRICT (SCHOOL DISTRICT)
CLASSIC CLEANERS (112 SYLVIS STREET in DICKSON, TN)
AIR MINOR (AIRS/AFS) Conditionally Exempt Small Quantity Generators, less than 100 kg/month of hazardous waste (Resource Conservation and Recovery Act (tracking hazardous waste)) - notification Business SIC classification: COIN-OPERATED LAUNDRIES AND DRYCLEANING Organizations: RICKY R NELSON (CONTACT/OPERATOR)
, CHARLEY BLUNT (CONTACT/OPERATOR)
Alternative names: CLASSIC CLNRS
DICKSON MIDDLE (401 E COLLEGE ST in DICKSON, TN)
(National Center for Education Statistics) - STATE ID-0023 Organizations: DICKSON COUNTY SCHOOL DISTRICT (SCHOOL DISTRICT)
DICKSON CO-STUART BURNS ES (STUART BURNS ELEM. in DICKSON, TN)
National Pollutant Discharge Elimination System NON-MAJOR (Tracking pollutant discharge elimination systems) - permit Business SIC classification: SECURITY BROKERS, DEALERS, AND FLOTATION COMPANIES Organizations: DICKSON COUNTY BOARD OF EDUCAT (CONTACT/OPERATOR)
Alternative names: STUART BURNS ELEM. SCH.
DICKSON COUNTY SANITARY LANDFILL (ROUTE 5 BOX 850B ENO ROAD in DICKSON, TN)
AIR MINOR (AIRS/AFS) SUPERFUND (Superfund database) CRITERIA AND HAZARDOUS AIR POLLUTANT INVENTORY (Inventory of air pollution sources) Business SIC classification: REFUSE SYSTEMS Alternative names: DICKSON COUNTY LANDFILL, DICKSON COUNTY SANITARYLANDFILL
DOOR FABRICATION SERVICES INC (921 EAST RAILROAD STREET in DICKSON, TN)
(Resource Conservation and Recovery Act (tracking hazardous waste)) Business NAICS classification: WOOD WINDOW AND DOOR MANUFACTURING. Organizations: PHILLIP ARCHER (CONTACT/OPERATOR)
, MASONITE US HOLDINGS INC (CONTACT/OWNER)
Alternative names: EVERGREEN ENTRY SYSTEMS INC DBA PREMDOR
Small Quantity Generators, between 100 kg and 1000 kg of hazardous waste/month (Resource Conservation and Recovery Act (tracking hazardous waste)) TRI REPORTER (Tracking of toxic chemicals releasing facilities) Business SIC classification: PLASTICS FOAM PRODUCTS Organizations: JOSEPH W. CLARK (CONTACT/OPERATOR)
Alternative names: BRIDGESTONE APM - PLANT 4
DICKSON ELECTRIC DEPARTMENT (236 COWAN ROAD in DICKSON, TN)
COMPLIANCE ACTIVITY (Tracking inspections of insecticide, fungicide, and rodenticide, and toxic substances) (Resource Conservation and Recovery Act (tracking hazardous waste)) Business NAICS classification: OTHER ELECTRIC POWER GENERATION. Organizations: JAMES PEELER (CONTACT/OPERATOR)
Alternative names: DICKSON DEPT. OF ELECTRICITY
A G SIMPSON COMPANY INCORPORATED (1 SIMPSON BOULEVARD in DICKSON, TN)
AIR MINOR (AIRS/AFS) Business SIC classification: MOTOR VEHICLE PARTS AND ACCESSORIES
ALL STATE TERMITE & PEST CONTROL, INC. (PO BOX 621 in DICKSON, TN)
(Resource Conservation and Recovery Act (tracking hazardous waste))
BRAD RAGAN TIRE AND APPLIANCE (HGWY 70 BYPASS in DICKSON, TN)
(Resource Conservation and Recovery Act (tracking hazardous waste)) Business NAICS classification: GENERAL AUTOMOTIVE REPAIR.
Housing units lacking complete plumbing facilities: 0.6% Housing units lacking complete kitchen facilities: 2.5%
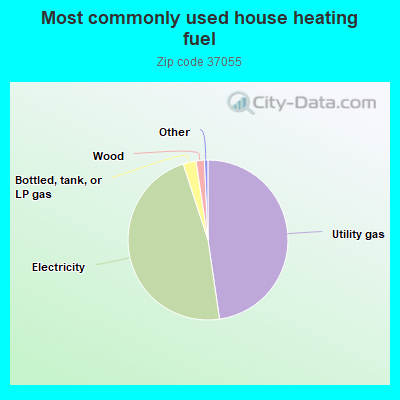
47.7%Utility gas
47.3%Electricity
2.6%Bottled, tank, or LP gas
1.7%Wood
Population in 1990: 17,724. Population change in the 1990s: +6,601 (+37.2%).
Place of birth for U.S.-born residents:
This state: 18,241
Northeast: 1,464
Midwest: 3,213
South: 3,774
West: 1,140
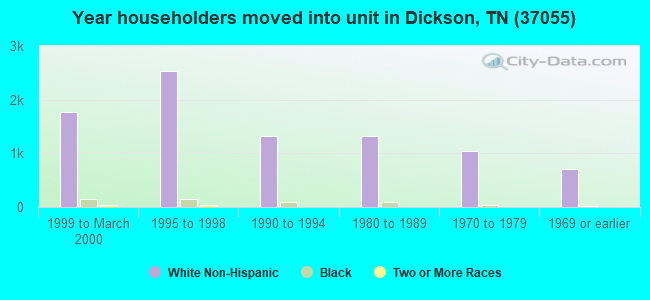
53% of the 37055 zip code residents lived in the same house 5 years ago. Out of people who lived in different houses, 58% lived in this county. Out of people who lived in different counties, 50% lived in Tennessee.
89% of the 37055 zip code residents lived in the same house 1 year ago. Out of people who lived in different houses, 49% moved from this county. Out of people who lived in different houses, 21% moved from different county within same state. Out of people who lived in different houses, 28% moved from different state. Out of people who lived in different houses, 1% moved from abroad.
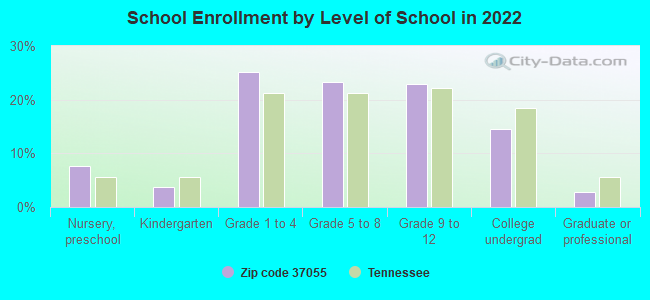
Private vs. public school enrollment:
Students in private schools in grades 1 to 8 (elementary and middle school): 489
Here:
17.6%
Tennessee:
15.0%
Students in private schools in grades 9 to 12 (high school): 242
Here:
18.4%
Tennessee:
16.2%
Students in private undergraduate colleges: 205
Here:
24.9%
Tennessee:
23.5%
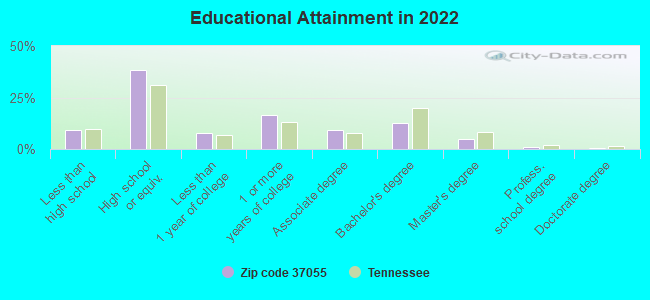
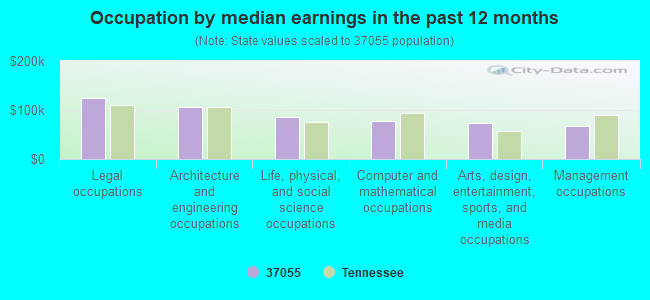
Occupation by median earnings in the past 12 months ($)
124,003Legal occupations
106,315Architecture and engineering occupations
84,876Life, physical, and social science occupations
78,121Computer and mathematical occupations
73,297Arts, design, entertainment, sports, and media occupations
67,347Management occupations
Companies with federal contracts located in this zip code (DICKSON, TN):
TITAN ENGINEERING AND MECHANIC (202 DRAGON DR; small business) : $93,050 in 2 contractsfrom 2001 to 2005
$58,088 with Army for Plumbing Fixtures and Accessories. Signed on 2005-02-25. Completion date: 2005-04-26.
$34,962 with Army for Maintenance, Repair or Alteration of Real Property -- Maintenance Buildings. Taking place in KY. Signed on 2001-09-28. Completion date: 2001-12-20.
DICKSON MACHINE & TOOL, INCORP (218 SKYLINE CIRCLE; small business) : $60,640 in 8 contractsfrom 2002 to 2003
Contracts for Maintenance, Repair and Rebuilding of Equipment -- Special Industry Machinery, Maintenance, Repair and Rebuilding of Equipment -- Bearings, Miscellaneous Special Industry Machinery by U.S. Army Corps of Engineers - civil program financing only Signed by year:2000: $0; 2001: $0; 2002: $48,860; 2003: $11,780; 2004: $0; 2005: $0; 2006: $0.
Biggest contracts:
$35,000 with U.S. Army Corps of Engineers - civil program financing only for Maintenance, Repair and Rebuilding of Equipment -- Special Industry Machinery. Signed on 2002-11-06. Completion date: 2002-11-22.
$14,775 with U.S. Army Corps of Engineers - civil program financing only for Maintenance, Repair and Rebuilding of Equipment -- Bearings. Signed on 2003-07-01. Completion date: 2003-07-09.
$13,860 with U.S. Army Corps of Engineers - civil program financing only for Maintenance, Repair and Rebuilding of Equipment -- Special Industry Machinery. Signed on 2002-10-23. Completion date: 2002-10-15.
$12,600 with U.S. Army Corps of Engineers - civil program financing only for Miscellaneous Special Industry Machinery. Signed on 2003-09-18. Completion date: 2003-09-30.
ZERO3 CORPORATION (235 FIRETOWER ROAD; small business)
$39,989 with Air Force for Miscellaneous Household and Commercial Furnishings and Appliances. Signed on 2006-05-03. Completion date: 2006-06-21.
STEWART, E W LUMBER CO , INC (302 WALNUT ST; small business)
$27,836 with Army for Lumber and Related Basic Wood Materials. Taking place in KY. Signed on 2000-01-24. Completion date: 2000-01-28.
MAINTENANCE SOLUTIONS LLC (105 HOLLAND TRAIL; small business)
$6,180 with Army for Construction of Structures and Facilities -- Other Administrative Facilities and Service Buildings. Signed on 2005-09-14. Completion date: 2005-09-23.
Top industries in this zip code by the number of employees in 2005:
Health Care and Social Assistance: General Medical and Surgical Hospitals (500-999 employees: 1 establishment)
Administrative and Support and Waste Management and Remediation Services: Temporary Help Services (250-499: 1, 100-249: 2, 10-19: 1)
2002 - 2018 National Fire Incident Reporting System (NFIRS) incidents
Based on the data from the years 2002 - 2018 the average number of fire incidents per year is 192. The highest number of reported fires - 362 took place in 2007, and the least - 81 in 2002. The data has a growing trend.
When looking into fire subcategories, the most reports belonged to: Outside Fires (45.5%), and Structure Fires (25.2%).
Fire incident types reported to NFIRS in Zip Code 37055


 Nearest zip codes: 37181, 37029, 37025, 37101, 37137, 37165.


 Based on the data from the years 2002 - 2018 the average number of fire incidents per year is 192. The highest number of reported fires - 362 took place in 2007, and the least - 81 in 2002. The data has a growing trend.
 When looking into fire subcategories, the most reports belonged to: Outside Fires (45.5%), and Structure Fires (25.2%).