Estimated zip code population in 2022: 20,786 Zip code population in 2010: 16,067 Zip code population in 2000: 15,272
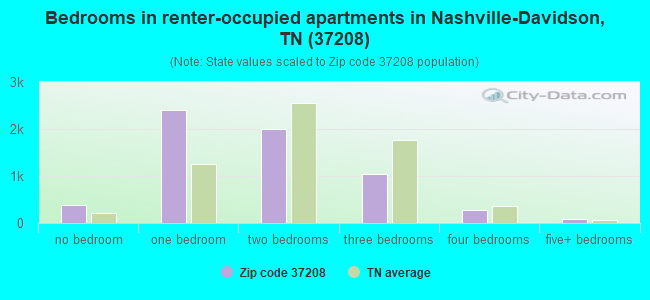
Houses and condos: 10,410 Renter-occupied apartments: 6,143
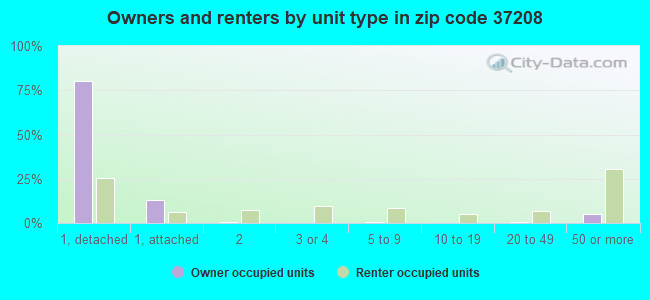
% of renters here:
68%
State:
33%
March 2022 cost of living index in zip code 37208: 92.6 (less than average, U.S. average is 100)
Land area: 4.6 sq. mi. Water area: 0.2 sq. mi.
Population density: 4,502 people per square mile
(average).
OSM Map
General Map
Google Map
MSN Map
OSM Map
General Map
Google Map
MSN Map
OSM Map
General Map
Google Map
MSN Map
OSM Map
General Map
Google Map
MSN Map
Please wait while loading the map...
Real estate property taxes paid for housing units in 2022:
This zip code:
0.4% ($1,944)
Tennessee:
0.5% ($1,376)
Median real estate property taxes paid for housing units with mortgages in 2022: $2,178 (0.5%) Median real estate property taxes paid for housing units with no mortgage in 2022: $1,727 (0.4%)
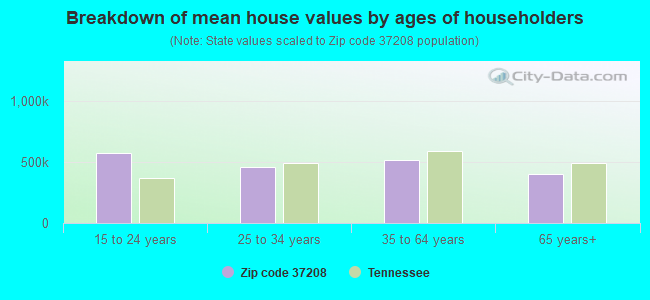
Estimated median house/condo value in 2022: $455,116
37208:
$455,116
Tennessee:
$284,800
According to our research of Tennessee and other state lists, there were 37 registered sex offenders living in 37208 zip code as of April 27, 2024. The ratio of all residents to sex offenders in zip code 37208 is 469 to 1. The ratio of registered sex offenders to all residents in this zip code is lower than the state average.
Median resident age:
This zip code:
30.4 years
Tennessee median age:
39.2 years
Average household size:
This zip code:
2.0 people
Tennessee:
2.4 people
Averages for the 2020 tax year for zip code 37208, filed in 2021:
Average Adjusted Gross Income (AGI) in 2020: $59,794 (Individual Income Tax Returns)
Here:
$59,794
State:
$69,014
Salary/wage: $54,542 (reported on 91.2% of returns)
Here:
$54,542
State:
$55,872
(% of AGI for various income ranges: 1126.2% for AGIs below $25k, 3874.3% for AGIs $25k-50k, 7072.1% for AGIs $50k-75k, 10908.7% for AGIs $75k-100k, 19608.1% for AGIs $100k-200k, 90513.8% for AGIs over 200k)
Taxable interest for individuals: $670 (reported on 16.2% of returns)
This zip code:
$670
Tennessee:
$1,945
(% of AGI for various income ranges: 0.8% for AGIs below $25k, 4.5% for AGIs $25k-50k, 5.8% for AGIs $50k-75k, 9.6% for AGIs $75k-100k, 38.4% for AGIs $100k-200k, 471.5% for AGIs over 200k)
Ordinary dividends: $2,483 (reported on 15.5% of returns)
Here:
$2,483
State:
$8,105
(% of AGI for various income ranges: 3.8% for AGIs below $25k, 13.5% for AGIs $25k-50k, 23.9% for AGIs $50k-75k, 69.4% for AGIs $75k-100k, 159.0% for AGIs $100k-200k, 1411.5% for AGIs over 200k)
Net capital gain/loss in AGI: +$12,132 (reported on 14.8% of returns)
Here:
+$12,132
State:
+$33,664
(% of AGI for various income ranges: 5.7% for AGIs below $25k, 18.1% for AGIs $25k-50k, 54.4% for AGIs $50k-75k, 114.1% for AGIs $75k-100k, 420.5% for AGIs $100k-200k, 10631.5% for AGIs over 200k)
Profit/loss from business: +$17,829 (reported on 16.5% of returns)
Here:
+$17,829
State:
+$18,991
(% of AGI for various income ranges: 92.3% for AGIs below $25k, 150.3% for AGIs $25k-50k, 225.8% for AGIs $50k-75k, 467.2% for AGIs $75k-100k, 1014.6% for AGIs $100k-200k, 9284.6% for AGIs over 200k)
Taxable individual retirement arrangement distribution: $14,171 (reported on 2.1% of returns)
37208:
$14,171
Tennessee:
$20,036
(% of AGI for various income ranges: 8.0% for AGIs below $25k, 11.5% for AGIs $25k-50k, 25.8% for AGIs $50k-75k, 236.7% for AGIs $100k-200k, 515.4% for AGIs over 200k)
Self-employed (Keogh) retirement plans: $23,933 (reported on 0.6% of returns)
37208:
$23,933
Tennessee:
$28,955
(% of AGI for various income ranges: 79.1% for AGIs $75k-100k, 776.2% for AGIs over 200k)
Total itemized deductions: $25,353 (reported on 7.1% of returns)
Here:
$25,353
State:
$40,136
(% of AGI for various income ranges: 21.2% for AGIs below $25k, 70.4% for AGIs $25k-50k, 150.9% for AGIs $50k-75k, 397.0% for AGIs $75k-100k, 920.0% for AGIs $100k-200k, 5004.6% for AGIs over 200k)
Charity contributions: $7,527 (reported on 5.0% of returns)
Here:
$7,527
State:
$19,852
(% of AGI for various income ranges: 13.8% for AGIs $25k-50k, 16.9% for AGIs $50k-75k, 48.1% for AGIs $75k-100k, 167.3% for AGIs $100k-200k, 1542.3% for AGIs over 200k)
Taxes paid: $5,975 (reported on 6.8% of returns)
37208:
$5,975
State:
$6,038
(% of AGI for various income ranges: 2.9% for AGIs below $25k, 12.1% for AGIs $25k-50k, 29.3% for AGIs $50k-75k, 85.4% for AGIs $75k-100k, 218.9% for AGIs $100k-200k, 1207.7% for AGIs over 200k)
Earned income credit: $2,205 (reported on 21.7% of returns)
Here:
$2,205
State:
$2,391
(% of AGI for various income ranges: 121.3% for AGIs below $25k, 51.5% for AGIs $25k-50k)
Percentage of individuals using paid preparers for their 2020 taxes: 94.5%
Here:
95%
State:
93%
(% for various income ranges: 93.1% for AGIs below $25k, 94.1% for AGIs $25k-50k, 94.7% for AGIs $50k-75k, 97.3% for AGIs $75k-100k, 97.1% for AGIs $100k-200k, 97.6% for AGIs over 200k)
Averages for the 2012 tax year for zip code 37208, filed in 2013:
Average Adjusted Gross Income (AGI) in 2012: $29,342 (Individual Income Tax Returns)
Here:
$29,342
State:
$53,767
Salary/wage: $28,138 (reported on 90.3% of returns)
Here:
$28,138
State:
$45,421
(% of AGI for various income ranges: 84.6% for AGIs below $25k, 91.2% for AGIs $25k-50k, 88.5% for AGIs $50k-75k, 82.8% for AGIs $75k-100k, 85.5% for AGIs $100k-200k, 81.0% for AGIs over 200k)
Taxable interest for individuals: $353 (reported on 9.8% of returns)
This zip code:
$353
Tennessee:
$1,732
(% of AGI for various income ranges: 0.2% for AGIs $50k-75k, 0.1% for AGIs $75k-100k, 0.2% for AGIs $100k-200k, 0.1% for AGIs over 200k)
Ordinary dividends: $3,470 (reported on 5.6% of returns)
Here:
$3,470
State:
$6,739
(% of AGI for various income ranges: 0.6% for AGIs below $25k, 0.6% for AGIs $25k-50k, 1.2% for AGIs $50k-75k, 0.5% for AGIs $75k-100k, 0.6% for AGIs $100k-200k, 0.8% for AGIs over 200k)
Net capital gain/loss in AGI: +$2,589 (reported on 3.9% of returns)
Here:
+$2,589
State:
+$19,082
(% of AGI for various income ranges: 0.1% for AGIs $25k-50k, 0.5% for AGIs $50k-75k, 0.5% for AGIs $100k-200k, 1.7% for AGIs over 200k)
Profit/loss from business: +$11,579 (reported on 13.4% of returns)
Here:
+$11,579
State:
+$15,240
(% of AGI for various income ranges: 8.8% for AGIs below $25k, 2.4% for AGIs $25k-50k, 1.8% for AGIs $50k-75k, 5.6% for AGIs $75k-100k, 11.8% for AGIs $100k-200k)
Taxable individual retirement arrangement distribution: $9,738 (reported on 2.2% of returns)
37208:
$9,738
Tennessee:
$15,505
(% of AGI for various income ranges: 0.4% for AGIs below $25k, 0.4% for AGIs $25k-50k, 1.7% for AGIs $50k-75k, 2.2% for AGIs $100k-200k)
Total itemized deductions: $16,506 (21% of AGI, reported on 12.3% of returns)
Here:
$16,506
State:
$21,976
Here:
20.6% of AGI
State:
17.8% of AGI
(% of AGI for various income ranges: 3.0% for AGIs below $25k, 6.9% for AGIs $25k-50k, 8.6% for AGIs $50k-75k, 11.4% for AGIs $75k-100k, 10.8% for AGIs $100k-200k, 7.3% for AGIs over 200k)
Charity contributions: $4,028 (reported on 9.7% of returns)
Here:
$4,028
State:
$6,709
(% of AGI for various income ranges: 0.4% for AGIs below $25k, 1.2% for AGIs $25k-50k, 1.6% for AGIs $50k-75k, 2.1% for AGIs $75k-100k, 2.2% for AGIs $100k-200k, 2.0% for AGIs over 200k)
Taxes paid: $3,650 (reported on 11.7% of returns)
37208:
$3,650
State:
$4,829
(% of AGI for various income ranges: 0.4% for AGIs below $25k, 1.2% for AGIs $25k-50k, 1.8% for AGIs $50k-75k, 2.5% for AGIs $75k-100k, 2.8% for AGIs $100k-200k, 2.1% for AGIs over 200k)
Earned income credit: $2,582 (reported on 41.3% of returns)
Here:
$2,582
State:
$2,404
(% of AGI for various income ranges: 11.7% for AGIs below $25k, 1.5% for AGIs $25k-50k)
Percentage of individuals using paid preparers for their 2012 taxes: 42.0%
Here:
42%
State:
52%
(% for various income ranges: 42.0% for AGIs below $25k, 38.3% for AGIs $25k-50k, 43.5% for AGIs $50k-75k, 50.0% for AGIs $75k-100k, 52.4% for AGIs $100k-200k, 80.0% for AGIs over 200k)
Averages for the 2004 tax year for zip code 37208, filed in 2005:
Average Adjusted Gross Income (AGI) in 2004: $21,294 (Individual Income Tax Returns)
Here:
$21,294
State:
$44,088
Salary/wage: $20,482 (reported on 92.8% of returns)
Here:
$20,482
State:
$38,825
(% of AGI for various income ranges: 95.2% for AGIs below $10k, 91.8% for AGIs $10k-25k, 91.3% for AGIs $25k-50k, 85.2% for AGIs $50k-75k, 86.0% for AGIs $75k-100k, 70.9% for AGIs over 100k)
Taxable interest for individuals: $510 (reported on 9.9% of returns)
This zip code:
$510
Tennessee:
$1,802
(% of AGI for various income ranges: 0.3% for AGIs below $10k, 0.2% for AGIs $10k-25k, 0.2% for AGIs $25k-50k, 0.5% for AGIs $50k-75k, 0.1% for AGIs $75k-100k, 0.2% for AGIs over 100k)
Taxable dividends: $464 (reported on 3.8% of returns)
Here:
$464
State:
$3,727
(% of AGI for various income ranges: 0.0% for AGIs below $10k, 0.0% for AGIs $10k-25k, 0.0% for AGIs $25k-50k, 0.2% for AGIs $50k-75k, 0.1% for AGIs $75k-100k, 0.4% for AGIs over 100k)
Net capital gain/loss: +$2,654 (reported on 2.8% of returns)
Here:
+$2,654
State:
+$15,776
(% of AGI for various income ranges: -0.1% for AGIs below $10k, 0.0% for AGIs $10k-25k, -0.0% for AGIs $25k-50k, 1.1% for AGIs $50k-75k, 0.0% for AGIs $75k-100k, 3.1% for AGIs over 100k)
Profit/loss from business: +$5,789 (reported on 7.8% of returns)
Here:
+$5,789
State:
+$12,882
(% of AGI for various income ranges: 2.7% for AGIs below $10k, 2.1% for AGIs $10k-25k, 1.8% for AGIs $25k-50k, 0.5% for AGIs $50k-75k, -0.1% for AGIs $75k-100k, 7.3% for AGIs over 100k)
IRA payment deduction: $833 (reported on 0.3% of returns)
37208:
$833
Tennessee:
$2,934
Total itemized deductions: $13,264 (28% of AGI, reported on 10.8% of returns)
Here:
$13,264
State:
$18,035
Here:
27.9% of AGI
State:
19.9% of AGI
(% of AGI for various income ranges: 2.9% for AGIs below $10k, 4.1% for AGIs $10k-25k, 6.8% for AGIs $25k-50k, 11.9% for AGIs $50k-75k, 10.4% for AGIs $75k-100k, 10.7% for AGIs over 100k)
Charity contributions deductions: $3,742 (8% of AGI, reported on 9.4% of returns)
Here:
$3,742
State:
$5,167
Here:
7.6% of AGI
State:
5.3% of AGI
(% of AGI for various income ranges: 0.4% for AGIs below $10k, 0.7% for AGIs $10k-25k, 1.7% for AGIs $25k-50k, 3.4% for AGIs $50k-75k, 3.0% for AGIs $75k-100k, 3.0% for AGIs over 100k)
Total tax: $2,762 (reported on 50.6% of returns)
37208:
$2,762
State:
$7,482
(% of AGI for various income ranges: 1.2% for AGIs below $10k, 2.7% for AGIs $10k-25k, 6.5% for AGIs $25k-50k, 10.6% for AGIs $50k-75k, 12.5% for AGIs $75k-100k, 18.2% for AGIs over 100k)
Earned income credit: $1,919 (reported on 47.4% of returns)
Here:
$1,919
State:
$1,826
Percentage of individuals using paid preparers for their 2004 taxes: 64.9%
Here:
65%
State:
60%
(% for various income ranges: 64.2% for AGIs below $10k, 70.0% for AGIs $10k-25k, 59.3% for AGIs $25k-50k, 57.0% for AGIs $50k-75k, 55.2% for AGIs $75k-100k, 69.6% for AGIs over 100k)
Likely homosexual households (counted as self-reported same-sex unmarried-partner households)
Lesbian couples: 0.0% of all households
Gay men: 0.1% of all households
Household received Food Stamps/SNAP in the past 12 months: 1,714 Household did not receive Food Stamps/SNAP in the past 12 months: 7,342
Women who had a birth in the past 12 months: 74 (17 now married, 55 unmarried) Women who did not have a birth in the past 12 months: 7,832 (1,683 now married, 6,145 unmarried)
Housing units in zip code 37208 with a mortgage: 2,062 (205 second mortgage, 91 both second mortgage and home equity loan) Houses without a mortgage: 36
Median monthly owner costs for units with a mortgage: $1,842 Median monthly owner costs for units without a mortgage: $448
Residents with income below the poverty level in 2022:
This zip code:
24.5%
Whole state:
13.3%
Residents with income below 50% of the poverty level in 2022:
This zip code:
12.3%
Whole state:
7.1%
Median number of rooms in houses and condos:
Here:
5.5
State:
6.5
Median number of rooms in apartments:
Here:
3.8
State:
4.4
Notable locations in this zip code not listed on our city pages
Notable locations in zip code 37208: First Response Center (A), Fifteenth Avenue Baptist Church Day Care Center (B), Fifteenth Avenue Baptist Church Centerplex (C), Dorothy Brown Hall (D), Daniel T Rolfe Student Center (E), Clay E Simpson Junior Building (F), Boyd House (G), Westwood Baptist Church Youth Center (H), Stanley S Kresge Learning Center (I), Richardson House (J), North Branch Nashville Public Library (K), Meharry Student-Faculty Towers (L), Nashville Fire Department Station 11 (M), W E B Du Bois Honors Center (N), Talley-Brady Hall (O), Shane Hall (P), Scribner Hall (Q), Park-Johnson Hall (R), New Livingston Hall (S), Little Theater (T). Display/hide their locations on the map
Churches in zip code 37208 include: Hamilton Tabernacle Baptist Church (A), Hopewell Missionary Baptist Church (B), Bethel Church of God (C), Lee Chapel African Methodist Episcopal Church (D), James Tabernacle Baptist Church (E), House of God Church (F), Howard United Church (G), Bethlehem United Primitive Baptist Church (H), Hillcrest Seventh Day Aventist Church (I). Display/hide their locations on the map
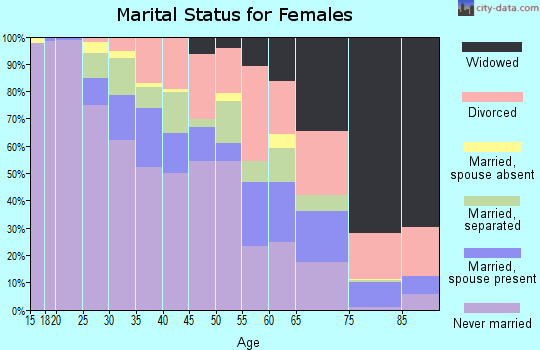
377 married couples with children.
1,463 single-parent households (167 men, 1,296 women).
95.8% of residents of 37208 zip code speak English at home.
1.4% of residents speak Spanish at home (81% very well, 19% well).
1.4% of residents speak other Indo-European language at home (92% very well, 8% well).
0.7% of residents speak Asian or Pacific Island language at home (56% very well, 44% well).
0.2% of residents speak other language at home (93% very well, 7% well).
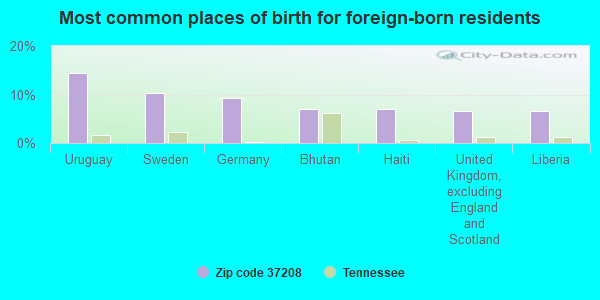
Foreign born population: 494 (2.4%) (41.9% of them are naturalized citizens)
This zip code:
2.4%
Whole state:
5.6%
14%Uruguay
10%Sweden
9%Germany
7%Bhutan
7%Haiti
7%United Kingdom, excluding England and Scotland
7%Liberia
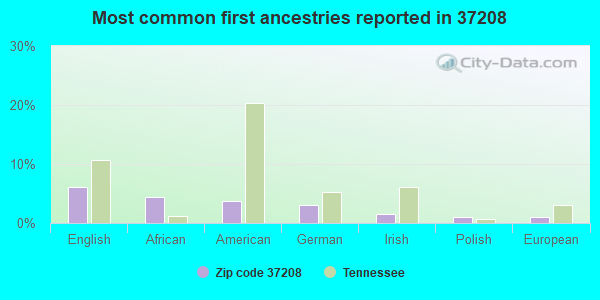
6%English
4%African
4%American
3%German
2%Irish
1%Polish
1%European
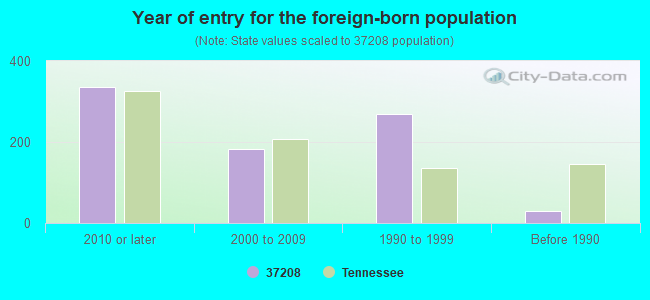
Year of entry for the foreign-born population
3362010 or later
1832000 to 2009
2681990 to 1999
30Before 1990
Major facilities with environmental interests located in this zip code:
ASHLAND CHEMICAL COMPANY (91 VAN BUREN STREET in NASHVILLE, TN)
AIR SYNTHETIC MINOR (AIRS/AFS) STATE MASTER (Maryland Permits tracking) - OIL CONTROL HAZARDOUS WASTE BIENNIAL REPORTER (Resource Conservation and Recovery Act (tracking hazardous waste)) Large Quantity Generators, more that 1000 kg of hazardous waste/month (Resource Conservation and Recovery Act (tracking hazardous waste)) - notification TRANSPORTER (Resource Conservation and Recovery Act (tracking hazardous waste)) Business SIC classification: SCRAP AND WASTE MATERIALS; CHEMICALS AND ALLIED PRODUCTS Organizations: ASHLAND CHEMICAL INC (CONTACT/OWNER)
Alternative names: JANUARY ENVIRONMENTAL SERVICES INC
BUENA VISTA / JONES PAIDEIA MAGNET (1531 9TH NO AV in NASHVILLE, TN)
(National Center for Education Statistics) - STATE ID-0070 Organizations: NASHVILLE-DAVIDSON COUNTY SD (SCHOOL DISTRICT)
AMERICAN ACE LLC (2500 HEIMAN STREET in NASHVILLE, TN)
AIR MINOR (AIRS/AFS) CRITERIA AND HAZARDOUS AIR POLLUTANT INVENTORY (Inventory of air pollution sources) Business SIC classification: ROASTED COFFEE
AMERICAN ASH RECYCLING CORP OF TENNESSEE (1915 CEMENT PLANT RD in NASHVILLE, TN)
(Resource Conservation and Recovery Act (tracking hazardous waste))
ARTISTIC IRON WORKS INCORPORATED (1026 HERMAN STREET in NASHVILLE, TN)
(Resource Conservation and Recovery Act (tracking hazardous waste)) Business NAICS classification: ORNAMENTAL AND ARCHITECTURAL METAL WORK MANUFACTURING.
C E D SAFETY CO., INC. (1219 4TH AVE N in NASHVILLE, TN)
(Resource Conservation and Recovery Act (tracking hazardous waste))
CALDWELLS ONE HOUR CLEANERS (2801 CLARKSVILLE HWY in NASHVILLE, TN)
(Resource Conservation and Recovery Act (tracking hazardous waste))
CHEM-GLAS (1111 THIRD AVENUE NORTH in NASHVILLE, TN)
(Resource Conservation and Recovery Act (tracking hazardous waste)) Business NAICS classification: MINERAL WOOL MANUFACTURING.; OVERHEAD TRAVELING CRANE, HOIST, AND MONORAIL SYSTEM MANUFACTURING.
(Resource Conservation and Recovery Act (tracking hazardous waste))
CUMBERLAND MACHINE COMPANY INC (1305 4TH AVE NORTH in NASHVILLE, TN)
Conditionally Exempt Small Quantity Generators, less than 100 kg/month of hazardous waste (Resource Conservation and Recovery Act (tracking hazardous waste)) Business NAICS classification: ALL OTHER MISCELLANEOUS GENERAL PURPOSE MACHINERY MANUFACTURING. Organizations: RAYMOND D LANE (CONTACT/OPERATOR)
BUZZI UNICEM USA (1818 CEMENT PLANT ROAD in NASHVILLE, TN)
AIR SYNTHETIC MINOR (AIRS/AFS) CRITERIA AND HAZARDOUS AIR POLLUTANT INVENTORY (Inventory of air pollution sources) Business SIC classification: CEMENT, HYDRAULIC Alternative names: SIGNAL MTN CEMENT CO
CHEMROCK CORPORATION (2601 OSAGE STREET in NASHVILLE, TN)
AIR SYNTHETIC MINOR (AIRS/AFS) CRITERIA AND HAZARDOUS AIR POLLUTANT INVENTORY (Inventory of air pollution sources) Business SIC classification: MINERALS AND EARTHS, GROUND OR OTHERWISE TREATED
ASHLAND CHEMICAL CO (91 VAN BUREN ST in NASHVILLE, TN)
CRITERIA AND HAZARDOUS AIR POLLUTANT INVENTORY (Inventory of air pollution sources) Business SIC classification: CHEMICALS AND ALLIED PRODUCTS
Housing units lacking complete plumbing facilities: 0.6% Housing units lacking complete kitchen facilities: 1.5%
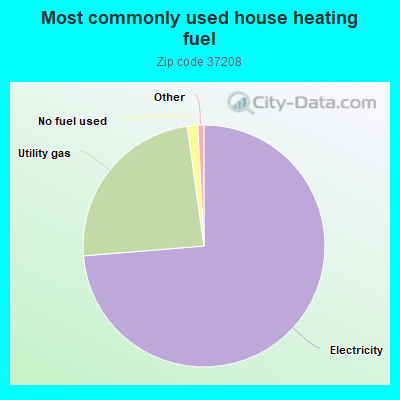
73.7%Electricity
24.1%Utility gas
1.4%No fuel used
Population in 1990: 15,535.
Place of birth for U.S.-born residents:
This state: 10,690
Northeast: 1,197
Midwest: 2,858
South: 4,366
West: 894
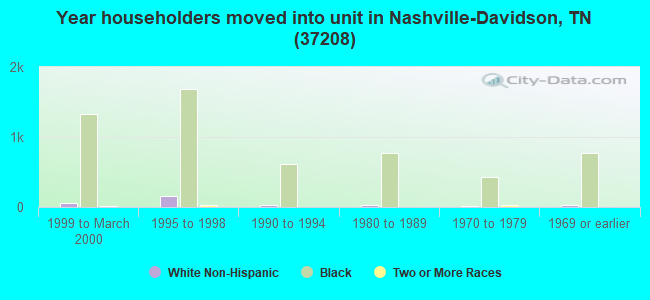
50% of the 37208 zip code residents lived in the same house 5 years ago. Out of people who lived in different houses, 78% lived in this county. Out of people who lived in different counties, 50% lived in Tennessee.
78% of the 37208 zip code residents lived in the same house 1 year ago. Out of people who lived in different houses, 51% moved from this county. Out of people who lived in different houses, 11% moved from different county within same state. Out of people who lived in different houses, 32% moved from different state. Out of people who lived in different houses, 1% moved from abroad.
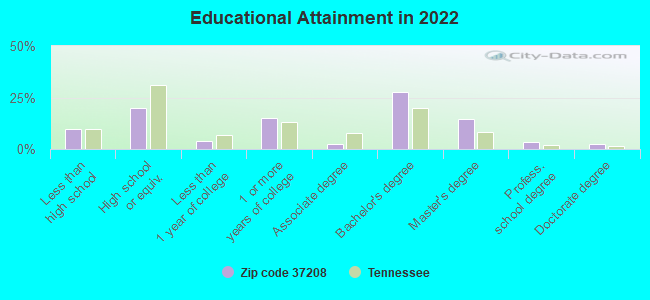
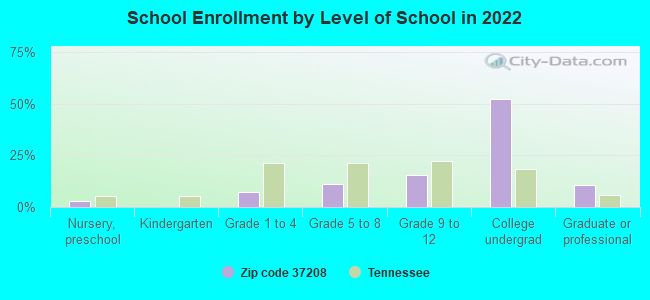
Private vs. public school enrollment:
Students in private schools in grades 1 to 8 (elementary and middle school): 171
Here:
16.1%
Tennessee:
15.0%
Students in private schools in grades 9 to 12 (high school):
Here:
0.0%
Tennessee:
16.2%
Students in private undergraduate colleges: 974
Here:
32.1%
Tennessee:
23.5%
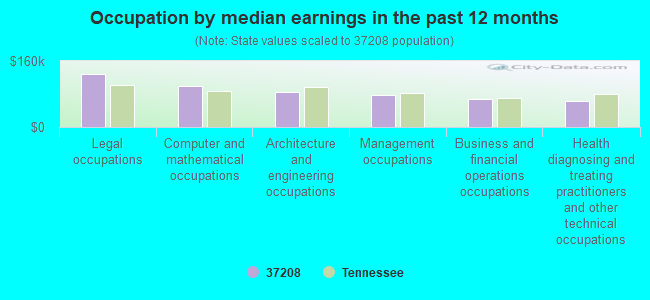
Occupation by median earnings in the past 12 months ($)
129,060Legal occupations
98,373Computer and mathematical occupations
84,423Architecture and engineering occupations
77,607Management occupations
67,396Business and financial operations occupations
62,207Health diagnosing and treating practitioners and other technical occupations
Companies with federal contracts located in this zip code (NASHVILLE, TN):
MEHARRY MEDICAL COLLEGE (1005 DR. D.B TODD. BLVD) : $4,326,306 in 72 contractsfrom 1999 to 2006
Contracts for Tuition, Registration, and Membership Fees, Other Medical Services, Other Professional Services, Educational Services, and moreby Navy, Army, Department of Veterans Affairs, Health Resources and Services Administration, and others Signed by year:2000: $578,216; 2001: $1,171,564; 2002: $517,407; 2003: $441,556; 2004: $210,396; 2005: $820,243; 2006: $246,375.
Biggest contracts:
$207,225 with Navy for Tuition, Registration, and Membership Fees. Signed on 2000-07-25. Completion date: 2000-08-14.
$205,176, same as above.Signed on 2001-04-28. Completion date: 2001-07-03.
$196,344 with Army for Tuition, Registration, and Membership Fees. Signed on 2001-09-25. Completion date: 2001-09-30.
$186,704 with Navy for Tuition, Registration, and Membership Fees. Signed on 2002-06-27. Completion date: 2003-06-25.
GOODWILL INDUSTRIES OF MIDDLE (1015 HERMAN STREET) : $1,256,913 in 4 contractsfrom 1999 to 2002
$589,004 with U.S. Army Corps of Engineers - civil program financing only for Personal Care Services (includes such services as barber and beauty shop, shoe repairs, tailoring, etc.). Signed on 2001-10-31. Completion date: 2002-09-30.
$321,384 with U.S. Army Corps of Engineers - civil program financing only for Facilities Operations Support Services. Signed on 2002-10-31. Completion date: 2003-10-31.
$304,495 with U.S. Army Corps of Engineers - civil program financing only for Mailing and Distribution Services. Signed on 1999-10-27. Completion date: 2000-10-31.
$42,030 with U.S. Army Corps of Engineers - civil program financing only for Organization/Administrative/PersonneI Studies. Signed on 2002-12-19. Completion date: 2003-12-31.
GOODWILL GOVERNMENT SERVICES I (1015 HERMAN ST) : $1,220,965 in 13 contractsfrom 2003 to 2005
Contracts for Facilities Operations Support Services by Army, U.S. Army Corps of Engineers - civil program financing only Signed by year:2000: $0; 2001: $0; 2002: $0; 2003: $107,165; 2004: $780,254; 2005: $333,546; 2006: $0.
Biggest contracts:
$288,519 with Army for Facilities Operations Support Services. Signed on 2005-11-01. Completion date: 2006-12-31.
$288,519 with U.S. Army Corps of Engineers - civil program financing only for Facilities Operations Support Services. Signed on 2004-12-28. Completion date: 2005-10-31.
$288,519 with Army for Facilities Operations Support Services. Signed on 2004-12-28. Completion date: 2005-10-31.
$57,704 with U.S. Army Corps of Engineers - civil program financing only for Facilities Operations Support Services. Signed on 2004-10-27. Completion date: 2003-10-30.
ANGELO M FORMOSA FOODS INC (1300 4TH AVE N; small business) : $490,154 in 91 contractsfrom 2004 to 2006
Contracts for Fruits and Vegetables by Defense Logistics Agency Signed by year:2000: $0; 2001: $0; 2002: $0; 2003: $0; 2004: $15,314; 2005: $286,723; 2006: $188,117.
Biggest contracts:
$13,265 with Defense Logistics Agency for Fruits and Vegetables. Signed on 2005-09-04. Completion date: 2005-09-04.
$11,403, same as above.Signed on 2006-04-03. Completion date: 2006-04-03.
$10,628, same as above.Signed on 2005-08-19. Completion date: 2005-08-19.
$10,545, same as above.Signed on 2006-02-21. Completion date: 2006-02-21.
CENTERSTONE COMMUNITY MENTAL H (1101 6TH AVENUE NORTH; small business) : $174,036 in 4 contractsfrom 2002 to 2003
$59,736 with Army for Medical/Psychiatric Consultation Services. Taking place in KY. Signed on 2003-10-25. Completion date: 2002-09-30.
$57,996, same as above.Signed on 2002-11-21. Completion date: 2002-09-30.
$56,304, same as above.Signed on 2002-03-04. Completion date: 2002-09-30.
$0, same as above.Signed on 2002-03-04. Completion date: 2002-09-30.
METRO READY MIX CONCRETE, INC (1136 2ND AVE N) : $68,410 in 12 contractsfrom 2002 to 2005
Contracts for Mineral Construction Materials, Bulk by Army, U.S. Army Corps of Engineers - civil program financing only Signed by year:2000: $0; 2001: $0; 2002: $8,550; 2003: $0; 2004: $17,860; 2005: $42,000; 2006: $0.
Biggest contracts:
$17,000 with Army for Mineral Construction Materials, Bulk. Signed on 2005-08-12. Completion date: 2005-09-23.
$17,000 with U.S. Army Corps of Engineers - civil program financing only for Mineral Construction Materials, Bulk. Signed on 2005-08-12. Completion date: 2005-09-23.
$8,550, same as above.Signed on 2002-09-12. Completion date: 2002-09-30.
$4,464 with Army for Mineral Construction Materials, Bulk. Signed on 2004-06-03. Completion date: 2004-05-24.
TN BOOKS DIRECT LLC (1212 7TH AVE N; small business)
$38,858 with Army for Books and Pamphlets. Taking place in VA. Signed on 2005-08-24. Completion date: 2005-10-30.
COMMODORE MEDICAL SERVICES OF (1941 CEMENT PLANT RD) : $21,901 in 2 contractsfrom 2005 to 2006
$20,701 with Air Force for Trash/Garbage Collection Services - Including Portable Sanitation Services. Taking place in FL. Signed on 2006-01-04. Completion date: 2007-01-31.
$1,200 with Bureau of Prisoners/Federal Prison System for Biomedical -- Basic Research (R&D). Taking place in OH. Signed on 2005-10-01. Completion date: 2006-09-30.
NASHVILLE METAL PREP INC (100 TAYLOR ST; small business)
$3,875 with Army for Miscellaneous Maintenance and Repair Shop Specialized Equipment. Signed on 2005-06-09. Completion date: 2005-06-16.
NASHVILLE TENT & AWNING CO (1301 HERMAN ST; small business)
$3,756 with Army for Tents and Tarpaulins. Signed on 2004-09-28. Completion date: 2004-09-15.
Top industries in this zip code by the number of employees in 2005:
Educational Services: Colleges, Universities, and Professional Schools (500-999 employees: 1 establishment, 250-499 employees: 1 establishment, 1-4 employees: 1 establishment)
Health Care and Social Assistance: General Medical and Surgical Hospitals (500-999: 1)
Construction: Masonry Contractors (250-499: 1)
Other Services (except Public Administration): Religious Organizations (50-99: 1, 20-49: 1, 10-19: 3, 5-9: 11, 1-4: 14)
Construction: Highway, Street, and Bridge Construction (100-249: 1, 20-49: 1)
2003 - 2018 National Fire Incident Reporting System (NFIRS) incidents
Based on the data from the years 2003 - 2018 the average number of fires per year is 103. The highest number of reported fires - 159 took place in 2006, and the least - 55 in 2004. The data has an increasing trend.
When looking into fire subcategories, the most incidents belonged to: Outside Fires (50.6%), and Structure Fires (26.1%).
Fire incident types reported to NFIRS in Zip Code 37208

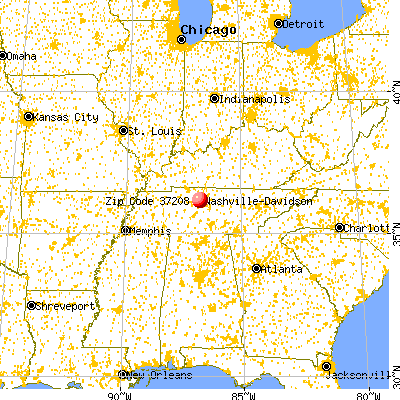


 Nearest zip codes: 37228, 37246, 37219, 37243, 37201, 37240.


 Based on the data from the years 2003 - 2018 the average number of fires per year is 103. The highest number of reported fires - 159 took place in 2006, and the least - 55 in 2004. The data has an increasing trend.
 When looking into fire subcategories, the most incidents belonged to: Outside Fires (50.6%), and Structure Fires (26.1%).