Estimated zip code population in 2022: 9,307 Zip code population in 2010: 8,567 Zip code population in 2000: 7,090
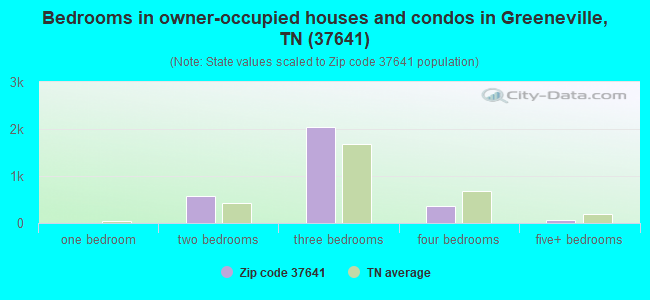
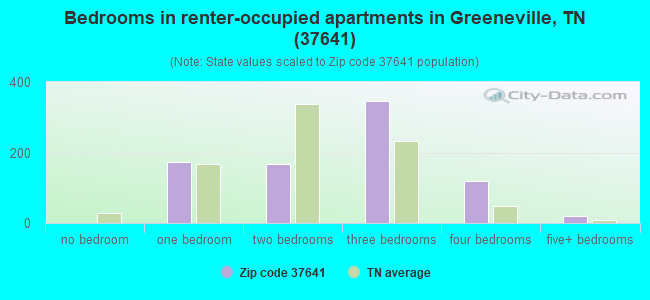
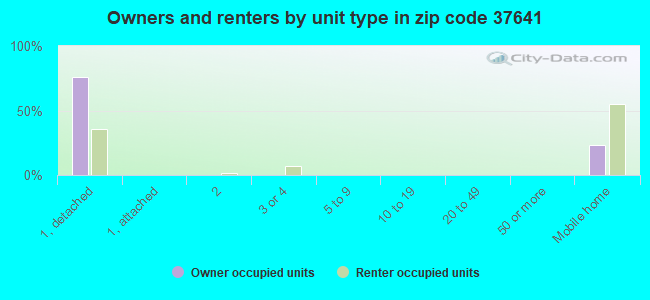
Houses and condos: 4,407 Renter-occupied apartments: 828
% of renters here:
21%
State:
33%
March 2022 cost of living index in zip code 37641: 78.8 (low, U.S. average is 100)
Land area: 91.4 sq. mi. Water area: 0.1 sq. mi.
Population density: 102 people per square mile
(very low).
OSM Map
General Map
Google Map
MSN Map
OSM Map
General Map
Google Map
MSN Map
OSM Map
General Map
Google Map
MSN Map
OSM Map
General Map
Google Map
MSN Map
Please wait while loading the map...
Real estate property taxes paid for housing units in 2022:
This zip code:
0.4% ($826)
Tennessee:
0.5% ($1,376)
Median real estate property taxes paid for housing units with mortgages in 2022: $884 (0.3%) Median real estate property taxes paid for housing units with no mortgage in 2022: $770 (0.4%)
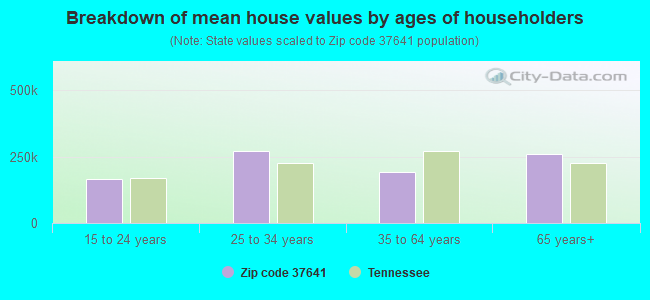
Estimated median house/condo value in 2022: $202,710
37641:
$202,710
Tennessee:
$284,800
According to our research of Tennessee and other state lists, there were 16 registered sex offenders living in 37641 zip code as of April 27, 2024. The ratio of all residents to sex offenders in zip code 37641 is 607 to 1. The ratio of registered sex offenders to all residents in this zip code is lower than the state average.
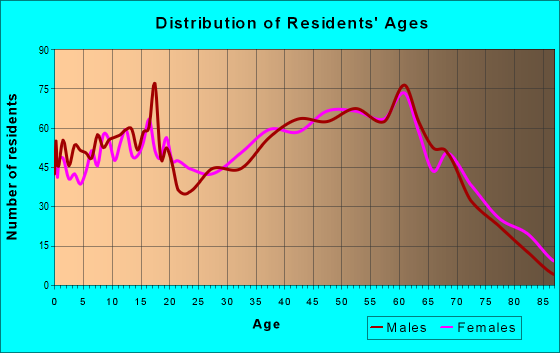
Median resident age:
This zip code:
45.4 years
Tennessee median age:
39.2 years
Average household size:
This zip code:
2.4 people
Tennessee:
2.4 people
Averages for the 2020 tax year for zip code 37641, filed in 2021:
Average Adjusted Gross Income (AGI) in 2020: $49,061 (Individual Income Tax Returns)
Here:
$49,061
State:
$69,014
Salary/wage: $43,798 (reported on 80.2% of returns)
Here:
$43,798
State:
$55,872
(% of AGI for various income ranges: 1097.9% for AGIs below $25k, 3384.6% for AGIs $25k-50k, 5894.2% for AGIs $50k-75k, 8178.9% for AGIs $75k-100k, 13288.8% for AGIs $100k-200k)
Taxable interest for individuals: $1,178 (reported on 37.1% of returns)
This zip code:
$1,178
Tennessee:
$1,945
(% of AGI for various income ranges: 20.9% for AGIs below $25k, 20.0% for AGIs $25k-50k, 28.5% for AGIs $50k-75k, 140.7% for AGIs $75k-100k, 196.5% for AGIs $100k-200k)
Ordinary dividends: $2,826 (reported on 10.6% of returns)
Here:
$2,826
State:
$8,105
(% of AGI for various income ranges: 14.8% for AGIs below $25k, 16.0% for AGIs $25k-50k, 34.6% for AGIs $50k-75k, 88.9% for AGIs $75k-100k, 109.6% for AGIs $100k-200k)
Net capital gain/loss in AGI: +$9,304 (reported on 11.6% of returns)
Here:
+$9,304
State:
+$33,664
(% of AGI for various income ranges: 16.5% for AGIs below $25k, 12.3% for AGIs $25k-50k, 60.2% for AGIs $50k-75k, 141.5% for AGIs $75k-100k, 586.2% for AGIs $100k-200k)
Profit/loss from business: +$11,492 (reported on 15.6% of returns)
Here:
+$11,492
State:
+$18,991
(% of AGI for various income ranges: 127.1% for AGIs below $25k, 145.7% for AGIs $25k-50k, 162.1% for AGIs $50k-75k, 251.5% for AGIs $75k-100k, 386.2% for AGIs $100k-200k)
Taxable individual retirement arrangement distribution: $19,345 (reported on 7.7% of returns)
37641:
$19,345
Tennessee:
$20,036
(% of AGI for various income ranges: 46.4% for AGIs below $25k, 72.4% for AGIs $25k-50k, 196.0% for AGIs $50k-75k, 401.5% for AGIs $75k-100k, 1062.7% for AGIs $100k-200k)
Total itemized deductions: $33,822 (reported on 2.2% of returns)
Here:
$33,822
State:
$40,136
(% of AGI for various income ranges: 229.6% for AGIs $50k-75k, 746.9% for AGIs $100k-200k)
Charity contributions: $14,957 (reported on 1.7% of returns)
Here:
$14,957
State:
$19,852
(% of AGI for various income ranges: 61.9% for AGIs $50k-75k, 288.5% for AGIs $100k-200k)
Taxes paid: $5,212 (reported on 2.0% of returns)
37641:
$5,212
State:
$6,038
(% of AGI for various income ranges: 29.4% for AGIs $50k-75k, 106.2% for AGIs $100k-200k)
Earned income credit: $2,130 (reported on 19.8% of returns)
Here:
$2,130
State:
$2,391
(% of AGI for various income ranges: 91.5% for AGIs below $25k, 68.8% for AGIs $25k-50k)
Percentage of individuals using paid preparers for their 2020 taxes: 95.0%
Here:
95%
State:
93%
(% for various income ranges: 94.7% for AGIs below $25k, 97.2% for AGIs $25k-50k, 95.1% for AGIs $50k-75k, 94.6% for AGIs $75k-100k, 92.1% for AGIs $100k-200k, 85.7% for AGIs over 200k)
Averages for the 2012 tax year for zip code 37641, filed in 2013:
Average Adjusted Gross Income (AGI) in 2012: $37,327 (Individual Income Tax Returns)
Here:
$37,327
State:
$53,767
Salary/wage: $33,768 (reported on 84.3% of returns)
Here:
$33,768
State:
$45,421
(% of AGI for various income ranges: 75.4% for AGIs below $25k, 82.1% for AGIs $25k-50k, 81.2% for AGIs $50k-75k, 75.2% for AGIs $75k-100k, 92.9% for AGIs $100k-200k)
Taxable interest for individuals: $1,049 (reported on 31.1% of returns)
This zip code:
$1,049
Tennessee:
$1,732
(% of AGI for various income ranges: 1.6% for AGIs below $25k, 0.5% for AGIs $25k-50k, 0.8% for AGIs $50k-75k, 0.5% for AGIs $75k-100k, 1.1% for AGIs $100k-200k, 0.7% for AGIs over 200k)
Ordinary dividends: $2,418 (reported on 9.5% of returns)
Here:
$2,418
State:
$6,739
(% of AGI for various income ranges: 0.9% for AGIs below $25k, 0.4% for AGIs $25k-50k, 0.4% for AGIs $50k-75k, 0.6% for AGIs $75k-100k, 1.1% for AGIs $100k-200k)
Net capital gain/loss in AGI: +$4,649 (reported on 10.9% of returns)
Here:
+$4,649
State:
+$19,082
(% of AGI for various income ranges: 0.1% for AGIs below $25k, 0.2% for AGIs $25k-50k, 0.9% for AGIs $50k-75k, 0.6% for AGIs $75k-100k, 6.9% for AGIs $100k-200k)
Profit/loss from business: +$8,175 (reported on 15.7% of returns)
Here:
+$8,175
State:
+$15,240
(% of AGI for various income ranges: 8.9% for AGIs below $25k, 2.3% for AGIs $25k-50k, 2.8% for AGIs $50k-75k, 2.2% for AGIs $75k-100k, 2.7% for AGIs $100k-200k)
Taxable individual retirement arrangement distribution: $12,552 (reported on 7.0% of returns)
37641:
$12,552
Tennessee:
$15,505
(% of AGI for various income ranges: 2.2% for AGIs below $25k, 1.7% for AGIs $25k-50k, 2.1% for AGIs $50k-75k, 2.6% for AGIs $75k-100k, 4.9% for AGIs $100k-200k)
Total itemized deductions: $19,016 (25% of AGI, reported on 14.0% of returns)
Here:
$19,016
State:
$21,976
Here:
24.9% of AGI
State:
17.8% of AGI
(% of AGI for various income ranges: 4.2% for AGIs below $25k, 4.8% for AGIs $25k-50k, 7.3% for AGIs $50k-75k, 9.2% for AGIs $75k-100k, 15.4% for AGIs $100k-200k)
Charity contributions: $4,853 (reported on 10.6% of returns)
Here:
$4,853
State:
$6,709
(% of AGI for various income ranges: 0.4% for AGIs below $25k, 0.7% for AGIs $25k-50k, 1.5% for AGIs $50k-75k, 1.7% for AGIs $75k-100k, 3.9% for AGIs $100k-200k)
Taxes paid: $3,238 (reported on 14.0% of returns)
37641:
$3,238
State:
$4,829
(% of AGI for various income ranges: 0.6% for AGIs below $25k, 0.7% for AGIs $25k-50k, 1.2% for AGIs $50k-75k, 1.5% for AGIs $75k-100k, 3.0% for AGIs $100k-200k)
Earned income credit: $2,306 (reported on 27.2% of returns)
Here:
$2,306
State:
$2,404
(% of AGI for various income ranges: 7.8% for AGIs below $25k, 1.5% for AGIs $25k-50k)
Percentage of individuals using paid preparers for their 2012 taxes: 60.5%
Here:
61%
State:
52%
(% for various income ranges: 57.2% for AGIs below $25k, 61.1% for AGIs $25k-50k, 63.3% for AGIs $50k-75k, 69.6% for AGIs $75k-100k, 80.0% for AGIs $100k-200k)
Averages for the 2004 tax year for zip code 37641, filed in 2005:
Average Adjusted Gross Income (AGI) in 2004: $30,373 (Individual Income Tax Returns)
Here:
$30,373
State:
$44,088
Salary/wage: $28,898 (reported on 87.6% of returns)
Here:
$28,898
State:
$38,825
(% of AGI for various income ranges: 94.7% for AGIs below $10k, 81.5% for AGIs $10k-25k, 87.4% for AGIs $25k-50k, 87.5% for AGIs $50k-75k, 85.9% for AGIs $75k-100k, 57.0% for AGIs over 100k)
Taxable interest for individuals: $1,200 (reported on 34.6% of returns)
This zip code:
$1,200
Tennessee:
$1,802
(% of AGI for various income ranges: 4.9% for AGIs below $10k, 2.0% for AGIs $10k-25k, 1.0% for AGIs $25k-50k, 1.4% for AGIs $50k-75k, 0.4% for AGIs $75k-100k, 1.2% for AGIs over 100k)
Taxable dividends: $1,569 (reported on 11.1% of returns)
Here:
$1,569
State:
$3,727
(% of AGI for various income ranges: 1.2% for AGIs below $10k, 0.4% for AGIs $10k-25k, 0.2% for AGIs $25k-50k, 0.3% for AGIs $50k-75k, 0.3% for AGIs $75k-100k, 2.8% for AGIs over 100k)
Net capital gain/loss: +$3,847 (reported on 8.9% of returns)
Here:
+$3,847
State:
+$15,776
(% of AGI for various income ranges: 0.1% for AGIs below $10k, 0.6% for AGIs $10k-25k, 0.5% for AGIs $25k-50k, 1.0% for AGIs $50k-75k, 0.6% for AGIs $75k-100k, 5.2% for AGIs over 100k)
Profit/loss from business: +$7,101 (reported on 16.0% of returns)
Here:
+$7,101
State:
+$12,882
(% of AGI for various income ranges: 5.4% for AGIs below $10k, 3.2% for AGIs $10k-25k, 3.6% for AGIs $25k-50k, 2.0% for AGIs $50k-75k, 1.2% for AGIs $75k-100k, 11.6% for AGIs over 100k)
IRA payment deduction: $2,646 (reported on 1.4% of returns)
37641:
$2,646
Tennessee:
$2,934
Total itemized deductions: $15,081 (26% of AGI, reported on 12.9% of returns)
Here:
$15,081
State:
$18,035
Here:
25.6% of AGI
State:
19.9% of AGI
(% of AGI for various income ranges: 6.2% for AGIs below $10k, 2.8% for AGIs $10k-25k, 5.4% for AGIs $25k-50k, 6.6% for AGIs $50k-75k, 11.7% for AGIs $75k-100k, 10.1% for AGIs over 100k)
Charity contributions deductions: $4,334 (7% of AGI, reported on 9.8% of returns)
Here:
$4,334
State:
$5,167
Here:
6.7% of AGI
State:
5.3% of AGI
(% of AGI for various income ranges: 0.5% for AGIs $10k-25k, 0.7% for AGIs $25k-50k, 1.1% for AGIs $50k-75k, 3.1% for AGIs $75k-100k, 4.6% for AGIs over 100k)
Total tax: $3,368 (reported on 69.9% of returns)
37641:
$3,368
State:
$7,482
(% of AGI for various income ranges: 3.1% for AGIs below $10k, 3.7% for AGIs $10k-25k, 6.3% for AGIs $25k-50k, 8.4% for AGIs $50k-75k, 10.1% for AGIs $75k-100k, 17.1% for AGIs over 100k)
Earned income credit: $1,625 (reported on 24.5% of returns)
Here:
$1,625
State:
$1,826
Percentage of individuals using paid preparers for their 2004 taxes: 65.6%
Here:
66%
State:
60%
(% for various income ranges: 61.1% for AGIs below $10k, 67.8% for AGIs $10k-25k, 64.7% for AGIs $25k-50k, 69.3% for AGIs $50k-75k, 60.3% for AGIs $75k-100k, 80.0% for AGIs over 100k)
Household received Food Stamps/SNAP in the past 12 months: 397 Household did not receive Food Stamps/SNAP in the past 12 months: 3,478
Women who had a birth in the past 12 months: 53 (26 now married, 26 unmarried) Women who did not have a birth in the past 12 months: 2,051 (987 now married, 1,063 unmarried)
Housing units in zip code 37641 with a mortgage: 1,487 (106 second mortgage, 108 both second mortgage and home equity loan) Houses without a mortgage: 57
Median monthly owner costs for units with a mortgage: $1,169 Median monthly owner costs for units without a mortgage: $342
Residents with income below the poverty level in 2022:
This zip code:
11.1%
Whole state:
13.3%
Residents with income below 50% of the poverty level in 2022:
This zip code:
6.1%
Whole state:
7.1%
Median number of rooms in houses and condos:
Here:
5.9
State:
6.5
Median number of rooms in apartments:
Here:
5.5
State:
4.4
Notable locations in this zip code not listed on our city pages
Notable locations in zip code 37641: Clear Creek Mill (A), Horse Creek Picnic Area (B), Twin Creek Golf Course (C), Horse Creek Campground (D), Newmansville Volunteer Fire Department (E), Nolichuckey Valley Volunteer Fire Department (F). Display/hide their locations on the map
Churches in zip code 37641 include: Quaker Knobs Church (A), Stone Dam Church (B), Jearoldstown United Methodist Church (C), Pleasant Hill United Methodist Church (D), Bethany Church (E), Cassi Church (F), Union Temple Church (G), Liberty Freewill Baptist Church (H), Pleasant Hill Church (I). Display/hide their locations on the map
Cemeteries: Pleasant Vale Cumberland Presbyterian Cemetery (1), Fox Cemetery (2), Seaton Cemetery (3), Painter Cemetery (4), Liberty Cemetery (5), Arrington Cemetery (6). Display/hide their locations on the map
Streams, rivers, and creeks: Little Sinking Creek (A), Big Limestone Creek (B), Squibb Creek (C), Alexander Branch (D), Jilton Branch (E), Broad Branch (F), Cannon Branch (G), Flatrock Branch (H), Fort Davie Creek (I). Display/hide their locations on the map
In group quarters: 80 (-1 institutionalized population)
Size of family households: 1,040 2-persons, 840 3-persons, 378 4-persons, 183 5-persons, 71 6-persons, 5 7-or-more-persons
Size of nonfamily households: 1,112 1-person, 201 2-persons, 40 3-persons
1,175 married couples with children.
396 single-parent households (100 men, 296 women).
99.0% of residents of 37641 zip code speak English at home.
0.6% of residents speak Spanish at home (100% very well).
0.3% of residents speak other Indo-European language at home (100% very well).
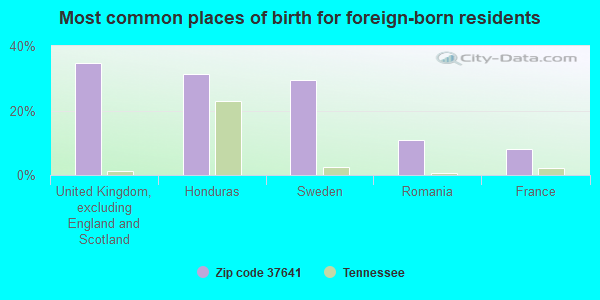
Foreign born population: 112 (1.2%) (52.4% of them are naturalized citizens)
This zip code:
1.2%
Whole state:
5.6%
35%United Kingdom, excluding England and Scotland
31%Honduras
29%Sweden
11%Romania
8%France
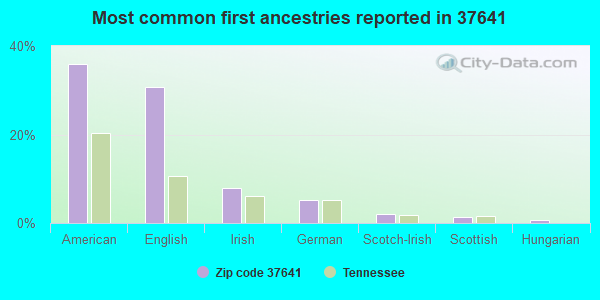
36%American
31%English
8%Irish
5%German
2%Scotch-Irish
1%Scottish
1%Hungarian
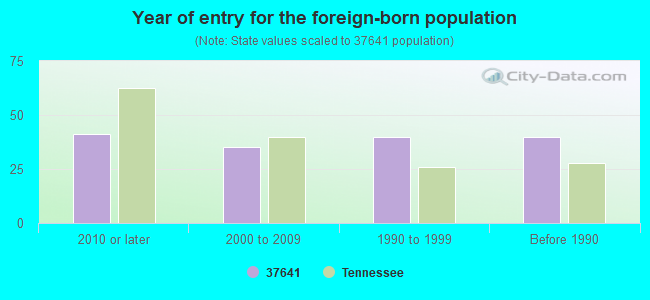
Year of entry for the foreign-born population
412010 or later
352000 to 2009
401990 to 1999
40Before 1990
Facilities with environmental interests located in this zip code:
CHUCKEY ELEMENTARY SCHOOL (1605 CHUCKEY HW in CHUCKEY, TN)
(National Center for Education Statistics) - STATE ID-0020 Organizations: GREENE COUNTY SCHOOL DISTRICT (SCHOOL DISTRICT)
CHUCKEY ELEM (1605 CHUCKEY HWY in CHUCKEY, TN)
National Pollutant Discharge Elimination System NON-MAJOR (Tracking pollutant discharge elimination systems) - permit Business SIC classification: SEWERAGE SYSTEMS Organizations: CHUCKEY ELEMENTARY SCHOOL (CONTACT/OPERATOR)
, GREENE CO. BOARD OF EDUCATION (CONTACT/OWNER)
Alternative names: GREENE CO-CHUCKEY ES, GREENE COUNTY BOARD OF EDUCAT.
BAILEY MANUFACTURING CO (MAPLE SWAMP & LIBERY in CHUCKEY, TN)
(Resource Conservation and Recovery Act (tracking hazardous waste)) Business NAICS classification: SAWMILLS.
(Resource Conservation and Recovery Act (tracking hazardous waste)) Business NAICS classification: OTHER COMMERCIAL AND SERVICE INDUSTRY MACHINERY MANUFACTURING.
Housing units lacking complete plumbing facilities: 3.8% Housing units lacking complete kitchen facilities: 5.3%
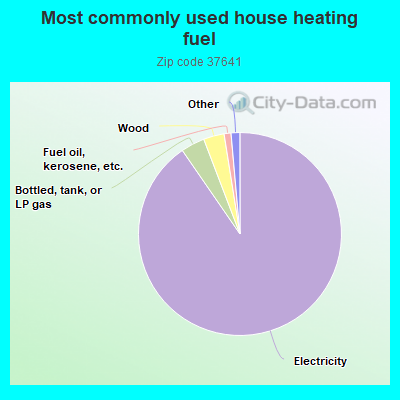
90.4%Electricity
3.8%Bottled, tank, or LP gas
3.3%Wood
1.1%Fuel oil, kerosene, etc.
0.9%Utility gas
0.5%No fuel used
Population in 1990: 6,362. Population change in the 1990s: +728 (+11.4%).
Place of birth for U.S.-born residents:
This state: 6,412
Northeast: 342
Midwest: 775
South: 1,344
West: 208
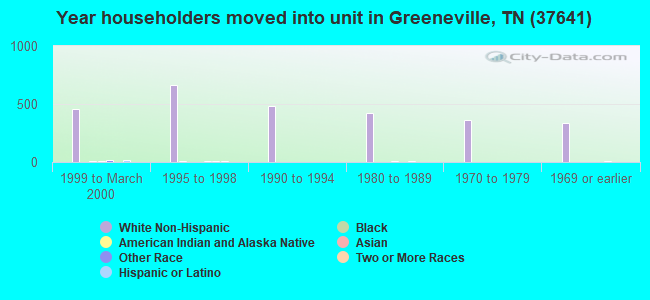
63% of the 37641 zip code residents lived in the same house 5 years ago. Out of people who lived in different houses, 55% lived in this county. Out of people who lived in different counties, 50% lived in Tennessee.
93% of the 37641 zip code residents lived in the same house 1 year ago. Out of people who lived in different houses, 49% moved from this county. Out of people who lived in different houses, 32% moved from different county within same state. Out of people who lived in different houses, 22% moved from different state.
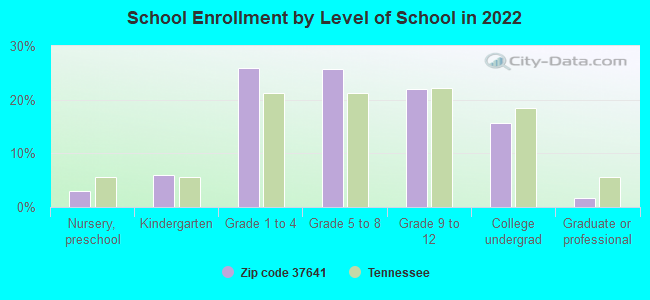
Private vs. public school enrollment:
Students in private schools in grades 1 to 8 (elementary and middle school): 9
Here:
1.1%
Tennessee:
15.0%
Students in private schools in grades 9 to 12 (high school): 90
Here:
24.5%
Tennessee:
16.2%
Students in private undergraduate colleges:
Here:
0.3%
Tennessee:
23.5%
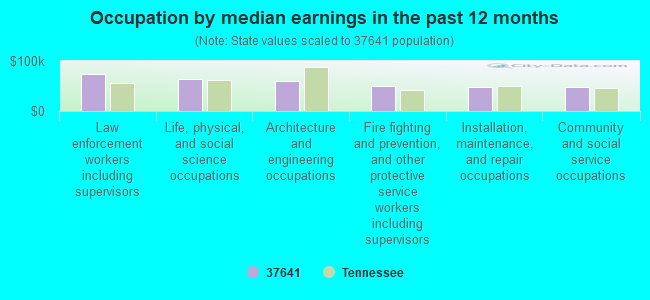
Occupation by median earnings in the past 12 months ($)
73,319Law enforcement workers including supervisors
64,630Life, physical, and social science occupations
59,720Architecture and engineering occupations
49,382Fire fighting and prevention, and other protective service workers including supervisors
48,301Installation, maintenance, and repair occupations
47,859Community and social service occupations
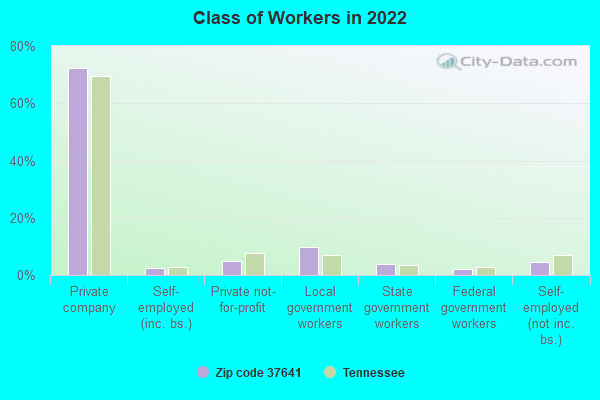
Companies with federal contracts located in this zip code:
FULLER CONTROLS INC (375 HIDDEN MEADOWS LN in CHUCKEY, TN; small business) : $171,283 in 10 contractsfrom 2000 to 2006
Contracts for Other Education and Training Services, Generators and Generators Sets, Electrical, Relays and Solenoids, Valves, Nonpowered, and moreby U.S. Army Corps of Engineers - civil program financing only, Army, Bureau of Reclamation Signed by year:2000: $40,701; 2001: $27,301; 2002: $15,648; 2003: -$546; 2004: $75,052; 2005: $0; 2006: $13,127.
Biggest contracts:
$40,701 with U.S. Army Corps of Engineers - civil program financing only for Other Education and Training Services. Taking place in AR. Signed on 2000-02-17. Completion date: 2000-05-31.
$34,964 with Army for Generators and Generators Sets, Electrical. Taking place in WA. Signed on 2004-02-11. Completion date: 2004-05-14.
$34,964 with U.S. Army Corps of Engineers - civil program financing only for Generators and Generators Sets, Electrical. Taking place in WA. Signed on 2004-02-11. Completion date: 2004-05-14.
$27,301 with U.S. Army Corps of Engineers - civil program financing only for Relays and Solenoids. Taking place in WA. Signed on 2001-08-06. Completion date: 2001-11-30.
Top industries in this zip code by the number of employees in 2005:
Health Care and Social Assistance: Nursing Care Facilities (50-99 employees: 1 establishment, 1-4 employees: 1 establishment)
Other Services (except Public Administration): Car Washes (20-49: 1)
Arts, Entertainment, and Recreation: Golf Courses and Country Clubs (10-19: 1, 5-9: 1)
Professional, Scientific, and Technical Services: Industrial Design Services (10-19: 1)
People in group quarters in 2010:
73 people in nursing facilities/skilled-nursing facilities
People in group quarters in 2000:
102 people in nursing homes
13 people in homes or halfway houses for drug/alcohol abuse
Fatal accident statistics in 2013:
Fatal accident count: 1
Vehicles involved in fatal accidents: 2
Fatal accidents caused by drunken drivers: 0
Fatalities: 2
Persons involved in fatal accidents: 3
Pedestrians involved in fatal accidents: 0
Fatal accident statistics in 2012:
Fatal accident count: 3
Vehicles involved in fatal accidents: 4
Fatal accidents caused by drunken drivers: 1
Fatalities: 3
Persons involved in fatal accidents: 10
Pedestrians involved in fatal accidents: 0
Home Mortgage Disclosure Act Aggregated Statistics For Year 2009 (Based on 2 partial tracts)
A) FHA, FSA/RHS & VA Home Purchase Loans
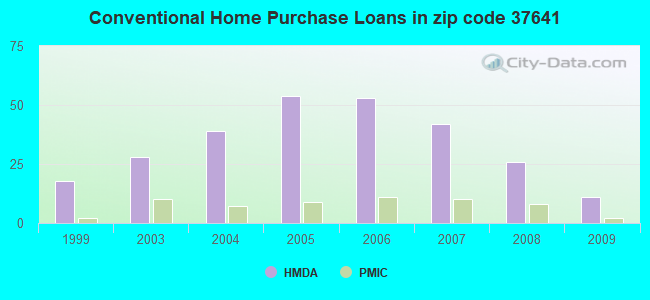
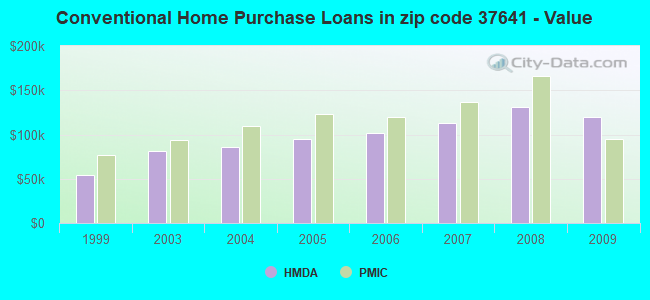
B) Conventional Home Purchase Loans
C) Refinancings
D) Home Improvement Loans
F) Non-occupant Loans on < 5 Family Dwellings (A B C & D)
G) Loans On Manufactured Home Dwelling (A B C & D)
Number
Average Value
Number
Average Value
Number
Average Value
Number
Average Value
Number
Average Value
Number
Average Value
LOANS ORIGINATED
14
$123,122
11
$119,324
48
$115,828
3
$37,873
3
$95,807
10
$66,380
APPLICATIONS APPROVED, NOT ACCEPTED
2
$156,805
1
$78,340
4
$119,908
1
$34,240
0
$0
2
$45,005
APPLICATIONS DENIED
2
$97,015
3
$97,967
22
$116,482
4
$36,445
1
$96,500
6
$64,418
APPLICATIONS WITHDRAWN
2
$104,540
3
$177,950
10
$110,427
1
$22,570
0
$0
1
$73,150
FILES CLOSED FOR INCOMPLETENESS
1
$87,420
0
$0
2
$128,145
1
$85,600
0
$0
0
$0
Aggregated Statistics For Year 2008 (Based on 2 partial tracts)
A) FHA, FSA/RHS & VA Home Purchase Loans
B) Conventional Home Purchase Loans
C) Refinancings
D) Home Improvement Loans
F) Non-occupant Loans on < 5 Family Dwellings (A B C & D)
G) Loans On Manufactured Home Dwelling (A B C & D)
Number
Average Value
Number
Average Value
Number
Average Value
Number
Average Value
Number
Average Value
Number
Average Value
LOANS ORIGINATED
11
$126,469
26
$130,548
43
$107,971
4
$50,972
8
$124,285
15
$63,778
APPLICATIONS APPROVED, NOT ACCEPTED
1
$40,730
1
$105,840
6
$79,247
0
$0
0
$0
2
$61,995
APPLICATIONS DENIED
2
$119,195
7
$98,683
28
$105,826
5
$64,954
1
$62,520
8
$75,842
APPLICATIONS WITHDRAWN
1
$109,730
4
$137,222
11
$113,641
1
$45,400
0
$0
2
$77,430
FILES CLOSED FOR INCOMPLETENESS
0
$0
0
$0
2
$82,880
1
$47,210
0
$0
1
$30,090
Aggregated Statistics For Year 2007 (Based on 2 partial tracts)
A) FHA, FSA/RHS & VA Home Purchase Loans
B) Conventional Home Purchase Loans
C) Refinancings
D) Home Improvement Loans
F) Non-occupant Loans on < 5 Family Dwellings (A B C & D)
G) Loans On Manufactured Home Dwelling (A B C & D)
Number
Average Value
Number
Average Value
Number
Average Value
Number
Average Value
Number
Average Value
Number
Average Value
LOANS ORIGINATED
6
$123,820
42
$113,290
40
$102,768
9
$33,952
8
$103,436
18
$63,020
APPLICATIONS APPROVED, NOT ACCEPTED
0
$0
6
$93,643
11
$114,796
1
$56,030
1
$76,520
4
$63,488
APPLICATIONS DENIED
3
$111,713
12
$88,520
33
$111,000
8
$56,776
3
$89,493
16
$66,941
APPLICATIONS WITHDRAWN
0
$0
4
$127,300
13
$128,782
1
$127,620
0
$0
2
$63,035
FILES CLOSED FOR INCOMPLETENESS
1
$117,250
1
$74,190
3
$217,377
0
$0
0
$0
2
$101,165
Aggregated Statistics For Year 2006 (Based on 2 partial tracts)
A) FHA, FSA/RHS & VA Home Purchase Loans
B) Conventional Home Purchase Loans
C) Refinancings
D) Home Improvement Loans
F) Non-occupant Loans on < 5 Family Dwellings (A B C & D)
G) Loans On Manufactured Home Dwelling (A B C & D)
Number
Average Value
Number
Average Value
Number
Average Value
Number
Average Value
Number
Average Value
Number
Average Value
LOANS ORIGINATED
5
$93,696
53
$102,174
38
$97,316
10
$30,142
9
$86,698
18
$54,892
APPLICATIONS APPROVED, NOT ACCEPTED
1
$60,180
9
$90,703
11
$90,365
1
$27,760
2
$71,725
5
$59,196
APPLICATIONS DENIED
1
$142,930
20
$73,618
34
$89,462
11
$38,179
7
$66,036
20
$60,609
APPLICATIONS WITHDRAWN
1
$44,880
6
$80,630
19
$122,915
3
$45,050
2
$60,050
4
$46,562
FILES CLOSED FOR INCOMPLETENESS
0
$0
2
$98,570
6
$125,938
0
$0
0
$0
0
$0
Aggregated Statistics For Year 2005 (Based on 2 partial tracts)
A) FHA, FSA/RHS & VA Home Purchase Loans
B) Conventional Home Purchase Loans
C) Refinancings
D) Home Improvement Loans
F) Non-occupant Loans on < 5 Family Dwellings (A B C & D)
G) Loans On Manufactured Home Dwelling (A B C & D)
Number
Average Value
Number
Average Value
Number
Average Value
Number
Average Value
Number
Average Value
Number
Average Value
LOANS ORIGINATED
5
$117,300
54
$94,830
43
$89,366
8
$36,900
6
$126,415
16
$55,560
APPLICATIONS APPROVED, NOT ACCEPTED
0
$0
9
$87,216
9
$75,486
1
$71,080
0
$0
4
$70,232
APPLICATIONS DENIED
1
$79,900
21
$73,880
39
$91,608
8
$34,209
2
$78,340
24
$61,835
APPLICATIONS WITHDRAWN
1
$57,330
6
$92,520
25
$89,078
1
$187,810
1
$52,920
7
$70,706
FILES CLOSED FOR INCOMPLETENESS
0
$0
2
$61,735
3
$84,650
0
$0
0
$0
1
$33,720
Aggregated Statistics For Year 2004 (Based on 2 partial tracts)
A) FHA, FSA/RHS & VA Home Purchase Loans
B) Conventional Home Purchase Loans
C) Refinancings
D) Home Improvement Loans
F) Non-occupant Loans on < 5 Family Dwellings (A B C & D)
G) Loans On Manufactured Home Dwelling (A B C & D)
Number
Average Value
Number
Average Value
Number
Average Value
Number
Average Value
Number
Average Value
Number
Average Value
LOANS ORIGINATED
5
$103,138
39
$85,356
48
$73,383
9
$30,782
5
$50,634
23
$54,654
APPLICATIONS APPROVED, NOT ACCEPTED
0
$0
9
$75,111
14
$79,432
2
$15,045
1
$25,160
8
$57,814
APPLICATIONS DENIED
1
$73,150
23
$68,470
50
$80,985
9
$24,038
2
$38,390
33
$62,130
APPLICATIONS WITHDRAWN
1
$63,810
4
$110,700
23
$87,903
2
$20,750
0
$0
8
$71,595
FILES CLOSED FOR INCOMPLETENESS
0
$0
3
$88,973
4
$82,555
0
$0
0
$0
1
$51,360
Aggregated Statistics For Year 2003 (Based on 2 partial tracts)
A) FHA, FSA/RHS & VA Home Purchase Loans
B) Conventional Home Purchase Loans
C) Refinancings
D) Home Improvement Loans
F) Non-occupant Loans on < 5 Family Dwellings (A B C & D)
Number
Average Value
Number
Average Value
Number
Average Value
Number
Average Value
Number
Average Value
LOANS ORIGINATED
4
$87,352
28
$81,563
70
$77,038
8
$12,160
5
$51,102
APPLICATIONS APPROVED, NOT ACCEPTED
1
$62,000
6
$59,187
16
$90,644
1
$3,890
1
$54,990
APPLICATIONS DENIED
1
$150,710
26
$56,828
53
$78,456
6
$19,802
1
$77,040
APPLICATIONS WITHDRAWN
0
$0
3
$72,547
23
$85,004
1
$7,780
1
$18,680
FILES CLOSED FOR INCOMPLETENESS
0
$0
1
$87,420
2
$52,010
0
$0
0
$0
Aggregated Statistics For Year 1999 (Based on 1 partial tract)
A) FHA, FSA/RHS & VA Home Purchase Loans
B) Conventional Home Purchase Loans
C) Refinancings
D) Home Improvement Loans
F) Non-occupant Loans on < 5 Family Dwellings (A B C & D)
Detailed PMIC statistics for the following Tracts:0619.00
2002 - 2018 National Fire Incident Reporting System (NFIRS) incidents
According to the data from the years 2002 - 2018 the average number of fire incidents per year is 49. The highest number of fire incidents - 72 took place in 2006, and the least - 4 in 2002. The data has an increasing trend.
When looking into fire subcategories, the most reports belonged to: Outside Fires (42.8%), and Structure Fires (42.2%).
Fire incident types reported to NFIRS in Zip Code 37641
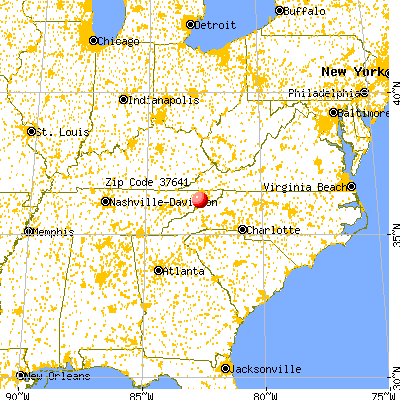


 Nearest zip codes: 37681, 37616, 37690, 37745, 37659, 37656.


 According to the data from the years 2002 - 2018 the average number of fire incidents per year is 49. The highest number of fire incidents - 72 took place in 2006, and the least - 4 in 2002. The data has an increasing trend.
 When looking into fire subcategories, the most reports belonged to: Outside Fires (42.8%), and Structure Fires (42.2%).