Estimated zip code population in 2022: 6,234 Zip code population in 2010: 6,121 Zip code population in 2000: 5,880
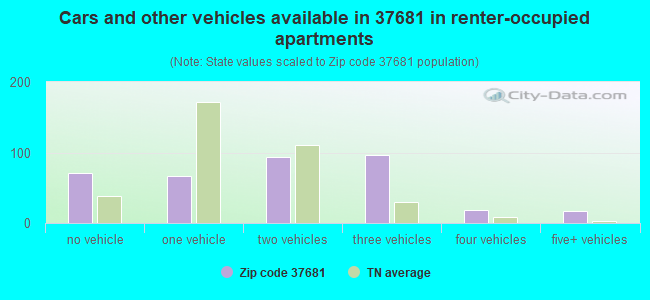
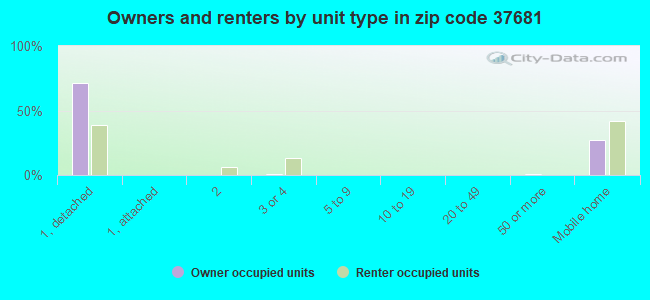
Houses and condos: 2,809 Renter-occupied apartments: 360
% of renters here:
14%
State:
33%
March 2022 cost of living index in zip code 37681: 79.9 (low, U.S. average is 100)
Land area: 67.2 sq. mi. Water area: 0.3 sq. mi.
Population density: 93 people per square mile
(very low).
OSM Map
General Map
Google Map
MSN Map
OSM Map
General Map
Google Map
MSN Map
OSM Map
General Map
Google Map
MSN Map
OSM Map
General Map
Google Map
MSN Map
Please wait while loading the map...
Real estate property taxes paid for housing units in 2022:
This zip code:
0.4% ($846)
Tennessee:
0.5% ($1,376)
Median real estate property taxes paid for housing units with mortgages in 2022: $866 (0.4%) Median real estate property taxes paid for housing units with no mortgage in 2022: $835 (0.4%)
Estimated median house/condo value in 2022: $200,378
37681:
$200,378
Tennessee:
$284,800
According to our research of Tennessee and other state lists, there were 10 registered sex offenders living in 37681 zip code as of April 27, 2024. The ratio of all residents to sex offenders in zip code 37681 is 589 to 1. The ratio of registered sex offenders to all residents in this zip code is lower than the state average.
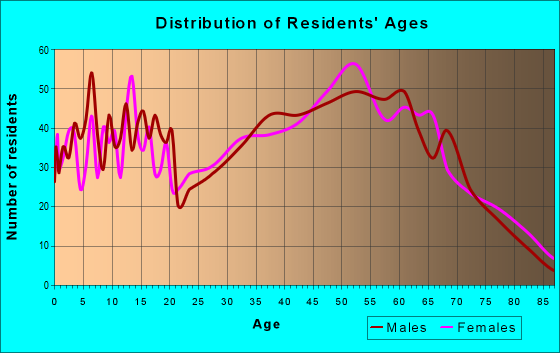
Median resident age:
This zip code:
48.3 years
Tennessee median age:
39.2 years
Average household size:
This zip code:
2.4 people
Tennessee:
2.4 people
Averages for the 2020 tax year for zip code 37681, filed in 2021:
Average Adjusted Gross Income (AGI) in 2020: $52,846 (Individual Income Tax Returns)
Here:
$52,846
State:
$69,014
Salary/wage: $45,690 (reported on 80.1% of returns)
Here:
$45,690
State:
$55,872
(% of AGI for various income ranges: 1068.4% for AGIs below $25k, 3441.2% for AGIs $25k-50k, 6277.6% for AGIs $50k-75k, 8482.5% for AGIs $75k-100k, 12610.5% for AGIs $100k-200k)
Taxable interest for individuals: $598 (reported on 35.8% of returns)
This zip code:
$598
Tennessee:
$1,945
(% of AGI for various income ranges: 14.8% for AGIs below $25k, 18.9% for AGIs $25k-50k, 22.1% for AGIs $50k-75k, 25.0% for AGIs $75k-100k, 48.0% for AGIs $100k-200k)
Ordinary dividends: $3,003 (reported on 10.3% of returns)
Here:
$3,003
State:
$8,105
(% of AGI for various income ranges: 14.6% for AGIs below $25k, 16.6% for AGIs $25k-50k, 10.6% for AGIs $50k-75k, 31.5% for AGIs $75k-100k, 100.0% for AGIs $100k-200k)
Net capital gain/loss in AGI: +$9,030 (reported on 10.6% of returns)
Here:
+$9,030
State:
+$33,664
(% of AGI for various income ranges: 17.2% for AGIs below $25k, 19.5% for AGIs $25k-50k, 60.0% for AGIs $50k-75k, 93.0% for AGIs $75k-100k, 499.0% for AGIs $100k-200k)
Profit/loss from business: +$17,581 (reported on 14.9% of returns)
Here:
+$17,581
State:
+$18,991
(% of AGI for various income ranges: 154.3% for AGIs below $25k, 140.0% for AGIs $25k-50k, 303.0% for AGIs $50k-75k, 274.5% for AGIs $75k-100k, 1860.0% for AGIs $100k-200k)
Taxable individual retirement arrangement distribution: $15,032 (reported on 7.8% of returns)
37681:
$15,032
Tennessee:
$20,036
(% of AGI for various income ranges: 55.6% for AGIs below $25k, 72.3% for AGIs $25k-50k, 173.6% for AGIs $50k-75k, 311.5% for AGIs $75k-100k, 604.5% for AGIs $100k-200k)
Total itemized deductions: $30,462 (reported on 2.8% of returns)
Here:
$30,462
State:
$40,136
(% of AGI for various income ranges: 107.0% for AGIs $25k-50k, 876.0% for AGIs $100k-200k)
Charity contributions: $16,300 (reported on 2.1% of returns)
Here:
$16,300
State:
$19,852
(% of AGI for various income ranges: 20.0% for AGIs $25k-50k, 425.0% for AGIs $100k-200k)
Taxes paid: $4,900 (reported on 2.8% of returns)
37681:
$4,900
State:
$6,038
(% of AGI for various income ranges: 18.3% for AGIs $25k-50k, 68.0% for AGIs $100k-200k)
Earned income credit: $2,237 (reported on 18.1% of returns)
Here:
$2,237
State:
$2,391
(% of AGI for various income ranges: 83.3% for AGIs below $25k, 75.5% for AGIs $25k-50k)
Percentage of individuals using paid preparers for their 2020 taxes: 94.7%
Here:
95%
State:
93%
(% for various income ranges: 93.2% for AGIs below $25k, 97.4% for AGIs $25k-50k, 93.0% for AGIs $50k-75k, 96.2% for AGIs $75k-100k, 96.3% for AGIs $100k-200k, 83.3% for AGIs over 200k)
Averages for the 2012 tax year for zip code 37681, filed in 2013:
Average Adjusted Gross Income (AGI) in 2012: $39,525 (Individual Income Tax Returns)
Here:
$39,525
State:
$53,767
Salary/wage: $37,153 (reported on 83.4% of returns)
Here:
$37,153
State:
$45,421
(% of AGI for various income ranges: 73.7% for AGIs below $25k, 83.0% for AGIs $25k-50k, 84.8% for AGIs $50k-75k, 81.0% for AGIs $75k-100k, 68.2% for AGIs $100k-200k)
Taxable interest for individuals: $783 (reported on 30.8% of returns)
This zip code:
$783
Tennessee:
$1,732
(% of AGI for various income ranges: 1.5% for AGIs below $25k, 0.5% for AGIs $25k-50k, 0.2% for AGIs $50k-75k, 0.2% for AGIs $75k-100k, 0.9% for AGIs $100k-200k)
Ordinary dividends: $1,314 (reported on 8.7% of returns)
Here:
$1,314
State:
$6,739
(% of AGI for various income ranges: 0.5% for AGIs below $25k, 0.2% for AGIs $25k-50k, 0.1% for AGIs $50k-75k, 0.1% for AGIs $75k-100k, 0.6% for AGIs $100k-200k)
Net capital gain/loss in AGI: +$2,641 (reported on 10.7% of returns)
Here:
+$2,641
State:
+$19,082
(% of AGI for various income ranges: 0.5% for AGIs below $25k, 0.6% for AGIs $25k-50k, 0.2% for AGIs $75k-100k, 1.9% for AGIs $100k-200k)
Profit/loss from business: +$8,976 (reported on 15.0% of returns)
Here:
+$8,976
State:
+$15,240
(% of AGI for various income ranges: 10.1% for AGIs below $25k, 2.7% for AGIs $25k-50k, 2.3% for AGIs $50k-75k, 2.5% for AGIs $75k-100k, 1.8% for AGIs $100k-200k)
Taxable individual retirement arrangement distribution: $13,042 (reported on 7.5% of returns)
37681:
$13,042
Tennessee:
$15,505
(% of AGI for various income ranges: 2.6% for AGIs below $25k, 1.3% for AGIs $25k-50k, 1.7% for AGIs $50k-75k, 3.2% for AGIs $75k-100k, 3.9% for AGIs $100k-200k)
Total itemized deductions: $17,321 (24% of AGI, reported on 15.4% of returns)
Here:
$17,321
State:
$21,976
Here:
24.0% of AGI
State:
17.8% of AGI
(% of AGI for various income ranges: 5.3% for AGIs below $25k, 5.2% for AGIs $25k-50k, 6.1% for AGIs $50k-75k, 8.2% for AGIs $75k-100k, 9.0% for AGIs $100k-200k)
Charity contributions: $4,904 (reported on 11.1% of returns)
Here:
$4,904
State:
$6,709
(% of AGI for various income ranges: 0.4% for AGIs below $25k, 0.7% for AGIs $25k-50k, 0.7% for AGIs $50k-75k, 2.1% for AGIs $75k-100k, 2.8% for AGIs $100k-200k)
Taxes paid: $3,008 (reported on 15.0% of returns)
37681:
$3,008
State:
$4,829
(% of AGI for various income ranges: 0.6% for AGIs below $25k, 0.7% for AGIs $25k-50k, 1.0% for AGIs $50k-75k, 1.7% for AGIs $75k-100k, 1.7% for AGIs $100k-200k)
Earned income credit: $2,247 (reported on 24.5% of returns)
Here:
$2,247
State:
$2,404
(% of AGI for various income ranges: 7.4% for AGIs below $25k, 1.4% for AGIs $25k-50k)
Percentage of individuals using paid preparers for their 2012 taxes: 58.9%
Here:
59%
State:
52%
(% for various income ranges: 55.8% for AGIs below $25k, 60.0% for AGIs $25k-50k, 60.0% for AGIs $50k-75k, 68.4% for AGIs $75k-100k, 62.5% for AGIs $100k-200k)
Averages for the 2004 tax year for zip code 37681, filed in 2005:
Average Adjusted Gross Income (AGI) in 2004: $32,901 (Individual Income Tax Returns)
Here:
$32,901
State:
$44,088
Salary/wage: $31,419 (reported on 85.6% of returns)
Here:
$31,419
State:
$38,825
(% of AGI for various income ranges: 153.9% for AGIs below $10k, 83.0% for AGIs $10k-25k, 87.2% for AGIs $25k-50k, 87.2% for AGIs $50k-75k, 78.0% for AGIs $75k-100k, 59.2% for AGIs over 100k)
Taxable interest for individuals: $1,298 (reported on 33.6% of returns)
This zip code:
$1,298
Tennessee:
$1,802
(% of AGI for various income ranges: 9.7% for AGIs below $10k, 1.6% for AGIs $10k-25k, 0.8% for AGIs $25k-50k, 0.4% for AGIs $50k-75k, 1.9% for AGIs $75k-100k, 2.2% for AGIs over 100k)
Taxable dividends: $1,384 (reported on 11.5% of returns)
Here:
$1,384
State:
$3,727
(% of AGI for various income ranges: 5.3% for AGIs below $10k, 0.3% for AGIs $10k-25k, 0.4% for AGIs $25k-50k, 0.3% for AGIs $50k-75k, 1.0% for AGIs $75k-100k, 0.4% for AGIs over 100k)
Net capital gain/loss: +$6,929 (reported on 8.5% of returns)
Here:
+$6,929
State:
+$15,776
(% of AGI for various income ranges: -1.9% for AGIs below $10k, 0.3% for AGIs $10k-25k, 0.3% for AGIs $25k-50k, 1.3% for AGIs $50k-75k, 1.3% for AGIs $75k-100k, 7.3% for AGIs over 100k)
Profit/loss from business: +$7,159 (reported on 15.8% of returns)
Here:
+$7,159
State:
+$12,882
(% of AGI for various income ranges: 15.6% for AGIs below $10k, 5.9% for AGIs $10k-25k, 3.5% for AGIs $25k-50k, 1.8% for AGIs $50k-75k, 3.8% for AGIs $75k-100k, 1.9% for AGIs over 100k)
IRA payment deduction: $2,186 (reported on 1.7% of returns)
37681:
$2,186
Tennessee:
$2,934
Total itemized deductions: $14,494 (21% of AGI, reported on 14.5% of returns)
Here:
$14,494
State:
$18,035
Here:
21.2% of AGI
State:
19.9% of AGI
(% of AGI for various income ranges: 9.9% for AGIs below $10k, 2.9% for AGIs $10k-25k, 5.8% for AGIs $25k-50k, 7.2% for AGIs $50k-75k, 9.2% for AGIs $75k-100k, 7.1% for AGIs over 100k)
Charity contributions deductions: $2,981 (4% of AGI, reported on 10.9% of returns)
Here:
$2,981
State:
$5,167
Here:
4.1% of AGI
State:
5.3% of AGI
(% of AGI for various income ranges: 1.1% for AGIs below $10k, 0.4% for AGIs $10k-25k, 0.6% for AGIs $25k-50k, 1.2% for AGIs $50k-75k, 1.3% for AGIs $75k-100k, 1.6% for AGIs over 100k)
Total tax: $4,195 (reported on 72.5% of returns)
37681:
$4,195
State:
$7,482
(% of AGI for various income ranges: 6.3% for AGIs below $10k, 4.0% for AGIs $10k-25k, 6.2% for AGIs $25k-50k, 8.4% for AGIs $50k-75k, 11.4% for AGIs $75k-100k, 19.5% for AGIs over 100k)
Earned income credit: $1,748 (reported on 21.5% of returns)
Here:
$1,748
State:
$1,826
Percentage of individuals using paid preparers for their 2004 taxes: 67.0%
Here:
67%
State:
60%
(% for various income ranges: 61.7% for AGIs below $10k, 69.5% for AGIs $10k-25k, 68.5% for AGIs $25k-50k, 66.8% for AGIs $50k-75k, 66.4% for AGIs $75k-100k, 69.1% for AGIs over 100k)
Household received Food Stamps/SNAP in the past 12 months: 174 Household did not receive Food Stamps/SNAP in the past 12 months: 2,430
Women who had a birth in the past 12 months: 42 (43 now married, 0 unmarried) Women who did not have a birth in the past 12 months: 1,222 (652 now married, 570 unmarried)
Housing units in zip code 37681 with a mortgage: 828 (95 second mortgage, 10 home equity loan, 55 both second mortgage and home equity loan) Houses without a mortgage: 23
Median monthly owner costs for units with a mortgage: $1,148 Median monthly owner costs for units without a mortgage: $361
Residents with income below the poverty level in 2022:
This zip code:
12.4%
Whole state:
13.3%
Residents with income below 50% of the poverty level in 2022:
This zip code:
10.3%
Whole state:
7.1%
Median number of rooms in houses and condos:
Here:
6.4
State:
6.5
Median number of rooms in apartments:
Here:
4.1
State:
4.4
Notable locations in this zip code not listed on our city pages
Notable locations in zip code 37681: Washington College Post Office and Station (A), Jockey (B), Gladstone (C), Gravel Hill (D), Eagle Mill (E), Limestone Volunteer Fire Department (F). Display/hide their locations on the map
Churches in zip code 37681 include: Providence Church (A), Liberty Hill United Methodist Church (B), Milburnton Church (C), Asbury United Methodist Church (D), McAllister Methodist Church (E), Pleasant Grove Church (F), Asbury Church (G), Cherry Hill Freewill Baptist Church (H), Morning Star Independent Baptist Church (I). Display/hide their locations on the map
Cemeteries: Wiley Cemetery (1), Whisler Cemetery (2), Waddell Cemetery (3), Urbana Cemetery (4), Stout Cemetery (5), Salem Cemetery (6), Providence Cemetery (7). Display/hide their locations on the map
Streams, rivers, and creeks: Jockey Creek (A), Asbury Creek (B), Painter Creek (C), Cedar Creek (D), Carson Creek (E), Milburnton Creek (F), Splatter Creek (G), Snapp Branch (H). Display/hide their locations on the map
In group quarters: 95 (-1 institutionalized population)
Size of family households: 1,143 2-persons, 252 3-persons, 342 4-persons, 164 5-persons, 11 7-or-more-persons
Size of nonfamily households: 580 1-person, 60 2-persons, 37 3-persons
877 married couples with children.
109 single-parent households (37 men, 72 women).
99.4% of residents of 37681 zip code speak English at home.
0.8% of residents speak other Indo-European language at home (100% well).
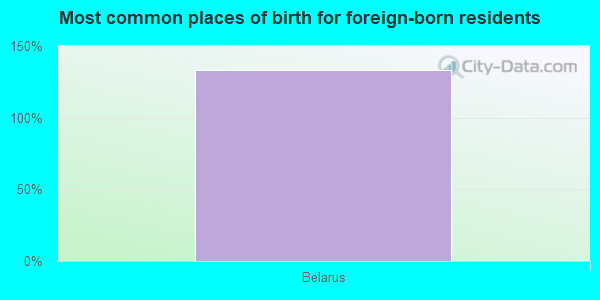
Foreign born population: 12 (0.2%) (100.0% of them are naturalized citizens)
This zip code:
0.2%
Whole state:
5.6%
133%Belarus
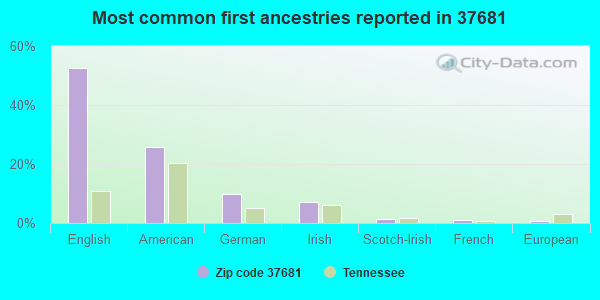
52%English
26%American
10%German
7%Irish
1%Scotch-Irish
1%French
1%European
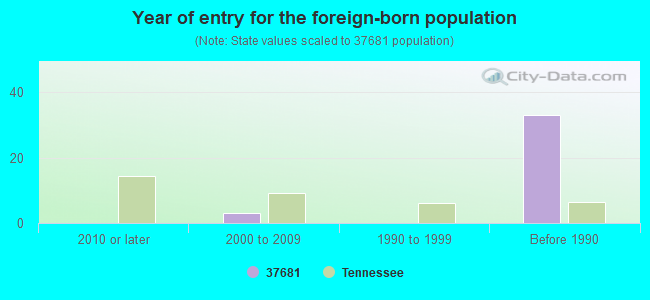
Year of entry for the foreign-born population
02010 or later
32000 to 2009
01990 to 1999
33Before 1990
Facilities with environmental interests located in this zip code:
DAVY CROCKETT PARK (1214 DAVY CROCKETT PARK RD in LIMESTONE, TN)
National Pollutant Discharge Elimination System NON-MAJOR (Tracking pollutant discharge elimination systems) - permit Business SIC classification: SEWERAGE SYSTEMS Organizations: DAVY CROCKETT BRTHPL. ST. PARK (CONTACT/OWNER)
Alternative names: DAVY CROCKETT BRTHPL. ST. PARK, TDEC-D.CROCKETT BIRTH S.P. STP
DOUG FOX FARM (180 BREEZY HILL LN in LIMESTONE, TN)
National Pollutant Discharge Elimination System NON-MAJOR (Tracking pollutant discharge elimination systems) - permit Business SIC classification: BROILER, FRYER, AND ROASTER CHICKENS
Housing units lacking complete plumbing facilities: 2.4% Housing units lacking complete kitchen facilities: 3.7%
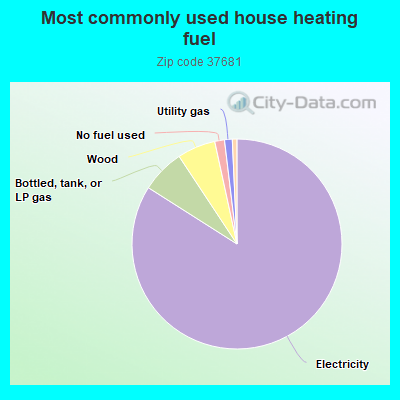
84.1%Electricity
6.7%Bottled, tank, or LP gas
5.9%Wood
1.5%No fuel used
1.2%Utility gas
0.7%Fuel oil, kerosene, etc.
Population in 1990: 4,354. Population change in the 1990s: +1,526 (+35.0%).
Place of birth for U.S.-born residents:
This state: 4,712
Northeast: 171
Midwest: 337
South: 841
West: 66
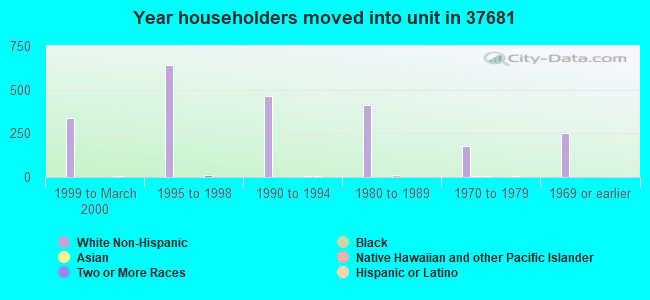
63% of the 37681 zip code residents lived in the same house 5 years ago. Out of people who lived in different houses, 48% lived in this county. Out of people who lived in different counties, 50% lived in Tennessee.
96% of the 37681 zip code residents lived in the same house 1 year ago. Out of people who lived in different houses, 38% moved from this county. Out of people who lived in different houses, 66% moved from different county within same state. Out of people who lived in different houses, 4% moved from different state. Out of people who lived in different houses, 1% moved from abroad.
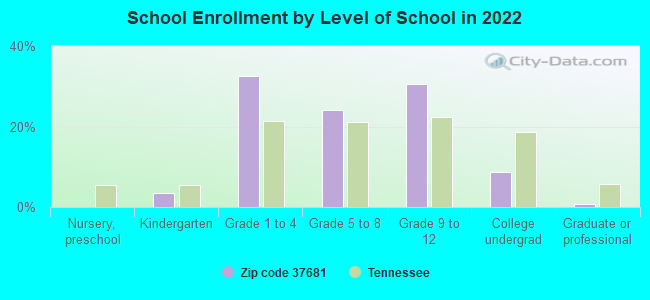
Private vs. public school enrollment:
Students in private schools in grades 1 to 8 (elementary and middle school): 102
Here:
16.9%
Tennessee:
15.0%
Students in private schools in grades 9 to 12 (high school): 47
Here:
14.5%
Tennessee:
16.2%
Students in private undergraduate colleges: 26
Here:
28.1%
Tennessee:
23.5%
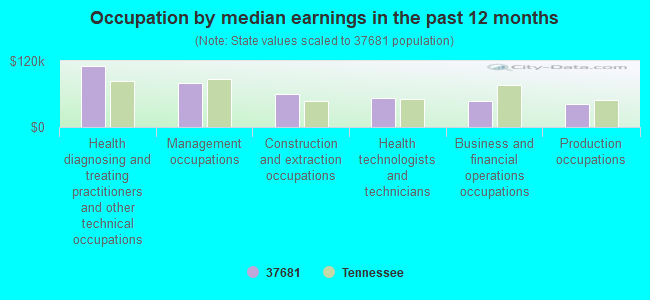
Occupation by median earnings in the past 12 months ($)
111,171Health diagnosing and treating practitioners and other technical occupations
80,908Management occupations
60,083Construction and extraction occupations
51,945Health technologists and technicians
47,578Business and financial operations occupations
42,015Production occupations
Companies with federal contracts located in this zip code:
B & K ENTERPRISES (CULVER RD in LIMESTONE, TN; small business) 6 employees, $80000 revenue. : $138,400 in 6 contractsfrom 2001 to 2004
Contracts for Custodial Janitorial Services, Other Housekeeping Services by Department of Veterans Affairs Signed by year:2000: $0; 2001: $34,000; 2002: $0; 2003: $69,000; 2004: $35,400; 2005: $0; 2006: $0.
Biggest contracts:
$35,400 with Department of Veterans Affairs for Custodial Janitorial Services. Signed on 2004-10-01. Completion date: 2005-09-30.
$34,800, same as above.Signed on 2003-10-01. Completion date: 2004-09-30.
$34,200 with Department of Veterans Affairs for Other Housekeeping Services. Signed on 2003-04-15. Completion date: 2003-09-15.
$34,000, same as above.Signed on 2001-10-15. Completion date: 2002-09-15.
Top industries in this zip code by the number of employees in 2005:
Health Care and Social Assistance: Nursing Care Facilities (50-99 employees: 1 establishment)
Health Care and Social Assistance: All Other Outpatient Care Centers (20-49: 1, 5-9: 1)
Construction: New Single-Family Housing Construction (except Operative Builders) (10-19: 1, 5-9: 1, 1-4: 1)
Educational Services: Fine Arts Schools (10-19: 1)
Health Care and Social Assistance: Child Day Care Services (10-19: 1)
Accommodation and Food Services: Full-Service Restaurants (10-19: 1)
Construction: Plumbing, Heating, and Air-Conditioning Contractors (5-9: 1, 1-4: 1)
People in group quarters in 2010:
60 people in nursing facilities/skilled-nursing facilities
26 people in residential treatment centers for adults
13 people in residential treatment centers for juveniles (non-correctional)
People in group quarters in 2000:
72 people in nursing homes
7 people in agriculture workers' dormitories on farms
Fatal accident statistics in 2014:
Fatal accident count: 1
Vehicles involved in fatal accidents: 1
Fatal accidents caused by drunken drivers: 1
Fatalities: 1
Persons involved in fatal accidents: 2
Pedestrians involved in fatal accidents: 0
Fatal accident statistics in 2013:
Fatal accident count: 1
Vehicles involved in fatal accidents: 2
Fatal accidents caused by drunken drivers: 0
Fatalities: 1
Persons involved in fatal accidents: 2
Pedestrians involved in fatal accidents: 0
Home Mortgage Disclosure Act Aggregated Statistics For Year 2009 (Based on 6 partial tracts)
A) FHA, FSA/RHS & VA Home Purchase Loans
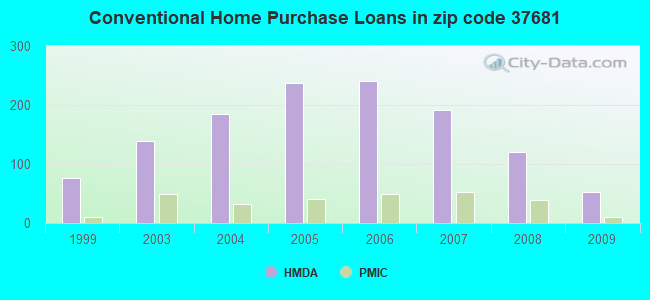
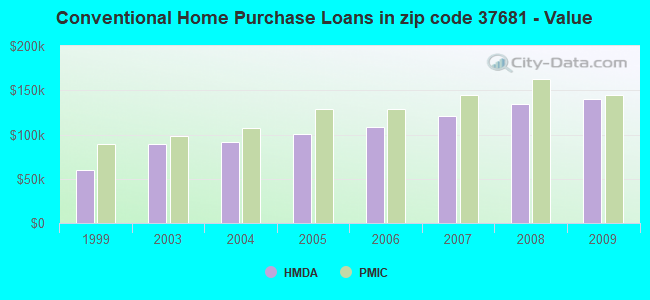
B) Conventional Home Purchase Loans
C) Refinancings
D) Home Improvement Loans
F) Non-occupant Loans on < 5 Family Dwellings (A B C & D)
G) Loans On Manufactured Home Dwelling (A B C & D)
Number
Average Value
Number
Average Value
Number
Average Value
Number
Average Value
Number
Average Value
Number
Average Value
LOANS ORIGINATED
61
$127,630
53
$139,760
239
$125,249
15
$41,449
13
$127,679
41
$63,224
APPLICATIONS APPROVED, NOT ACCEPTED
8
$141,796
5
$98,010
17
$127,864
2
$69,710
1
$88,650
6
$57,552
APPLICATIONS DENIED
9
$114,207
13
$119,017
91
$125,387
17
$35,801
4
$122,638
23
$67,217
APPLICATIONS WITHDRAWN
9
$111,284
11
$190,049
43
$127,622
2
$72,155
1
$63,280
5
$74,664
FILES CLOSED FOR INCOMPLETENESS
3
$99,100
1
$136,740
10
$130,287
4
$72,782
1
$44,110
1
$129,680
Aggregated Statistics For Year 2008 (Based on 6 partial tracts)
A) FHA, FSA/RHS & VA Home Purchase Loans
B) Conventional Home Purchase Loans
C) Refinancings
D) Home Improvement Loans
F) Non-occupant Loans on < 5 Family Dwellings (A B C & D)
G) Loans On Manufactured Home Dwelling (A B C & D)
Number
Average Value
Number
Average Value
Number
Average Value
Number
Average Value
Number
Average Value
Number
Average Value
LOANS ORIGINATED
52
$125,727
120
$135,008
199
$114,675
19
$44,852
33
$120,833
57
$65,464
APPLICATIONS APPROVED, NOT ACCEPTED
3
$91,133
6
$130,815
26
$84,438
2
$12,555
1
$70,710
9
$49,282
APPLICATIONS DENIED
8
$115,474
28
$104,035
121
$112,640
21
$65,625
4
$62,780
30
$79,044
APPLICATIONS WITHDRAWN
4
$140,190
16
$148,846
49
$118,455
2
$87,550
1
$210,480
8
$81,739
FILES CLOSED FOR INCOMPLETENESS
1
$72,690
0
$0
9
$108,051
2
$81,970
0
$0
2
$62,655
Aggregated Statistics For Year 2007 (Based on 6 partial tracts)
A) FHA, FSA/RHS & VA Home Purchase Loans
B) Conventional Home Purchase Loans
C) Refinancings
D) Home Improvement Loans
F) Non-occupant Loans on < 5 Family Dwellings (A B C & D)
G) Loans On Manufactured Home Dwelling (A B C & D)
Number
Average Value
Number
Average Value
Number
Average Value
Number
Average Value
Number
Average Value
Number
Average Value
LOANS ORIGINATED
27
$115,915
192
$121,446
183
$105,313
39
$37,659
33
$110,195
66
$64,768
APPLICATIONS APPROVED, NOT ACCEPTED
1
$36,170
27
$90,356
44
$115,420
4
$55,465
4
$88,258
13
$73,851
APPLICATIONS DENIED
9
$133,100
48
$85,580
137
$113,227
36
$54,645
13
$81,324
60
$64,970
APPLICATIONS WITHDRAWN
1
$86,480
17
$125,501
58
$124,885
6
$104,807
2
$100,295
8
$74,594
FILES CLOSED FOR INCOMPLETENESS
4
$99,688
4
$113,298
14
$180,825
1
$67,930
0
$0
7
$98,303
Aggregated Statistics For Year 2006 (Based on 6 partial tracts)
A) FHA, FSA/RHS & VA Home Purchase Loans
B) Conventional Home Purchase Loans
C) Refinancings
D) Home Improvement Loans
F) Non-occupant Loans on < 5 Family Dwellings (A B C & D)
G) Loans On Manufactured Home Dwelling (A B C & D)
Number
Average Value
Number
Average Value
Number
Average Value
Number
Average Value
Number
Average Value
Number
Average Value
LOANS ORIGINATED
23
$94,847
241
$108,467
182
$98,995
41
$30,133
39
$90,002
67
$56,093
APPLICATIONS APPROVED, NOT ACCEPTED
3
$68,223
38
$87,858
47
$93,820
3
$50,983
10
$66,531
21
$61,831
APPLICATIONS DENIED
4
$129,292
84
$78,542
150
$92,852
42
$42,146
29
$71,263
80
$62,769
APPLICATIONS WITHDRAWN
3
$61,233
27
$84,983
82
$119,673
12
$47,686
6
$72,430
16
$52,144
FILES CLOSED FOR INCOMPLETENESS
1
$59,110
9
$88,059
28
$117,888
1
$26,470
1
$66,170
1
$89,960
Aggregated Statistics For Year 2005 (Based on 6 partial tracts)
A) FHA, FSA/RHS & VA Home Purchase Loans
B) Conventional Home Purchase Loans
C) Refinancings
D) Home Improvement Loans
F) Non-occupant Loans on < 5 Family Dwellings (A B C & D)
G) Loans On Manufactured Home Dwelling (A B C & D)
Number
Average Value
Number
Average Value
Number
Average Value
Number
Average Value
Number
Average Value
Number
Average Value
LOANS ORIGINATED
22
$111,937
238
$100,429
200
$90,753
37
$34,182
26
$115,722
61
$57,444
APPLICATIONS APPROVED, NOT ACCEPTED
1
$56,180
37
$99,271
42
$75,199
3
$85,530
1
$134,690
17
$62,096
APPLICATIONS DENIED
6
$60,525
85
$77,567
171
$95,009
31
$41,559
8
$84,650
90
$63,020
APPLICATIONS WITHDRAWN
3
$98,017
26
$90,732
112
$96,231
7
$130,847
3
$67,870
25
$71,942
FILES CLOSED FOR INCOMPLETENESS
1
$50,290
8
$66,762
13
$94,413
2
$16,975
0
$0
2
$57,345
Aggregated Statistics For Year 2004 (Based on 6 partial tracts)
A) FHA, FSA/RHS & VA Home Purchase Loans
B) Conventional Home Purchase Loans
C) Refinancings
D) Home Improvement Loans
F) Non-occupant Loans on < 5 Family Dwellings (A B C & D)
G) Loans On Manufactured Home Dwelling (A B C & D)
Number
Average Value
Number
Average Value
Number
Average Value
Number
Average Value
Number
Average Value
Number
Average Value
LOANS ORIGINATED
21
$104,973
184
$91,858
222
$79,702
39
$32,751
21
$68,626
86
$55,990
APPLICATIONS APPROVED, NOT ACCEPTED
0
$0
36
$75,853
60
$85,253
8
$18,309
3
$30,177
31
$56,356
APPLICATIONS DENIED
5
$67,456
92
$70,154
211
$85,036
39
$23,889
6
$65,178
124
$61,387
APPLICATIONS WITHDRAWN
4
$71,090
19
$108,262
103
$93,452
8
$30,452
2
$42,980
30
$70,913
FILES CLOSED FOR INCOMPLETENESS
0
$0
10
$106,362
18
$92,005
0
$0
0
$0
3
$76,767
Aggregated Statistics For Year 2003 (Based on 6 partial tracts)
A) FHA, FSA/RHS & VA Home Purchase Loans
B) Conventional Home Purchase Loans
C) Refinancings
D) Home Improvement Loans
F) Non-occupant Loans on < 5 Family Dwellings (A B C & D)
Number
Average Value
Number
Average Value
Number
Average Value
Number
Average Value
Number
Average Value
LOANS ORIGINATED
20
$96,642
139
$89,104
345
$84,938
34
$20,374
23
$64,306
APPLICATIONS APPROVED, NOT ACCEPTED
4
$76,808
24
$70,327
72
$90,149
3
$14,847
4
$75,188
APPLICATIONS DENIED
5
$118,636
97
$58,811
218
$83,363
22
$20,270
5
$68,212
APPLICATIONS WITHDRAWN
1
$52,050
13
$82,089
96
$91,615
2
$13,570
2
$52,140
FILES CLOSED FOR INCOMPLETENESS
0
$0
5
$86,304
9
$81,294
0
$0
0
$0
Aggregated Statistics For Year 1999 (Based on 1 full and 3 partial tracts)
A) FHA, FSA/RHS & VA Home Purchase Loans
B) Conventional Home Purchase Loans
C) Refinancings
D) Home Improvement Loans
F) Non-occupant Loans on < 5 Family Dwellings (A B C & D)
Detailed PMIC statistics for the following Tracts:0616.00
, 0619.00
2003 - 2018 National Fire Incident Reporting System (NFIRS) incidents
According to the data from the years 2003 - 2018 the average number of fires per year is 27. The highest number of reported fires - 39 took place in 2005, and the least - 9 in 2003. The data has a rising trend.
When looking into fire subcategories, the most reports belonged to: Structure Fires (51.8%), and Outside Fires (33.4%).
Fire incident types reported to NFIRS in Zip Code 37681
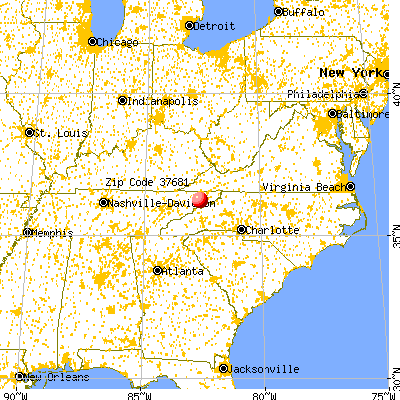


 Nearest zip codes: 37690, 37641, 37616, 37659, 37656, 37745.
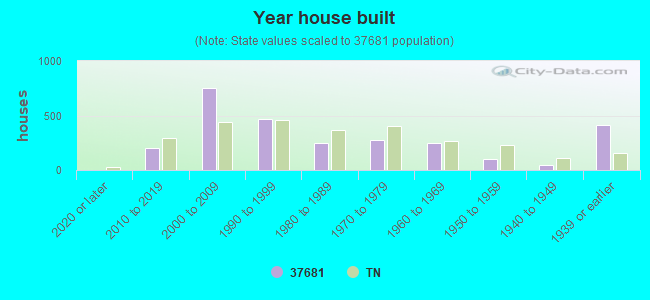


 According to the data from the years 2003 - 2018 the average number of fires per year is 27. The highest number of reported fires - 39 took place in 2005, and the least - 9 in 2003. The data has a rising trend.
 When looking into fire subcategories, the most reports belonged to: Structure Fires (51.8%), and Outside Fires (33.4%).