Estimated zip code population in 2022: 4,632 Zip code population in 2010: 3,725 Zip code population in 2000: 3,121
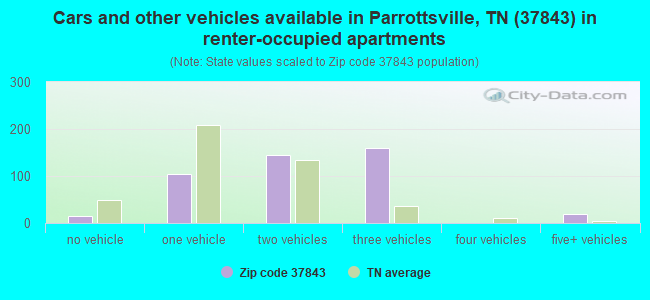
Houses and condos: 2,166 Renter-occupied apartments: 435
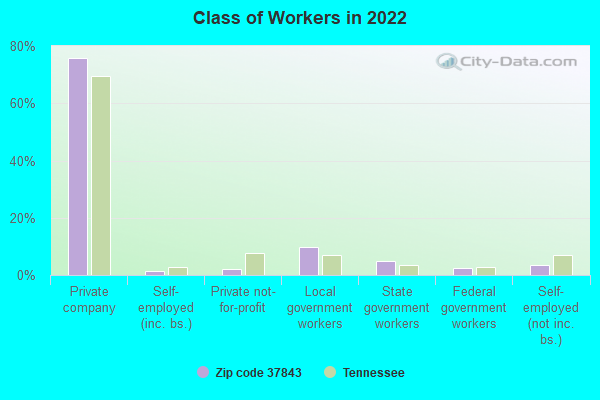
% of renters here:
22%
State:
33%
March 2022 cost of living index in zip code 37843: 79.1 (low, U.S. average is 100)
Land area: 51.9 sq. mi. Water area: 0.2 sq. mi.
Population density: 89 people per square mile
(very low).
OSM Map
General Map
Google Map
MSN Map
OSM Map
General Map
Google Map
MSN Map
OSM Map
General Map
Google Map
MSN Map
OSM Map
General Map
Google Map
MSN Map
Please wait while loading the map...
Real estate property taxes paid for housing units in 2022:
This zip code:
0.4% ($917)
Tennessee:
0.5% ($1,376)
Median real estate property taxes paid for housing units with mortgages in 2022: $861 (0.4%) Median real estate property taxes paid for housing units with no mortgage in 2022: $953 (0.4%)
Business Search- 14 Million verified businesses
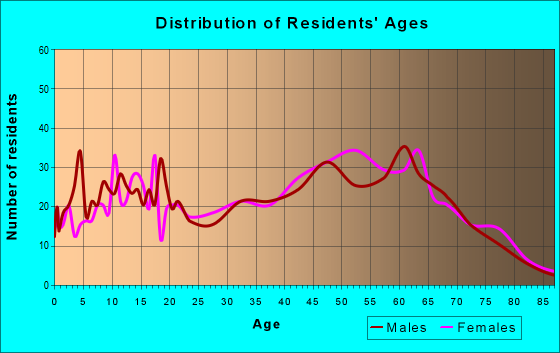
Males: 2,427
(52.4%)
Females: 2,205
(47.6%)
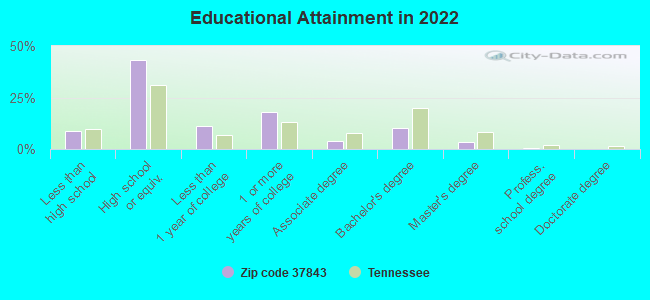
For population 25 years and over in 37843:
High school or higher: 89.8%
Bachelor's degree or higher: 14.1%
Graduate or professional degree: 4.1%
Unemployed: 5.3%
Mean travel time to work (commute): 27.9 minutes
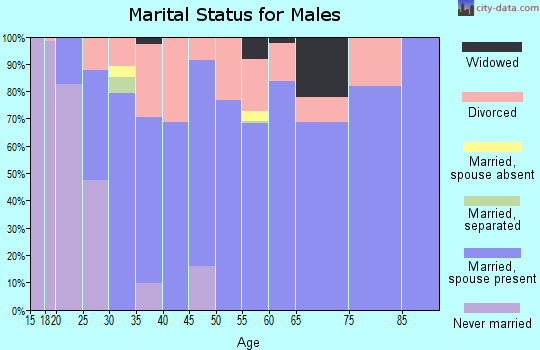
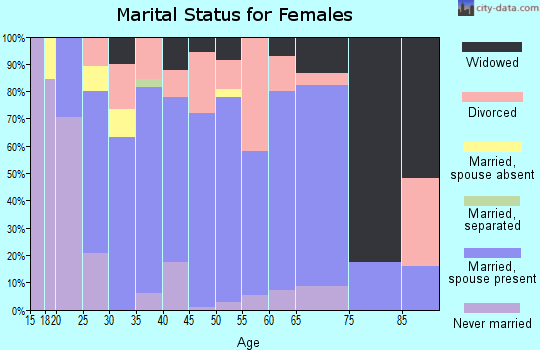
For population 15 years and over in 37843:
Never married: 26.6%
Now married: 46.5%
Separated: 1.2%
Widowed: 10.9%
Divorced: 14.8%
Zip code 37843 compared to state average:
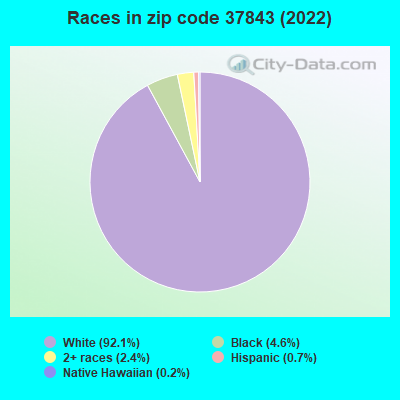
Black race population percentage significantly below state average.
Hispanic race population percentage significantly below state average.
Median age above state average.
Foreign-born population percentage significantly below state average.
Renting percentage below state average.
Length of stay since moving in significantly above state average.
Number of college students below state average.
Percentage of population with a bachelor's degree or higher below state average.
Averages for the 2020 tax year for zip code 37843, filed in 2021:
Average Adjusted Gross Income (AGI) in 2020: $47,817 (Individual Income Tax Returns)
Here:
$47,817
State:
$69,014
Salary/wage: $42,755 (reported on 79.7% of returns)
Here:
$42,755
State:
$55,872
(% of AGI for various income ranges: 1109.2% for AGIs below $25k, 3443.2% for AGIs $25k-50k, 6066.3% for AGIs $50k-75k, 8528.3% for AGIs $75k-100k, 12746.0% for AGIs $100k-200k)
Taxable interest for individuals: $1,024 (reported on 26.7% of returns)
This zip code:
$1,024
Tennessee:
$1,945
(% of AGI for various income ranges: 17.9% for AGIs below $25k, 14.3% for AGIs $25k-50k, 24.2% for AGIs $50k-75k, 78.3% for AGIs $75k-100k, 185.0% for AGIs $100k-200k)
Ordinary dividends: $3,147 (reported on 11.0% of returns)
Here:
$3,147
State:
$8,105
(% of AGI for various income ranges: 7.7% for AGIs below $25k, 18.9% for AGIs $25k-50k, 7.9% for AGIs $50k-75k, 104.2% for AGIs $75k-100k, 348.0% for AGIs $100k-200k)
Net capital gain/loss in AGI: +$5,871 (reported on 9.9% of returns)
Here:
+$5,871
State:
+$33,664
(% of AGI for various income ranges: 6.5% for AGIs below $25k, 28.1% for AGIs $25k-50k, 73.7% for AGIs $50k-75k, 103.3% for AGIs $75k-100k, 596.0% for AGIs $100k-200k)
Profit/loss from business: +$13,738 (reported on 15.1% of returns)
Here:
+$13,738
State:
+$18,991
(% of AGI for various income ranges: 144.2% for AGIs below $25k, 155.7% for AGIs $25k-50k, 168.9% for AGIs $50k-75k, 1925.0% for AGIs $100k-200k)
Taxable individual retirement arrangement distribution: $11,900 (reported on 9.3% of returns)
37843:
$11,900
Tennessee:
$20,036
(% of AGI for various income ranges: 67.5% for AGIs below $25k, 189.5% for AGIs $25k-50k, 283.3% for AGIs $75k-100k, 512.0% for AGIs $100k-200k)
Total itemized deductions: $32,000 (reported on 2.3% of returns)
Here:
$32,000
State:
$40,136
(% of AGI for various income ranges: 1066.7% for AGIs $75k-100k)
Charity contributions: $14,800 (reported on 1.7% of returns)
Here:
$14,800
State:
$19,852
(% of AGI for various income ranges: 233.7% for AGIs $50k-75k)
Taxes paid: $5,833 (reported on 1.7% of returns)
37843:
$5,833
State:
$6,038
(% of AGI for various income ranges: 145.8% for AGIs $75k-100k)
Earned income credit: $2,374 (reported on 22.7% of returns)
Here:
$2,374
State:
$2,391
(% of AGI for various income ranges: 122.1% for AGIs below $25k, 78.6% for AGIs $25k-50k)
Percentage of individuals using paid preparers for their 2020 taxes: 95.3%
Here:
95%
State:
93%
(% for various income ranges: 95.6% for AGIs below $25k, 93.5% for AGIs $25k-50k, 95.8% for AGIs $50k-75k, 94.1% for AGIs $75k-100k, 100.0% for AGIs $100k-200k, 100.0% for AGIs over 200k)
Averages for the 2012 tax year for zip code 37843, filed in 2013:
Average Adjusted Gross Income (AGI) in 2012: $38,339 (Individual Income Tax Returns)
Here:
$38,339
State:
$53,767
Salary/wage: $35,153 (reported on 82.2% of returns)
Here:
$35,153
State:
$45,421
(% of AGI for various income ranges: 71.8% for AGIs below $25k, 79.3% for AGIs $25k-50k, 79.5% for AGIs $50k-75k, 77.5% for AGIs $75k-100k, 67.5% for AGIs $100k-200k)
Taxable interest for individuals: $988 (reported on 33.6% of returns)
This zip code:
$988
Tennessee:
$1,732
(% of AGI for various income ranges: 1.5% for AGIs below $25k, 1.0% for AGIs $25k-50k, 0.7% for AGIs $50k-75k, 0.4% for AGIs $75k-100k, 0.8% for AGIs $100k-200k)
Ordinary dividends: $1,994 (reported on 10.5% of returns)
Here:
$1,994
State:
$6,739
(% of AGI for various income ranges: 0.4% for AGIs below $25k, 0.8% for AGIs $25k-50k, 0.4% for AGIs $50k-75k, 0.7% for AGIs $75k-100k, 0.4% for AGIs $100k-200k)
Net capital gain/loss in AGI: +$4,082 (reported on 11.2% of returns)
Here:
+$4,082
State:
+$19,082
(% of AGI for various income ranges: 0.4% for AGIs below $25k, 0.1% for AGIs $25k-50k, 0.1% for AGIs $50k-75k, 2.0% for AGIs $75k-100k, 3.5% for AGIs $100k-200k)
Profit/loss from business: +$8,484 (reported on 16.4% of returns)
Here:
+$8,484
State:
+$15,240
(% of AGI for various income ranges: 10.5% for AGIs below $25k, 4.4% for AGIs $25k-50k, 1.0% for AGIs $50k-75k, 4.9% for AGIs $75k-100k)
Taxable individual retirement arrangement distribution: $11,618 (reported on 7.2% of returns)
37843:
$11,618
Tennessee:
$15,505
(% of AGI for various income ranges: 2.8% for AGIs below $25k, 1.5% for AGIs $25k-50k, 2.4% for AGIs $50k-75k, 5.3% for AGIs $75k-100k)
Total itemized deductions: $19,057 (26% of AGI, reported on 13.8% of returns)
Here:
$19,057
State:
$21,976
Here:
26.3% of AGI
State:
17.8% of AGI
(% of AGI for various income ranges: 4.5% for AGIs below $25k, 4.8% for AGIs $25k-50k, 6.9% for AGIs $50k-75k, 9.2% for AGIs $75k-100k, 9.2% for AGIs $100k-200k)
Charity contributions: $5,192 (reported on 8.6% of returns)
Here:
$5,192
State:
$6,709
(% of AGI for various income ranges: 1.0% for AGIs below $25k, 1.3% for AGIs $50k-75k, 1.5% for AGIs $75k-100k, 2.2% for AGIs $100k-200k)
Taxes paid: $3,167 (reported on 13.8% of returns)
37843:
$3,167
State:
$4,829
(% of AGI for various income ranges: 0.5% for AGIs below $25k, 0.7% for AGIs $25k-50k, 1.1% for AGIs $50k-75k, 1.7% for AGIs $75k-100k, 1.7% for AGIs $100k-200k)
Earned income credit: $2,219 (reported on 27.6% of returns)
Here:
$2,219
State:
$2,404
(% of AGI for various income ranges: 8.3% for AGIs below $25k, 1.4% for AGIs $25k-50k)
Percentage of individuals using paid preparers for their 2012 taxes: 65.8%
Here:
66%
State:
52%
(% for various income ranges: 62.5% for AGIs below $25k, 65.8% for AGIs $25k-50k, 70.8% for AGIs $50k-75k, 70.0% for AGIs $75k-100k, 75.0% for AGIs $100k-200k)
Averages for the 2004 tax year for zip code 37843, filed in 2005:
Average Adjusted Gross Income (AGI) in 2004: $31,966 (Individual Income Tax Returns)
Here:
$31,966
State:
$44,088
Salary/wage: $29,330 (reported on 85.9% of returns)
Here:
$29,330
State:
$38,825
(% of AGI for various income ranges: 116.9% for AGIs below $10k, 82.2% for AGIs $10k-25k, 87.5% for AGIs $25k-50k, 86.2% for AGIs $50k-75k, 76.2% for AGIs $75k-100k, 41.1% for AGIs over 100k)
Taxable interest for individuals: $1,232 (reported on 36.7% of returns)
This zip code:
$1,232
Tennessee:
$1,802
(% of AGI for various income ranges: 6.0% for AGIs below $10k, 1.6% for AGIs $10k-25k, 1.1% for AGIs $25k-50k, 0.8% for AGIs $50k-75k, 1.6% for AGIs $75k-100k, 2.1% for AGIs over 100k)
Taxable dividends: $1,303 (reported on 13.0% of returns)
Here:
$1,303
State:
$3,727
(% of AGI for various income ranges: 0.7% for AGIs below $10k, 0.3% for AGIs $10k-25k, 0.4% for AGIs $25k-50k, 0.3% for AGIs $50k-75k, 1.4% for AGIs $75k-100k, 0.9% for AGIs over 100k)
Net capital gain/loss: +$6,796 (reported on 10.9% of returns)
Here:
+$6,796
State:
+$15,776
(% of AGI for various income ranges: 2.6% for AGIs below $10k, 1.5% for AGIs $10k-25k, 0.2% for AGIs $25k-50k, 1.4% for AGIs $50k-75k, 2.0% for AGIs $75k-100k, 9.2% for AGIs over 100k)
Profit/loss from business: +$5,056 (reported on 14.0% of returns)
Here:
+$5,056
State:
+$12,882
(% of AGI for various income ranges: 12.9% for AGIs below $10k, 5.9% for AGIs $10k-25k, 1.8% for AGIs $25k-50k, 1.2% for AGIs $50k-75k, 0.6% for AGIs $75k-100k)
IRA payment deduction: $2,355 (reported on 2.0% of returns)
37843:
$2,355
Tennessee:
$2,934
Total itemized deductions: $17,195 (26% of AGI, reported on 12.1% of returns)
Here:
$17,195
State:
$18,035
Here:
26.1% of AGI
State:
19.9% of AGI
(% of AGI for various income ranges: 6.1% for AGIs $10k-25k, 6.7% for AGIs $25k-50k, 6.6% for AGIs $50k-75k, 7.4% for AGIs $75k-100k, 6.8% for AGIs over 100k)
Charity contributions deductions: $4,275 (6% of AGI, reported on 10.0% of returns)
Here:
$4,275
State:
$5,167
Here:
6.2% of AGI
State:
5.3% of AGI
(% of AGI for various income ranges: 0.5% for AGIs $10k-25k, 0.8% for AGIs $25k-50k, 1.3% for AGIs $50k-75k, 2.2% for AGIs $75k-100k, 3.0% for AGIs over 100k)
Total tax: $3,813 (reported on 70.5% of returns)
37843:
$3,813
State:
$7,482
(% of AGI for various income ranges: 3.3% for AGIs below $10k, 3.9% for AGIs $10k-25k, 6.2% for AGIs $25k-50k, 8.0% for AGIs $50k-75k, 10.6% for AGIs $75k-100k, 18.1% for AGIs over 100k)
Earned income credit: $1,835 (reported on 23.0% of returns)
Here:
$1,835
State:
$1,826
Percentage of individuals using paid preparers for their 2004 taxes: 72.6%
Here:
73%
State:
60%
(% for various income ranges: 64.2% for AGIs below $10k, 75.4% for AGIs $10k-25k, 76.0% for AGIs $25k-50k, 73.5% for AGIs $50k-75k, 66.2% for AGIs $75k-100k, 78.0% for AGIs over 100k)
Likely homosexual households (counted as self-reported same-sex unmarried-partner households)
Lesbian couples: 0.0% of all households
Gay men: 0.6% of all households
Household received Food Stamps/SNAP in the past 12 months: 185 Household did not receive Food Stamps/SNAP in the past 12 months: 1,821
Women who had a birth in the past 12 months: 57 (27 now married, 29 unmarried) Women who did not have a birth in the past 12 months: 868 (408 now married, 460 unmarried)
Housing units in zip code 37843 with a mortgage: 641 (11 second mortgage, 11 both second mortgage and home equity loan) Median monthly owner costs for units with a mortgage: $1,088 Median monthly owner costs for units without a mortgage: $414
Residents with income below the poverty level in 2022:
This zip code:
14.1%
Whole state:
13.3%
Residents with income below 50% of the poverty level in 2022:
This zip code:
7.1%
Whole state:
7.1%
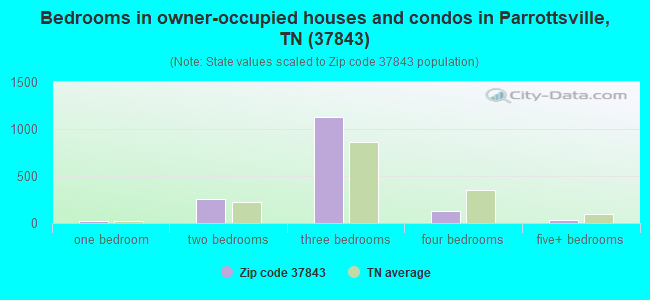
Median number of rooms in houses and condos:
Here:
5.8
State:
6.5
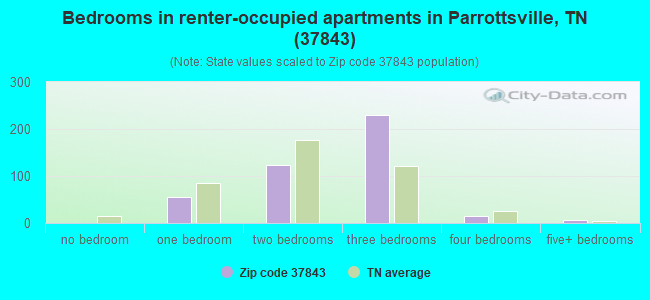
Median number of rooms in apartments:
Here:
5.0
State:
4.4
Notable locations in this zip code not listed on our city pages
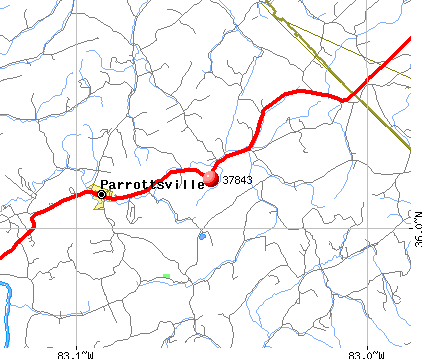
Notable locations in zip code 37843: Parrottsville Volunteer Fire Department (A), Long Creek Volunteer Fire Department (B). Display/hide their locations on the map
Churches in zip code 37843 include: Allen Chapel (A), Saint Tide Church (B), Harned Chapel (C), Luther Memorial Church (D), Mount Bethany Church (E), Oven Creek Church (F), Salem Church (G), Parrottsville United Methodist Church (H), Bethel Baptist Church (I). Display/hide their locations on the map
Streams, rivers, and creeks: South Fork Clear Creek (A), Ottinger Creek (B), Spencer Branch (C), Yellow Spring Branch (D), Dry Branch (E), Freshour Branch (F), Good Hope Branch (G), White Branch (H), North Fork Clear Creek (I). Display/hide their locations on the map
Size of family households: 612 2-persons, 345 3-persons, 240 4-persons, 62 5-persons, 2 6-persons, 34 7-or-more-persons
Size of nonfamily households: 557 1-person, 147 2-persons, 6 3-persons
299 married couples with children.
337 single-parent households (130 men, 207 women).
97.0% of residents of 37843 zip code speak English at home.
0.4% of residents speak Spanish at home (100% very well).
2.2% of residents speak other Indo-European language at home (100% very well).
0.2% of residents speak Asian or Pacific Island language at home (100% very well).
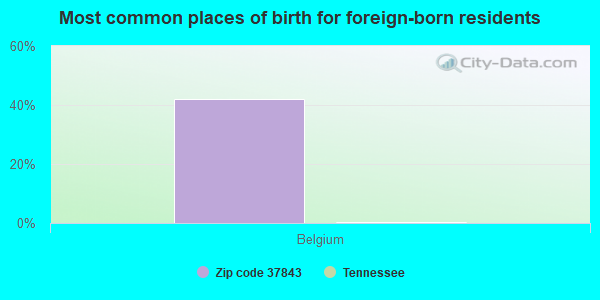
Foreign born population: 49 (1.1%) (100.0% of them are naturalized citizens)
This zip code:
1.1%
Whole state:
5.6%
42%Belgium
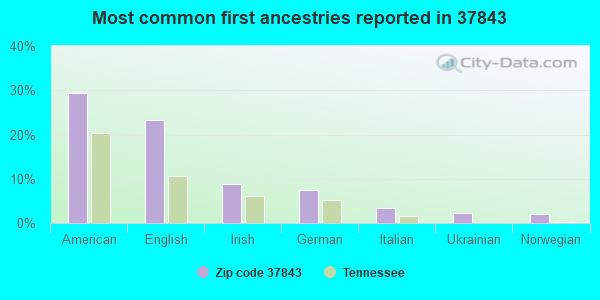
29%American
23%English
9%Irish
7%German
3%Italian
2%Ukrainian
2%Norwegian
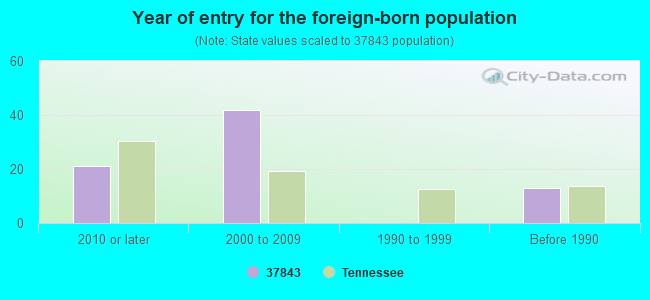
Year of entry for the foreign-born population
212010 or later
422000 to 2009
01990 to 1999
13Before 1990
Housing units lacking complete plumbing facilities: 2.1% Housing units lacking complete kitchen facilities: 3.1%
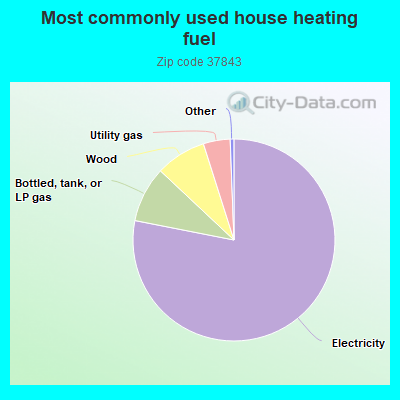
78.1%Electricity
8.9%Bottled, tank, or LP gas
8.1%Wood
4.3%Utility gas
Population in 1990: 3,301.
Place of birth for U.S.-born residents:
This state: 3,112
Northeast: 330
Midwest: 361
South: 696
West: 25
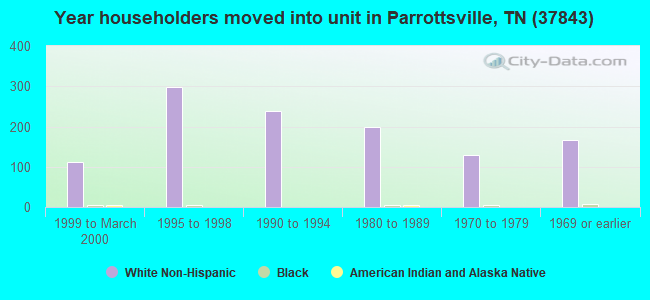
66% of the 37843 zip code residents lived in the same house 5 years ago. Out of people who lived in different houses, 68% lived in this county. Out of people who lived in different counties, 50% lived in Tennessee.
93% of the 37843 zip code residents lived in the same house 1 year ago. Out of people who lived in different houses, 20% moved from this county. Out of people who lived in different houses, 60% moved from different county within same state. Out of people who lived in different houses, 26% moved from different state.
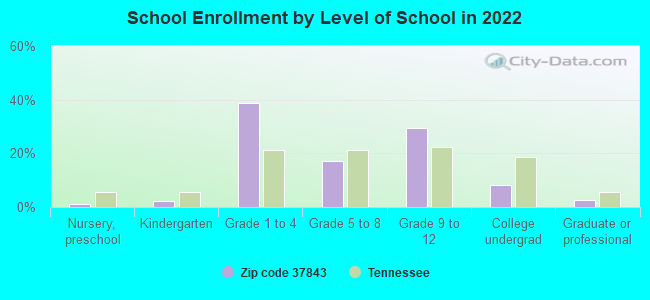
Private vs. public school enrollment:
Students in private schools in grades 1 to 8 (elementary and middle school): 15
Here:
4.5%
Tennessee:
15.0%
Students in private schools in grades 9 to 12 (high school): 18
Here:
10.1%
Tennessee:
16.2%
Students in private undergraduate colleges: 11
Here:
21.4%
Tennessee:
23.5%
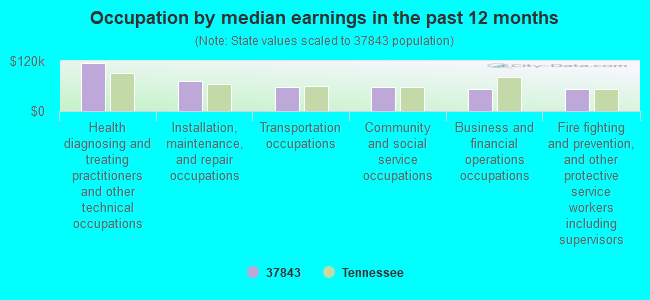
Occupation by median earnings in the past 12 months ($)
114,024Health diagnosing and treating practitioners and other technical occupations
71,292Installation, maintenance, and repair occupations
58,799Transportation occupations
57,827Community and social service occupations
53,477Business and financial operations occupations
52,204Fire fighting and prevention, and other protective service workers including supervisors
Top industries in this zip code by the number of employees in 2005:
Health Care and Social Assistance: All Other Outpatient Care Centers (10-19 employees: 1 establishment)
Administrative and Support and Waste Management and Remediation Services: All Other Support Services (5-9: 1)
Construction: New Single-Family Housing Construction (except Operative Builders) (1-4: 2)
Other Services (except Public Administration): Business Associations (1-4: 1)
Construction: Plumbing, Heating, and Air-Conditioning Contractors (1-4: 1)
Other Services (except Public Administration): Religious Organizations (1-4: 1)
Wholesale Trade: Other Farm Product Raw Material Merchant Wholesalers (1-4: 1)
Real Estate and Rental and Leasing: Offices of Real Estate Agents and Brokers (1-4: 1)
Fatal accident statistics in 2011:
Fatal accident count: 2
Vehicles involved in fatal accidents: 4
Fatal accidents caused by drunken drivers: 0
Fatalities: 2
Persons involved in fatal accidents: 8
Pedestrians involved in fatal accidents: 0
Fatal accident statistics in 2010:
Fatal accident count: 1
Vehicles involved in fatal accidents: 1
Fatal accidents caused by drunken drivers: 1
Fatalities: 1
Persons involved in fatal accidents: 1
Pedestrians involved in fatal accidents: 0
2003 - 2018 National Fire Incident Reporting System (NFIRS) incidents
According to the data from the years 2003 - 2018 the average number of fire incidents per year is 38. The highest number of reported fire incidents - 72 took place in 2014, and the least - 11 in 2004. The data has a growing trend.
When looking into fire subcategories, the most incidents belonged to: Structure Fires (48.2%), and Outside Fires (36.1%).
Fire incident types reported to NFIRS in Zip Code 37843
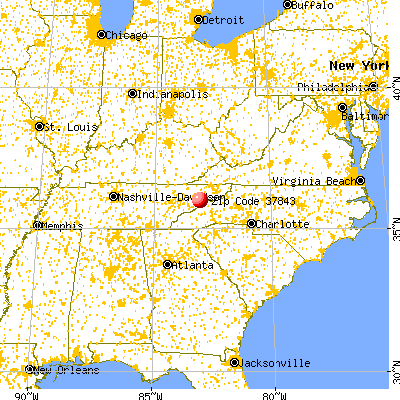


 Nearest zip codes: 37713, 37727, 37809, 37821, 37810, 37818.
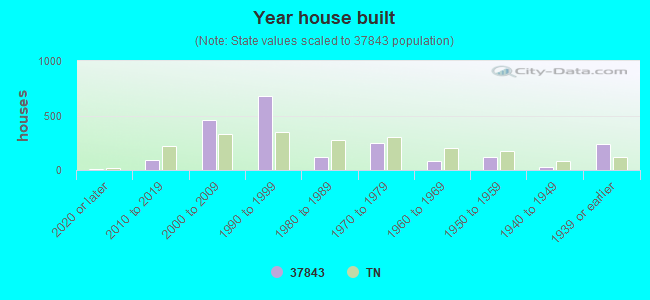


 According to the data from the years 2003 - 2018 the average number of fire incidents per year is 38. The highest number of reported fire incidents - 72 took place in 2014, and the least - 11 in 2004. The data has a growing trend.
 When looking into fire subcategories, the most incidents belonged to: Structure Fires (48.2%), and Outside Fires (36.1%).