Estimated zip code population in 2022: 5,314 Zip code population in 2010: 4,998 Zip code population in 2000: 4,577
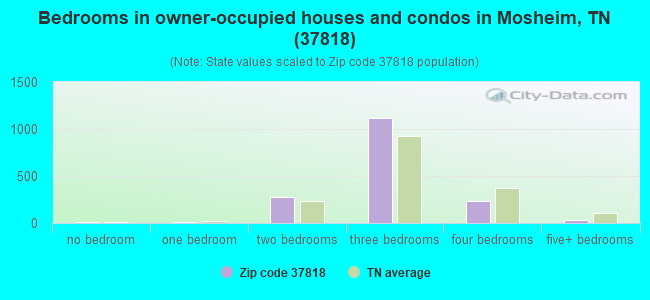
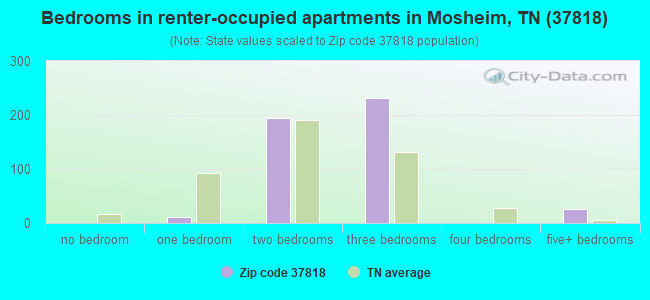
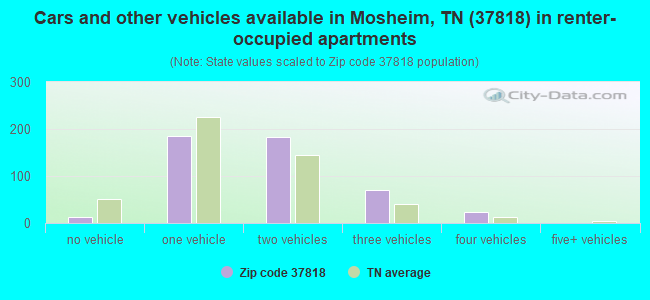
Houses and condos: 2,539 Renter-occupied apartments: 473
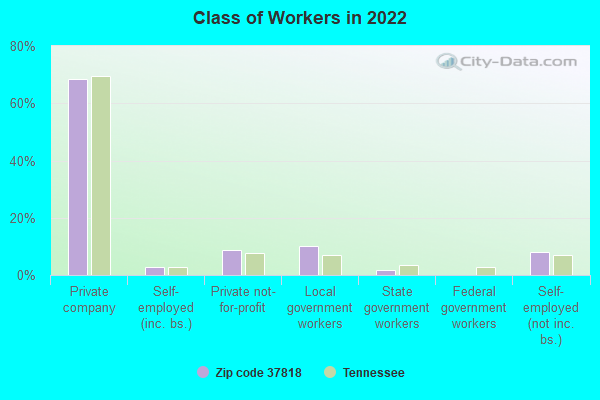
% of renters here:
22%
State:
33%
March 2022 cost of living index in zip code 37818: 79.0 (low, U.S. average is 100)
Land area: 45.7 sq. mi. Water area: 0.2 sq. mi.
Population density: 116 people per square mile
(very low).
OSM Map
General Map
Google Map
MSN Map
OSM Map
General Map
Google Map
MSN Map
OSM Map
General Map
Google Map
MSN Map
OSM Map
General Map
Google Map
MSN Map
Please wait while loading the map...
Real estate property taxes paid for housing units in 2022:
This zip code:
0.3% ($518)
Tennessee:
0.5% ($1,376)
Median real estate property taxes paid for housing units with mortgages in 2022: $632 (0.3%) Median real estate property taxes paid for housing units with no mortgage in 2022: $403 (0.3%)
Business Search- 14 Million verified businesses
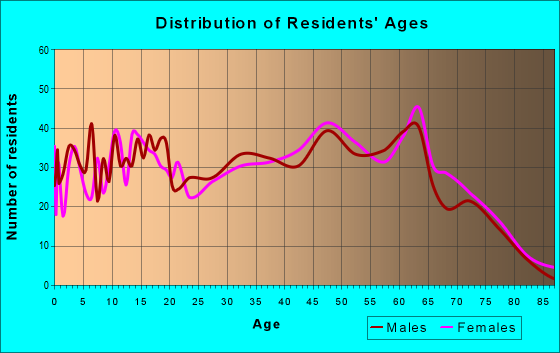
Males: 2,652
(49.9%)
Females: 2,661
(50.1%)
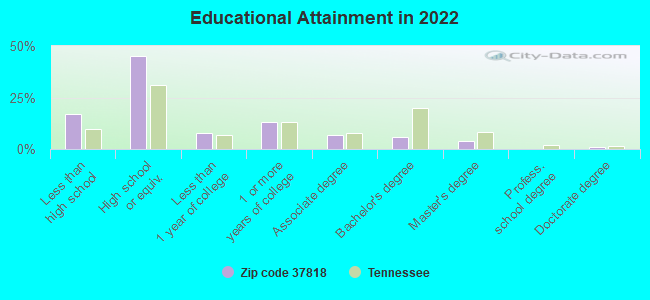
For population 25 years and over in 37818:
High school or higher: 80.7%
Bachelor's degree or higher: 10.1%
Graduate or professional degree: 4.5%
Unemployed: 2.4%
Mean travel time to work (commute): 25.9 minutes
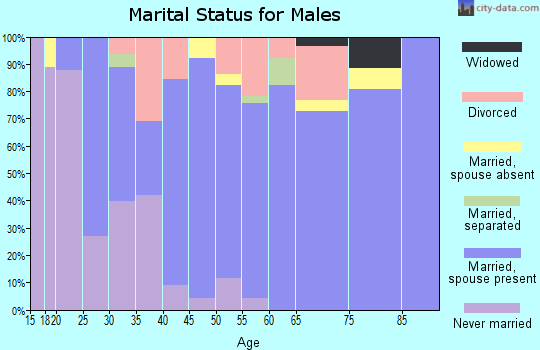
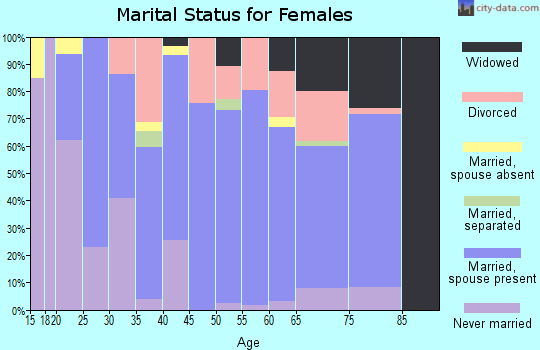
For population 15 years and over in 37818:
Never married: 21.5%
Now married: 54.0%
Separated: 2.5%
Widowed: 7.6%
Divorced: 14.4%
Zip code 37818 compared to state average:
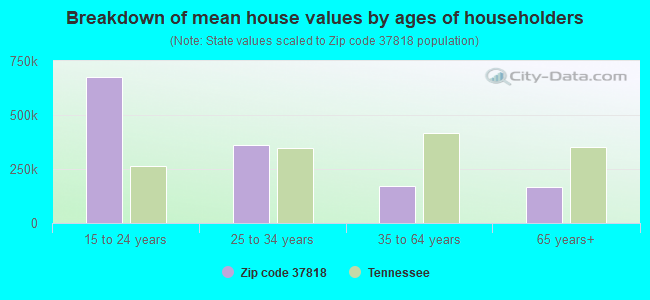
Median house value below state average.
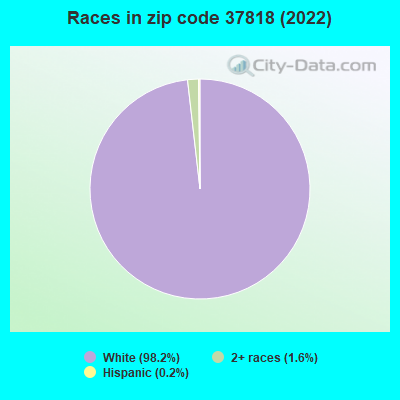
Black race population percentage significantly below state average.
Hispanic race population percentage significantly below state average.
Median age significantly above state average.
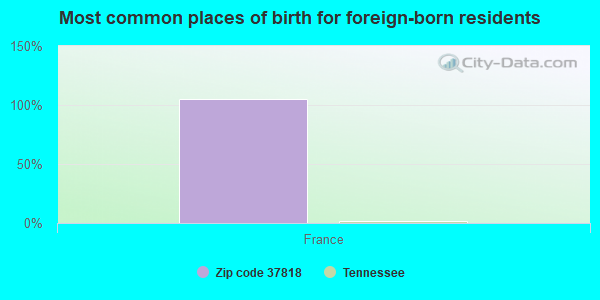
Foreign-born population percentage significantly below state average.
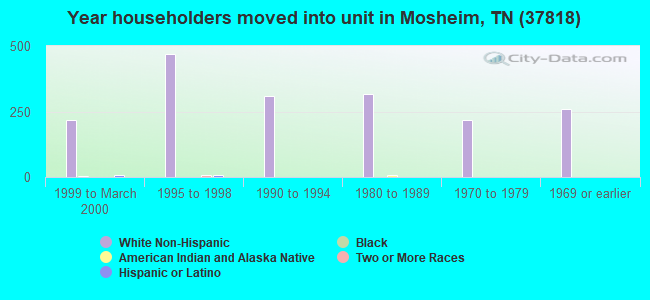
Length of stay since moving in significantly above state average.
Number of college students below state average.
Percentage of population with a bachelor's degree or higher significantly below state average.
Estimated median house/condo value in 2022: $149,333
37818:
$149,333
Tennessee:
$284,800
According to our research of Tennessee and other state lists, there were 8 registered sex offenders living in 37818 zip code as of April 27, 2024. The ratio of all residents to sex offenders in zip code 37818 is 715 to 1. The ratio of registered sex offenders to all residents in this zip code is lower than the state average.
Median resident age:
This zip code:
48.6 years
Tennessee median age:
39.2 years
Average household size:
This zip code:
2.5 people
Tennessee:
2.4 people
Averages for the 2020 tax year for zip code 37818, filed in 2021:
Average Adjusted Gross Income (AGI) in 2020: $43,006 (Individual Income Tax Returns)
Here:
$43,006
State:
$69,014
Salary/wage: $39,252 (reported on 83.7% of returns)
Here:
$39,252
State:
$55,872
(% of AGI for various income ranges: 1118.1% for AGIs below $25k, 3421.4% for AGIs $25k-50k, 5807.0% for AGIs $50k-75k, 8350.7% for AGIs $75k-100k, 17245.5% for AGIs $100k-200k)
Taxable interest for individuals: $556 (reported on 26.2% of returns)
This zip code:
$556
Tennessee:
$1,945
(% of AGI for various income ranges: 9.1% for AGIs below $25k, 15.4% for AGIs $25k-50k, 11.7% for AGIs $50k-75k, 33.6% for AGIs $75k-100k, 90.0% for AGIs $100k-200k)
Ordinary dividends: $1,694 (reported on 7.3% of returns)
Here:
$1,694
State:
$8,105
(% of AGI for various income ranges: 5.5% for AGIs below $25k, 12.7% for AGIs $25k-50k, 12.7% for AGIs $50k-75k, 22.9% for AGIs $75k-100k, 92.7% for AGIs $100k-200k)
Net capital gain/loss in AGI: +$6,994 (reported on 7.7% of returns)
Here:
+$6,994
State:
+$33,664
(% of AGI for various income ranges: 17.8% for AGIs $25k-50k, 12.0% for AGIs $50k-75k, 39.3% for AGIs $75k-100k, 972.7% for AGIs $100k-200k)
Profit/loss from business: +$7,735 (reported on 14.6% of returns)
Here:
+$7,735
State:
+$18,991
(% of AGI for various income ranges: 121.8% for AGIs below $25k, 108.1% for AGIs $25k-50k, 38.3% for AGIs $50k-75k, 277.9% for AGIs $75k-100k, 533.6% for AGIs $100k-200k)
Taxable individual retirement arrangement distribution: $13,638 (reported on 5.6% of returns)
37818:
$13,638
Tennessee:
$20,036
(% of AGI for various income ranges: 31.1% for AGIs below $25k, 89.7% for AGIs $25k-50k, 240.7% for AGIs $75k-100k, 615.5% for AGIs $100k-200k)
Total itemized deductions: $27,900 (reported on 1.3% of returns)
Here:
$27,900
State:
$40,136
(% of AGI for various income ranges: 141.9% for AGIs $25k-50k)
Taxes paid: $4,700 (reported on 1.3% of returns)
37818:
$4,700
State:
$6,038
(% of AGI for various income ranges: 23.9% for AGIs $25k-50k)
Earned income credit: $2,133 (reported on 23.6% of returns)
Here:
$2,133
State:
$2,391
(% of AGI for various income ranges: 100.5% for AGIs below $25k, 72.7% for AGIs $25k-50k)
Percentage of individuals using paid preparers for their 2020 taxes: 95.3%
Here:
95%
State:
93%
(% for various income ranges: 95.7% for AGIs below $25k, 94.3% for AGIs $25k-50k, 97.1% for AGIs $50k-75k, 94.4% for AGIs $75k-100k, 106.2% for AGIs $100k-200k, 0.0% for AGIs over 200k)
Averages for the 2012 tax year for zip code 37818, filed in 2013:
Average Adjusted Gross Income (AGI) in 2012: $33,472 (Individual Income Tax Returns)
Here:
$33,472
State:
$53,767
Salary/wage: $31,711 (reported on 86.3% of returns)
Here:
$31,711
State:
$45,421
(% of AGI for various income ranges: 79.2% for AGIs below $25k, 84.2% for AGIs $25k-50k, 84.6% for AGIs $50k-75k, 77.5% for AGIs $75k-100k, 79.4% for AGIs $100k-200k)
Taxable interest for individuals: $805 (reported on 25.9% of returns)
This zip code:
$805
Tennessee:
$1,732
(% of AGI for various income ranges: 1.0% for AGIs below $25k, 0.4% for AGIs $25k-50k, 0.4% for AGIs $50k-75k, 1.2% for AGIs $75k-100k, 0.4% for AGIs $100k-200k)
Ordinary dividends: $1,312 (reported on 8.0% of returns)
Here:
$1,312
State:
$6,739
(% of AGI for various income ranges: 0.6% for AGIs below $25k, 0.5% for AGIs $25k-50k, 0.1% for AGIs $50k-75k, 0.2% for AGIs $75k-100k)
Net capital gain/loss in AGI: +$1,526 (reported on 9.0% of returns)
Here:
+$1,526
State:
+$19,082
(% of AGI for various income ranges: 0.2% for AGIs below $25k, 0.6% for AGIs $25k-50k, 0.4% for AGIs $50k-75k, 0.6% for AGIs $75k-100k)
Profit/loss from business: +$5,962 (reported on 15.1% of returns)
Here:
+$5,962
State:
+$15,240
(% of AGI for various income ranges: 7.3% for AGIs below $25k, 2.7% for AGIs $25k-50k, 1.2% for AGIs $50k-75k, 1.3% for AGIs $75k-100k)
Taxable individual retirement arrangement distribution: $8,415 (reported on 6.1% of returns)
37818:
$8,415
Tennessee:
$15,505
(% of AGI for various income ranges: 1.6% for AGIs below $25k, 1.1% for AGIs $25k-50k, 1.2% for AGIs $50k-75k, 4.2% for AGIs $75k-100k)
Total itemized deductions: $18,348 (29% of AGI, reported on 10.8% of returns)
Here:
$18,348
State:
$21,976
Here:
29.1% of AGI
State:
17.8% of AGI
(% of AGI for various income ranges: 4.0% for AGIs below $25k, 4.8% for AGIs $25k-50k, 6.4% for AGIs $50k-75k, 7.7% for AGIs $75k-100k, 8.9% for AGIs $100k-200k)
Charity contributions: $5,564 (reported on 6.6% of returns)
Here:
$5,564
State:
$6,709
(% of AGI for various income ranges: 0.6% for AGIs $25k-50k, 1.4% for AGIs $50k-75k, 1.9% for AGIs $75k-100k, 2.5% for AGIs $100k-200k)
Taxes paid: $2,700 (reported on 10.8% of returns)
37818:
$2,700
State:
$4,829
(% of AGI for various income ranges: 0.3% for AGIs below $25k, 0.7% for AGIs $25k-50k, 1.0% for AGIs $50k-75k, 1.2% for AGIs $75k-100k, 1.6% for AGIs $100k-200k)
Earned income credit: $2,238 (reported on 28.8% of returns)
Here:
$2,238
State:
$2,404
(% of AGI for various income ranges: 8.1% for AGIs below $25k, 1.3% for AGIs $25k-50k)
Percentage of individuals using paid preparers for their 2012 taxes: 64.6%
Here:
65%
State:
52%
(% for various income ranges: 62.3% for AGIs below $25k, 68.9% for AGIs $25k-50k, 63.0% for AGIs $50k-75k, 66.7% for AGIs $75k-100k, 66.7% for AGIs $100k-200k)
Averages for the 2004 tax year for zip code 37818, filed in 2005:
Average Adjusted Gross Income (AGI) in 2004: $29,206 (Individual Income Tax Returns)
Here:
$29,206
State:
$44,088
Salary/wage: $28,915 (reported on 89.3% of returns)
Here:
$28,915
State:
$38,825
(% of AGI for various income ranges: 107.1% for AGIs below $10k, 83.7% for AGIs $10k-25k, 92.1% for AGIs $25k-50k, 89.8% for AGIs $50k-75k, 87.6% for AGIs $75k-100k, 65.3% for AGIs over 100k)
Taxable interest for individuals: $956 (reported on 30.5% of returns)
This zip code:
$956
Tennessee:
$1,802
(% of AGI for various income ranges: 2.3% for AGIs below $10k, 1.6% for AGIs $10k-25k, 0.7% for AGIs $25k-50k, 0.5% for AGIs $50k-75k, 1.3% for AGIs $75k-100k, 2.3% for AGIs over 100k)
Taxable dividends: $714 (reported on 9.9% of returns)
Here:
$714
State:
$3,727
(% of AGI for various income ranges: 1.0% for AGIs below $10k, 0.5% for AGIs $10k-25k, 0.1% for AGIs $25k-50k, 0.2% for AGIs $50k-75k, 0.1% for AGIs $75k-100k, 0.2% for AGIs over 100k)
Net capital gain/loss: +$2,692 (reported on 6.0% of returns)
Here:
+$2,692
State:
+$15,776
(% of AGI for various income ranges: -0.2% for AGIs below $10k, 0.8% for AGIs $10k-25k, 0.3% for AGIs $25k-50k, 0.3% for AGIs $50k-75k, 3.5% for AGIs over 100k)
Profit/loss from business: +$3,991 (reported on 15.2% of returns)
Here:
+$3,991
State:
+$12,882
(% of AGI for various income ranges: 8.6% for AGIs below $10k, 4.3% for AGIs $10k-25k, 1.1% for AGIs $25k-50k, 2.1% for AGIs $50k-75k, 0.3% for AGIs $75k-100k)
IRA payment deduction: $2,308 (reported on 1.2% of returns)
37818:
$2,308
Tennessee:
$2,934
Total itemized deductions: $14,947 (28% of AGI, reported on 10.2% of returns)
Here:
$14,947
State:
$18,035
Here:
28.0% of AGI
State:
19.9% of AGI
(% of AGI for various income ranges: 2.7% for AGIs $10k-25k, 4.8% for AGIs $25k-50k, 6.1% for AGIs $50k-75k, 7.5% for AGIs $75k-100k, 11.9% for AGIs over 100k)
Charity contributions deductions: $3,601 (7% of AGI, reported on 7.3% of returns)
Here:
$3,601
State:
$5,167
Here:
6.6% of AGI
State:
5.3% of AGI
(% of AGI for various income ranges: 0.5% for AGIs $10k-25k, 0.5% for AGIs $25k-50k, 1.1% for AGIs $50k-75k, 1.2% for AGIs $75k-100k, 4.0% for AGIs over 100k)
Total tax: $2,870 (reported on 71.7% of returns)
37818:
$2,870
State:
$7,482
(% of AGI for various income ranges: 3.7% for AGIs below $10k, 3.9% for AGIs $10k-25k, 5.9% for AGIs $25k-50k, 8.4% for AGIs $50k-75k, 10.5% for AGIs $75k-100k, 15.7% for AGIs over 100k)
Earned income credit: $1,702 (reported on 24.1% of returns)
Here:
$1,702
State:
$1,826
Percentage of individuals using paid preparers for their 2004 taxes: 68.3%
Here:
68%
State:
60%
(% for various income ranges: 63.1% for AGIs below $10k, 69.9% for AGIs $10k-25k, 70.3% for AGIs $25k-50k, 68.1% for AGIs $50k-75k, 60.6% for AGIs $75k-100k, 84.0% for AGIs over 100k)
Household received Food Stamps/SNAP in the past 12 months: 272 Household did not receive Food Stamps/SNAP in the past 12 months: 1,879
Women who had a birth in the past 12 months: 51 (22 now married, 28 unmarried) Women who did not have a birth in the past 12 months: 889 (486 now married, 403 unmarried)
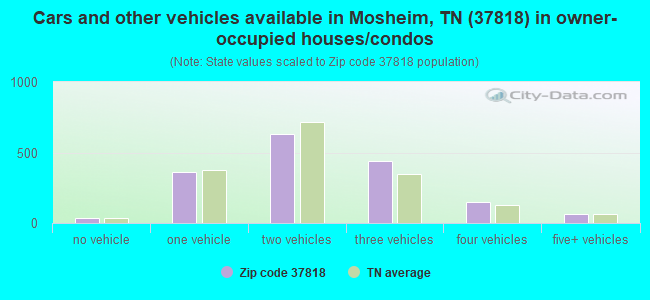
Housing units in zip code 37818 with a mortgage: 764 (8 second mortgage, 8 both second mortgage and home equity loan) Houses without a mortgage: 19
Median monthly owner costs for units with a mortgage: $997 Median monthly owner costs for units without a mortgage: $301
Residents with income below the poverty level in 2022:
This zip code:
15.2%
Whole state:
13.3%
Residents with income below 50% of the poverty level in 2022:
This zip code:
9.2%
Whole state:
7.1%
Median number of rooms in houses and condos:
Here:
5.8
State:
6.5
Median number of rooms in apartments:
Here:
5.0
State:
4.4
Notable locations in this zip code not listed on our city pages
Notable locations in zip code 37818: Town of Mosheim Fire Department (A), Orebank Volunteer Fire Department (B), Mosheim Volunteer Fire Department (C). Display/hide their locations on the map
Churches in zip code 37818 include: Sinai Church (A), Jackson Chapel (B), Harmon Valley Church (C), Hartman Church (D), Weems Chapel (E), Big Spring Church (F), Brown Springs Church (G). Display/hide their locations on the map
Streams, rivers, and creeks: Lick Slough (A), Lick Branch (B), Hartman Branch (C), Stony Creek (D), Gap Creek (E), Dulaney Branch (F), Cuerton Dial Branch (G), Pigeon Creek (H), Babb Creek (I). Display/hide their locations on the map
In group quarters: 4 (-1 institutionalized population)
Size of family households: 818 2-persons, 257 3-persons, 372 4-persons, 79 5-persons, 53 6-persons, 12 7-or-more-persons
Size of nonfamily households: 525 1-person, 21 2-persons, 4 3-persons
522 married couples with children.
269 single-parent households (128 men, 141 women).
99.1% of residents of 37818 zip code speak English at home.
0.3% of residents speak Spanish at home (100% very well).
0.4% of residents speak other Indo-European language at home (100% very well).
Foreign born population: 19 (0.4%) (0.0% of them are naturalized citizens)
:
0.4%
Whole state:
5.6%
105%France
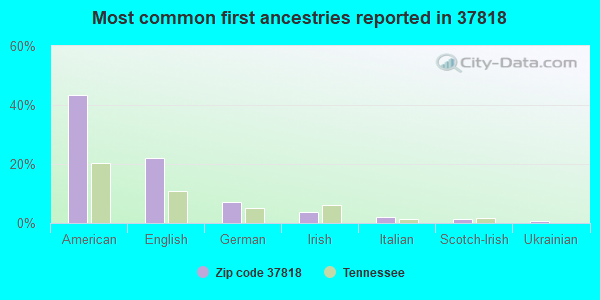
44%American
22%English
7%German
4%Irish
2%Italian
1%Scotch-Irish
1%Ukrainian
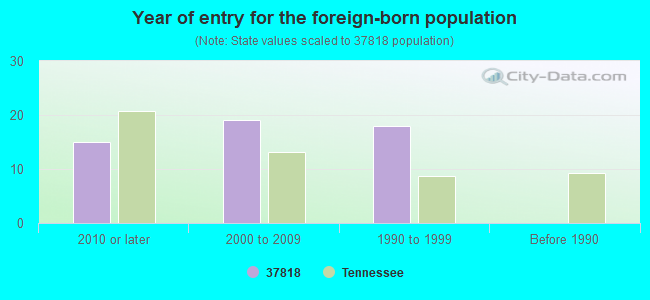
Year of entry for the foreign-born population
152010 or later
192000 to 2009
181990 to 1999
0Before 1990
Facilities with environmental interests located in this zip code:
APPALACHIAN FOREST PRODUCTS LLC (125 SOUTH SPRING STREET in MOSHEIM, TN)
AIR MINOR (AIRS/AFS) HAZARDOUS WASTE BIENNIAL REPORTER (Resource Conservation and Recovery Act (tracking hazardous waste)) Small Quantity Generators, between 100 kg and 1000 kg of hazardous waste/month (Resource Conservation and Recovery Act (tracking hazardous waste)) - notification TSD (Resource Conservation and Recovery Act (tracking hazardous waste)) TRI REPORTER (Tracking of toxic chemicals releasing facilities) Business SIC classification: WOOD PRESERVING Business NAICS classification: WOOD PRESERVATION. Organizations: COURTNEY K. HUTCHERSON (CONTACT/OPERATOR)
, APPALACHIAN FOREST PRODUCTS, LLC (CONTACT/OWNER)
Alternative names: CHEROKEE WOOD PRESERVERS, CHEROKEE WOOD PRESERVING
Housing units lacking complete plumbing facilities: 7.9% Housing units lacking complete kitchen facilities: 7.2%
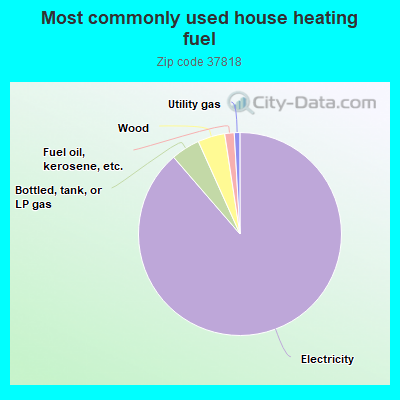
88.4%Electricity
4.6%Bottled, tank, or LP gas
4.3%Wood
1.5%Fuel oil, kerosene, etc.
0.9%Utility gas
Population in 1990: 4,337. Population change in the 1990s: +240 (+5.5%).
Place of birth for U.S.-born residents:
This state: 3,801
Northeast: 407
Midwest: 273
South: 676
West: 71
68% of the 37818 zip code residents lived in the same house 5 years ago. Out of people who lived in different houses, 69% lived in this county. Out of people who lived in different counties, 50% lived in Tennessee.
97% of the 37818 zip code residents lived in the same house 1 year ago. Out of people who lived in different houses, 50% moved from this county. Out of people who lived in different houses, 45% moved from different county within same state. Out of people who lived in different houses, 21% moved from different state. Out of people who lived in different houses, 1% moved from abroad.
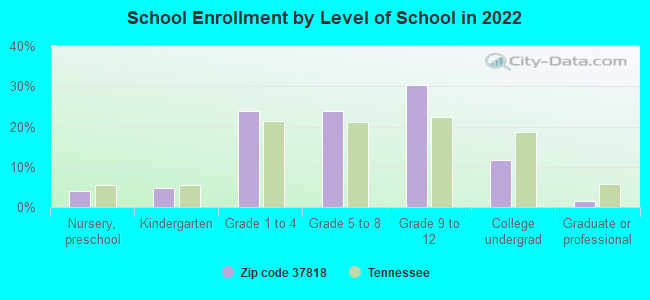
Private vs. public school enrollment:
Students in private schools in grades 1 to 8 (elementary and middle school):
Here:
0.0%
Tennessee:
15.0%
Students in private schools in grades 9 to 12 (high school): 57
Here:
21.6%
Tennessee:
16.2%
Students in private undergraduate colleges: 2
Here:
2.8%
Tennessee:
23.5%
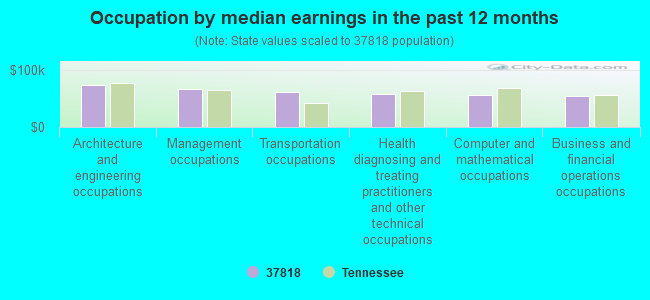
Occupation by median earnings in the past 12 months ($)
74,212Architecture and engineering occupations
66,376Management occupations
61,258Transportation occupations
58,953Health diagnosing and treating practitioners and other technical occupations
56,877Computer and mathematical occupations
55,401Business and financial operations occupations
Top industries in this zip code by the number of employees in 2005:
Accommodation and Food Services: Full-Service Restaurants (10-19: 2, 1-4: 1)
Accommodation and Food Services: Limited-Service Restaurants (10-19: 2)
Finance and Insurance: Commercial Banking (5-9: 2)
People in group quarters in 2010:
12 people in residential treatment centers for adults
2 people in group homes intended for adults
Fatal accident statistics in 2014:
Fatal accident count: 4
Vehicles involved in fatal accidents: 7
Fatal accidents caused by drunken drivers: 1
Fatalities: 4
Persons involved in fatal accidents: 9
Pedestrians involved in fatal accidents: 0
Fatal accident statistics in 2013:
Fatal accident count: 1
Vehicles involved in fatal accidents: 1
Fatal accidents caused by drunken drivers: 0
Fatalities: 1
Persons involved in fatal accidents: 1
Pedestrians involved in fatal accidents: 0
2002 - 2018 National Fire Incident Reporting System (NFIRS) incidents
Based on the data from the years 2002 - 2018 the average number of fires per year is 48. The highest number of reported fires - 102 took place in 2007, and the least - 13 in 2003. The data has a rising trend.
When looking into fire subcategories, the most incidents belonged to: Structure Fires (37.8%), and Outside Fires (36.4%).
Fire incident types reported to NFIRS in Zip Code 37818
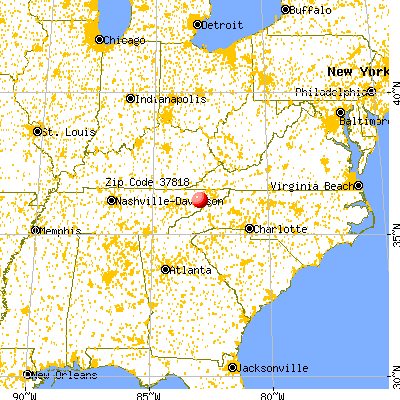


 Nearest zip codes: 37809, 37711, 37810, 37743, 37745, 37843.


 Based on the data from the years 2002 - 2018 the average number of fires per year is 48. The highest number of reported fires - 102 took place in 2007, and the least - 13 in 2003. The data has a rising trend.
 When looking into fire subcategories, the most incidents belonged to: Structure Fires (37.8%), and Outside Fires (36.4%).