Estimated zip code population in 2022: 29,556
Zip code population in 2010: 25,459
Zip code population in 2000: 21,609
Houses and condos: 11,576
Renter-occupied apartments: 2,200
% of renters here:
19%State:
33%
March 2022 cost of living index in zip code 37849: 85.5
(less than average, U.S. average is 100)
Land area: 39.4
sq. mi.
Water area: 0.1
sq. mi.
Population density: 750 people per square mile (low).
OSM Map
General Map
Google Map
MSN Map
OSM Map
General Map
Google Map
MSN Map
OSM Map
General Map
Google Map
MSN Map
OSM Map
General Map
Google Map
MSN Map
Please wait while loading the map...
Real estate property taxes paid for housing units in 2022:
This zip code:
0.4% ($1,114)Tennessee:
0.5% ($1,376)
Median real estate property taxes paid for housing units with mortgages in 2022: $1,202 (0.4%)
Median real estate property taxes paid for housing units with no mortgage in 2022: $988 (0.4%)
Profiles of local businesses
Business Search - 14 Million verified businesses
Males: 13,962 Females: 15,594
For population 25 years and over in 37849:
High school or higher: 93.6%Bachelor's degree or higher: 29.4%Graduate or professional degree: 9.3%Unemployed: 2.8%Mean travel time to work (commute): 25.1 minutes
For population 15 years and over in 37849:
Never married: 26.9%Now married: 54.7%Separated: 1.4%Widowed: 6.1%Divorced: 10.8%
Zip code 37849 compared to state average:
Black race population percentage significantly below state average. Foreign-born population percentage below state average. Renting percentage below state average. Length of stay since moving in significantly above state average. 26,985 91.3% White 1,313 4.4% Hispanic or Latino 578 2.0% Black 511 1.7% Two or more races 83 0.3% Asian 50 0.2% American Indian 33 0.1% Some other race
Data:
Median household income ($)
Median household income (% change since 2000)
Household income diversity
Ratio of average income to average house value (%)
Ratio of average income to average rent
Median household income ($) - White
Median household income ($) - Black or African American
Median household income ($) - Asian
Median household income ($) - Hispanic or Latino
Median household income ($) - American Indian and Alaska Native
Median household income ($) - Multirace
Median household income ($) - Other Race
Median household income for houses/condos with a mortgage ($)
Median household income for apartments without a mortgage ($)
Races - White alone (%)
Races - White alone (% change since 2000)
Races - Black alone (%)
Races - Black alone (% change since 2000)
Races - American Indian alone (%)
Races - American Indian alone (% change since 2000)
Races - Asian alone (%)
Races - Asian alone (% change since 2000)
Races - Hispanic (%)
Races - Hispanic (% change since 2000)
Races - Native Hawaiian and Other Pacific Islander alone (%)
Races - Native Hawaiian and Other Pacific Islander alone (% change since 2000)
Races - Two or more races (%)
Races - Two or more races (% change since 2000)
Races - Other race alone (%)
Races - Other race alone (% change since 2000)
Racial diversity
Unemployment (%)
Unemployment (% change since 2000)
Unemployment (%) - White
Unemployment (%) - Black or African American
Unemployment (%) - Asian
Unemployment (%) - Hispanic or Latino
Unemployment (%) - American Indian and Alaska Native
Unemployment (%) - Multirace
Unemployment (%) - Other Race
Population density (people per square mile)
Population - Males (%)
Population - Females (%)
Population - Males (%) - White
Population - Males (%) - Black or African American
Population - Males (%) - Asian
Population - Males (%) - Hispanic or Latino
Population - Males (%) - American Indian and Alaska Native
Population - Males (%) - Multirace
Population - Males (%) - Other Race
Population - Females (%) - White
Population - Females (%) - Black or African American
Population - Females (%) - Asian
Population - Females (%) - Hispanic or Latino
Population - Females (%) - American Indian and Alaska Native
Population - Females (%) - Multirace
Population - Females (%) - Other Race
Coronavirus confirmed cases (Apr 27, 2024)
Deaths caused by coronavirus (Apr 27, 2024)
Coronavirus confirmed cases (per 100k population) (Apr 27, 2024)
Deaths caused by coronavirus (per 100k population) (Apr 27, 2024)
Daily increase in number of cases (Apr 27, 2024)
Weekly increase in number of cases (Apr 27, 2024)
Cases doubled (in days) (Apr 27, 2024)
Hospitalized patients (Apr 18, 2022)
Negative test results (Apr 18, 2022)
Total test results (Apr 18, 2022)
COVID Vaccine doses distributed (per 100k population) (Sep 19, 2023)
COVID Vaccine doses administered (per 100k population) (Sep 19, 2023)
COVID Vaccine doses distributed (Sep 19, 2023)
COVID Vaccine doses administered (Sep 19, 2023)
Likely homosexual households (%)
Likely homosexual households (% change since 2000)
Likely homosexual households - Lesbian couples (%)
Likely homosexual households - Lesbian couples (% change since 2000)
Likely homosexual households - Gay men (%)
Likely homosexual households - Gay men (% change since 2000)
Cost of living index
Median gross rent ($)
Median contract rent ($)
Median monthly housing costs ($)
Median house or condo value ($)
Median house or condo value ($ change since 2000)
Mean house or condo value by units in structure - 1, detached ($)
Mean house or condo value by units in structure - 1, attached ($)
Mean house or condo value by units in structure - 2 ($)
Mean house or condo value by units in structure by units in structure - 3 or 4 ($)
Mean house or condo value by units in structure - 5 or more ($)
Mean house or condo value by units in structure - Boat, RV, van, etc. ($)
Mean house or condo value by units in structure - Mobile home ($)
Median house or condo value ($) - White
Median house or condo value ($) - Black or African American
Median house or condo value ($) - Asian
Median house or condo value ($) - Hispanic or Latino
Median house or condo value ($) - American Indian and Alaska Native
Median house or condo value ($) - Multirace
Median house or condo value ($) - Other Race
Median resident age
Resident age diversity
Median resident age - Males
Median resident age - Females
Median resident age - White
Median resident age - Black or African American
Median resident age - Asian
Median resident age - Hispanic or Latino
Median resident age - American Indian and Alaska Native
Median resident age - Multirace
Median resident age - Other Race
Median resident age - Males - White
Median resident age - Males - Black or African American
Median resident age - Males - Asian
Median resident age - Males - Hispanic or Latino
Median resident age - Males - American Indian and Alaska Native
Median resident age - Males - Multirace
Median resident age - Males - Other Race
Median resident age - Females - White
Median resident age - Females - Black or African American
Median resident age - Females - Asian
Median resident age - Females - Hispanic or Latino
Median resident age - Females - American Indian and Alaska Native
Median resident age - Females - Multirace
Median resident age - Females - Other Race
Commute - mean travel time to work (minutes)
Travel time to work - Less than 5 minutes (%)
Travel time to work - Less than 5 minutes (% change since 2000)
Travel time to work - 5 to 9 minutes (%)
Travel time to work - 5 to 9 minutes (% change since 2000)
Travel time to work - 10 to 19 minutes (%)
Travel time to work - 10 to 19 minutes (% change since 2000)
Travel time to work - 20 to 29 minutes (%)
Travel time to work - 20 to 29 minutes (% change since 2000)
Travel time to work - 30 to 39 minutes (%)
Travel time to work - 30 to 39 minutes (% change since 2000)
Travel time to work - 40 to 59 minutes (%)
Travel time to work - 40 to 59 minutes (% change since 2000)
Travel time to work - 60 to 89 minutes (%)
Travel time to work - 60 to 89 minutes (% change since 2000)
Travel time to work - 90 or more minutes (%)
Travel time to work - 90 or more minutes (% change since 2000)
Marital status - Never married (%)
Marital status - Now married (%)
Marital status - Separated (%)
Marital status - Widowed (%)
Marital status - Divorced (%)
Median family income ($)
Median family income (% change since 2000)
Median non-family income ($)
Median non-family income (% change since 2000)
Median per capita income ($)
Median per capita income (% change since 2000)
Median family income ($) - White
Median family income ($) - Black or African American
Median family income ($) - Asian
Median family income ($) - Hispanic or Latino
Median family income ($) - American Indian and Alaska Native
Median family income ($) - Multirace
Median family income ($) - Other Race
Median year house/condo built
Median year apartment built
Year house built - Built 2005 or later (%)
Year house built - Built 2000 to 2004 (%)
Year house built - Built 1990 to 1999 (%)
Year house built - Built 1980 to 1989 (%)
Year house built - Built 1970 to 1979 (%)
Year house built - Built 1960 to 1969 (%)
Year house built - Built 1950 to 1959 (%)
Year house built - Built 1940 to 1949 (%)
Year house built - Built 1939 or earlier (%)
Average household size
Household density (households per square mile)
Average household size - White
Average household size - Black or African American
Average household size - Asian
Average household size - Hispanic or Latino
Average household size - American Indian and Alaska Native
Average household size - Multirace
Average household size - Other Race
Occupied housing units (%)
Vacant housing units (%)
Owner occupied housing units (%)
Renter occupied housing units (%)
Vacancy status - For rent (%)
Vacancy status - For sale only (%)
Vacancy status - Rented or sold, not occupied (%)
Vacancy status - For seasonal, recreational, or occasional use (%)
Vacancy status - For migrant workers (%)
Vacancy status - Other vacant (%)
Residents with income below the poverty level (%)
Residents with income below 50% of the poverty level (%)
Children below poverty level (%)
Poor families by family type - Married-couple family (%)
Poor families by family type - Male, no wife present (%)
Poor families by family type - Female, no husband present (%)
Poverty status for native-born residents (%)
Poverty status for foreign-born residents (%)
Poverty among high school graduates not in families (%)
Poverty among people who did not graduate high school not in families (%)
Residents with income below the poverty level (%) - White
Residents with income below the poverty level (%) - Black or African American
Residents with income below the poverty level (%) - Asian
Residents with income below the poverty level (%) - Hispanic or Latino
Residents with income below the poverty level (%) - American Indian and Alaska Native
Residents with income below the poverty level (%) - Multirace
Residents with income below the poverty level (%) - Other Race
Air pollution - Air Quality Index (AQI)
Air pollution - CO
Air pollution - NO2
Air pollution - SO2
Air pollution - Ozone
Air pollution - PM10
Air pollution - PM25
Air pollution - Pb
Crime - Murders per 100,000 population
Crime - Rapes per 100,000 population
Crime - Robberies per 100,000 population
Crime - Assaults per 100,000 population
Crime - Burglaries per 100,000 population
Crime - Thefts per 100,000 population
Crime - Auto thefts per 100,000 population
Crime - Arson per 100,000 population
Crime - City-data.com crime index
Crime - Violent crime index
Crime - Property crime index
Crime - Murders per 100,000 population (5 year average)
Crime - Rapes per 100,000 population (5 year average)
Crime - Robberies per 100,000 population (5 year average)
Crime - Assaults per 100,000 population (5 year average)
Crime - Burglaries per 100,000 population (5 year average)
Crime - Thefts per 100,000 population (5 year average)
Crime - Auto thefts per 100,000 population (5 year average)
Crime - Arson per 100,000 population (5 year average)
Crime - City-data.com crime index (5 year average)
Crime - Violent crime index (5 year average)
Crime - Property crime index (5 year average)
1996 Presidential Elections Results (%) - Democratic Party (Clinton)
1996 Presidential Elections Results (%) - Republican Party (Dole)
1996 Presidential Elections Results (%) - Other
2000 Presidential Elections Results (%) - Democratic Party (Gore)
2000 Presidential Elections Results (%) - Republican Party (Bush)
2000 Presidential Elections Results (%) - Other
2004 Presidential Elections Results (%) - Democratic Party (Kerry)
2004 Presidential Elections Results (%) - Republican Party (Bush)
2004 Presidential Elections Results (%) - Other
2008 Presidential Elections Results (%) - Democratic Party (Obama)
2008 Presidential Elections Results (%) - Republican Party (McCain)
2008 Presidential Elections Results (%) - Other
2012 Presidential Elections Results (%) - Democratic Party (Obama)
2012 Presidential Elections Results (%) - Republican Party (Romney)
2012 Presidential Elections Results (%) - Other
2016 Presidential Elections Results (%) - Democratic Party (Clinton)
2016 Presidential Elections Results (%) - Republican Party (Trump)
2016 Presidential Elections Results (%) - Other
2020 Presidential Elections Results (%) - Democratic Party (Biden)
2020 Presidential Elections Results (%) - Republican Party (Trump)
2020 Presidential Elections Results (%) - Other
Ancestries Reported - Arab (%)
Ancestries Reported - Czech (%)
Ancestries Reported - Danish (%)
Ancestries Reported - Dutch (%)
Ancestries Reported - English (%)
Ancestries Reported - French (%)
Ancestries Reported - French Canadian (%)
Ancestries Reported - German (%)
Ancestries Reported - Greek (%)
Ancestries Reported - Hungarian (%)
Ancestries Reported - Irish (%)
Ancestries Reported - Italian (%)
Ancestries Reported - Lithuanian (%)
Ancestries Reported - Norwegian (%)
Ancestries Reported - Polish (%)
Ancestries Reported - Portuguese (%)
Ancestries Reported - Russian (%)
Ancestries Reported - Scotch-Irish (%)
Ancestries Reported - Scottish (%)
Ancestries Reported - Slovak (%)
Ancestries Reported - Subsaharan African (%)
Ancestries Reported - Swedish (%)
Ancestries Reported - Swiss (%)
Ancestries Reported - Ukrainian (%)
Ancestries Reported - United States (%)
Ancestries Reported - Welsh (%)
Ancestries Reported - West Indian (%)
Ancestries Reported - Other (%)
Educational Attainment - No schooling completed (%)
Educational Attainment - Less than high school (%)
Educational Attainment - High school or equivalent (%)
Educational Attainment - Less than 1 year of college (%)
Educational Attainment - 1 or more years of college (%)
Educational Attainment - Associate degree (%)
Educational Attainment - Bachelor's degree (%)
Educational Attainment - Master's degree (%)
Educational Attainment - Professional school degree (%)
Educational Attainment - Doctorate degree (%)
School Enrollment - Nursery, preschool (%)
School Enrollment - Kindergarten (%)
School Enrollment - Grade 1 to 4 (%)
School Enrollment - Grade 5 to 8 (%)
School Enrollment - Grade 9 to 12 (%)
School Enrollment - College undergrad (%)
School Enrollment - Graduate or professional (%)
School Enrollment - Not enrolled in school (%)
School enrollment - Public schools (%)
School enrollment - Private schools (%)
School enrollment - Not enrolled (%)
Median number of rooms in houses and condos
Median number of rooms in apartments
Housing units lacking complete plumbing facilities (%)
Housing units lacking complete kitchen facilities (%)
Density of houses
Urban houses (%)
Rural houses (%)
Households with people 60 years and over (%)
Households with people 65 years and over (%)
Households with people 75 years and over (%)
Households with one or more nonrelatives (%)
Households with no nonrelatives (%)
Population in households (%)
Family households (%)
Nonfamily households (%)
Population in families (%)
Family households with own children (%)
Median number of bedrooms in owner occupied houses
Mean number of bedrooms in owner occupied houses
Median number of bedrooms in renter occupied houses
Mean number of bedrooms in renter occupied houses
Median number of vehichles in owner occupied houses
Mean number of vehichles in owner occupied houses
Median number of vehichles in renter occupied houses
Mean number of vehichles in renter occupied houses
Mortgage status - with mortgage (%)
Mortgage status - with second mortgage (%)
Mortgage status - with home equity loan (%)
Mortgage status - with both second mortgage and home equity loan (%)
Mortgage status - without a mortgage (%)
Average family size
Average family size - White
Average family size - Black or African American
Average family size - Asian
Average family size - Hispanic or Latino
Average family size - American Indian and Alaska Native
Average family size - Multirace
Average family size - Other Race
Geographical mobility - Same house 1 year ago (%)
Geographical mobility - Moved within same county (%)
Geographical mobility - Moved from different county within same state (%)
Geographical mobility - Moved from different state (%)
Geographical mobility - Moved from abroad (%)
Place of birth - Born in state of residence (%)
Place of birth - Born in other state (%)
Place of birth - Native, outside of US (%)
Place of birth - Foreign born (%)
Housing units in structures - 1, detached (%)
Housing units in structures - 1, attached (%)
Housing units in structures - 2 (%)
Housing units in structures - 3 or 4 (%)
Housing units in structures - 5 to 9 (%)
Housing units in structures - 10 to 19 (%)
Housing units in structures - 20 to 49 (%)
Housing units in structures - 50 or more (%)
Housing units in structures - Mobile home (%)
Housing units in structures - Boat, RV, van, etc. (%)
House/condo owner moved in on average (years ago)
Renter moved in on average (years ago)
Year householder moved into unit - Moved in 1999 to March 2000 (%)
Year householder moved into unit - Moved in 1995 to 1998 (%)
Year householder moved into unit - Moved in 1990 to 1994 (%)
Year householder moved into unit - Moved in 1980 to 1989 (%)
Year householder moved into unit - Moved in 1970 to 1979 (%)
Year householder moved into unit - Moved in 1969 or earlier (%)
Means of transportation to work - Drove car alone (%)
Means of transportation to work - Carpooled (%)
Means of transportation to work - Public transportation (%)
Means of transportation to work - Bus or trolley bus (%)
Means of transportation to work - Streetcar or trolley car (%)
Means of transportation to work - Subway or elevated (%)
Means of transportation to work - Railroad (%)
Means of transportation to work - Ferryboat (%)
Means of transportation to work - Taxicab (%)
Means of transportation to work - Motorcycle (%)
Means of transportation to work - Bicycle (%)
Means of transportation to work - Walked (%)
Means of transportation to work - Other means (%)
Working at home (%)
Industry diversity
Most Common Industries - Agriculture, forestry, fishing and hunting, and mining (%)
Most Common Industries - Agriculture, forestry, fishing and hunting (%)
Most Common Industries - Mining, quarrying, and oil and gas extraction (%)
Most Common Industries - Construction (%)
Most Common Industries - Manufacturing (%)
Most Common Industries - Wholesale trade (%)
Most Common Industries - Retail trade (%)
Most Common Industries - Transportation and warehousing, and utilities (%)
Most Common Industries - Transportation and warehousing (%)
Most Common Industries - Utilities (%)
Most Common Industries - Information (%)
Most Common Industries - Finance and insurance, and real estate and rental and leasing (%)
Most Common Industries - Finance and insurance (%)
Most Common Industries - Real estate and rental and leasing (%)
Most Common Industries - Professional, scientific, and management, and administrative and waste management services (%)
Most Common Industries - Professional, scientific, and technical services (%)
Most Common Industries - Management of companies and enterprises (%)
Most Common Industries - Administrative and support and waste management services (%)
Most Common Industries - Educational services, and health care and social assistance (%)
Most Common Industries - Educational services (%)
Most Common Industries - Health care and social assistance (%)
Most Common Industries - Arts, entertainment, and recreation, and accommodation and food services (%)
Most Common Industries - Arts, entertainment, and recreation (%)
Most Common Industries - Accommodation and food services (%)
Most Common Industries - Other services, except public administration (%)
Most Common Industries - Public administration (%)
Occupation diversity
Most Common Occupations - Management, business, science, and arts occupations (%)
Most Common Occupations - Management, business, and financial occupations (%)
Most Common Occupations - Management occupations (%)
Most Common Occupations - Business and financial operations occupations (%)
Most Common Occupations - Computer, engineering, and science occupations (%)
Most Common Occupations - Computer and mathematical occupations (%)
Most Common Occupations - Architecture and engineering occupations (%)
Most Common Occupations - Life, physical, and social science occupations (%)
Most Common Occupations - Education, legal, community service, arts, and media occupations (%)
Most Common Occupations - Community and social service occupations (%)
Most Common Occupations - Legal occupations (%)
Most Common Occupations - Education, training, and library occupations (%)
Most Common Occupations - Arts, design, entertainment, sports, and media occupations (%)
Most Common Occupations - Healthcare practitioners and technical occupations (%)
Most Common Occupations - Health diagnosing and treating practitioners and other technical occupations (%)
Most Common Occupations - Health technologists and technicians (%)
Most Common Occupations - Service occupations (%)
Most Common Occupations - Healthcare support occupations (%)
Most Common Occupations - Protective service occupations (%)
Most Common Occupations - Fire fighting and prevention, and other protective service workers including supervisors (%)
Most Common Occupations - Law enforcement workers including supervisors (%)
Most Common Occupations - Food preparation and serving related occupations (%)
Most Common Occupations - Building and grounds cleaning and maintenance occupations (%)
Most Common Occupations - Personal care and service occupations (%)
Most Common Occupations - Sales and office occupations (%)
Most Common Occupations - Sales and related occupations (%)
Most Common Occupations - Office and administrative support occupations (%)
Most Common Occupations - Natural resources, construction, and maintenance occupations (%)
Most Common Occupations - Farming, fishing, and forestry occupations (%)
Most Common Occupations - Construction and extraction occupations (%)
Most Common Occupations - Installation, maintenance, and repair occupations (%)
Most Common Occupations - Production, transportation, and material moving occupations (%)
Most Common Occupations - Production occupations (%)
Most Common Occupations - Transportation occupations (%)
Most Common Occupations - Material moving occupations (%)
People in Group quarters - Institutionalized population (%)
People in Group quarters - Correctional institutions (%)
People in Group quarters - Federal prisons and detention centers (%)
People in Group quarters - Halfway houses (%)
People in Group quarters - Local jails and other confinement facilities (including police lockups) (%)
People in Group quarters - Military disciplinary barracks (%)
People in Group quarters - State prisons (%)
People in Group quarters - Other types of correctional institutions (%)
People in Group quarters - Nursing homes (%)
People in Group quarters - Hospitals/wards, hospices, and schools for the handicapped (%)
People in Group quarters - Hospitals/wards and hospices for chronically ill (%)
People in Group quarters - Hospices or homes for chronically ill (%)
People in Group quarters - Military hospitals or wards for chronically ill (%)
People in Group quarters - Other hospitals or wards for chronically ill (%)
People in Group quarters - Hospitals or wards for drug/alcohol abuse (%)
People in Group quarters - Mental (Psychiatric) hospitals or wards (%)
People in Group quarters - Schools, hospitals, or wards for the mentally retarded (%)
People in Group quarters - Schools, hospitals, or wards for the physically handicapped (%)
People in Group quarters - Institutions for the deaf (%)
People in Group quarters - Institutions for the blind (%)
People in Group quarters - Orthopedic wards and institutions for the physically handicapped (%)
People in Group quarters - Wards in general hospitals for patients who have no usual home elsewhere (%)
People in Group quarters - Wards in military hospitals for patients who have no usual home elsewhere (%)
People in Group quarters - Juvenile institutions (%)
People in Group quarters - Long-term care (%)
People in Group quarters - Homes for abused, dependent, and neglected children (%)
People in Group quarters - Residential treatment centers for emotionally disturbed children (%)
People in Group quarters - Training schools for juvenile delinquents (%)
People in Group quarters - Short-term care, detention or diagnostic centers for delinquent children (%)
People in Group quarters - Type of juvenile institution unknown (%)
People in Group quarters - Noninstitutionalized population (%)
People in Group quarters - College dormitories (includes college quarters off campus) (%)
People in Group quarters - Military quarters (%)
People in Group quarters - On base (%)
People in Group quarters - Barracks, unaccompanied personnel housing (UPH), (Enlisted/Officer), ;and similar group living quarters for military personnel (%)
People in Group quarters - Transient quarters for temporary residents (%)
People in Group quarters - Military ships (%)
People in Group quarters - Group homes (%)
People in Group quarters - Homes or halfway houses for drug/alcohol abuse (%)
People in Group quarters - Homes for the mentally ill (%)
People in Group quarters - Homes for the mentally retarded (%)
People in Group quarters - Homes for the physically handicapped (%)
People in Group quarters - Other group homes (%)
People in Group quarters - Religious group quarters (%)
People in Group quarters - Dormitories (%)
People in Group quarters - Agriculture workers' dormitories on farms (%)
People in Group quarters - Job Corps and vocational training facilities (%)
People in Group quarters - Other workers' dormitories (%)
People in Group quarters - Crews of maritime vessels (%)
People in Group quarters - Other nonhousehold living situations (%)
People in Group quarters - Other noninstitutional group quarters (%)
Residents speaking English at home (%)
Residents speaking English at home - Born in the United States (%)
Residents speaking English at home - Native, born elsewhere (%)
Residents speaking English at home - Foreign born (%)
Residents speaking Spanish at home (%)
Residents speaking Spanish at home - Born in the United States (%)
Residents speaking Spanish at home - Native, born elsewhere (%)
Residents speaking Spanish at home - Foreign born (%)
Residents speaking other language at home (%)
Residents speaking other language at home - Born in the United States (%)
Residents speaking other language at home - Native, born elsewhere (%)
Residents speaking other language at home - Foreign born (%)
Class of Workers - Employee of private company (%)
Class of Workers - Self-employed in own incorporated business (%)
Class of Workers - Private not-for-profit wage and salary workers (%)
Class of Workers - Local government workers (%)
Class of Workers - State government workers (%)
Class of Workers - Federal government workers (%)
Class of Workers - Self-employed workers in own not incorporated business and Unpaid family workers (%)
House heating fuel used in houses and condos - Utility gas (%)
House heating fuel used in houses and condos - Bottled, tank, or LP gas (%)
House heating fuel used in houses and condos - Electricity (%)
House heating fuel used in houses and condos - Fuel oil, kerosene, etc. (%)
House heating fuel used in houses and condos - Coal or coke (%)
House heating fuel used in houses and condos - Wood (%)
House heating fuel used in houses and condos - Solar energy (%)
House heating fuel used in houses and condos - Other fuel (%)
House heating fuel used in houses and condos - No fuel used (%)
House heating fuel used in apartments - Utility gas (%)
House heating fuel used in apartments - Bottled, tank, or LP gas (%)
House heating fuel used in apartments - Electricity (%)
House heating fuel used in apartments - Fuel oil, kerosene, etc. (%)
House heating fuel used in apartments - Coal or coke (%)
House heating fuel used in apartments - Wood (%)
House heating fuel used in apartments - Solar energy (%)
House heating fuel used in apartments - Other fuel (%)
House heating fuel used in apartments - No fuel used (%)
Armed forces status - In Armed Forces (%)
Armed forces status - Civilian (%)
Armed forces status - Civilian - Veteran (%)
Armed forces status - Civilian - Nonveteran (%)
Fatal accidents locations in years 2005-2021
Fatal accidents locations in 2005
Fatal accidents locations in 2006
Fatal accidents locations in 2007
Fatal accidents locations in 2008
Fatal accidents locations in 2009
Fatal accidents locations in 2010
Fatal accidents locations in 2011
Fatal accidents locations in 2012
Fatal accidents locations in 2013
Fatal accidents locations in 2014
Fatal accidents locations in 2015
Fatal accidents locations in 2016
Fatal accidents locations in 2017
Fatal accidents locations in 2018
Fatal accidents locations in 2019
Fatal accidents locations in 2020
Fatal accidents locations in 2021
Alcohol use - People drinking some alcohol every month (%)
Alcohol use - People not drinking at all (%)
Alcohol use - Average days/month drinking alcohol
Alcohol use - Average drinks/week
Alcohol use - Average days/year people drink much
Audiometry - Average condition of hearing (%)
Audiometry - People that can hear a whisper from across a quiet room (%)
Audiometry - People that can hear normal voice from across a quiet room (%)
Audiometry - Ears ringing, roaring, buzzing (%)
Audiometry - Had a job exposure to loud noise (%)
Audiometry - Had off-work exposure to loud noise (%)
Blood Pressure & Cholesterol - Has high blood pressure (%)
Blood Pressure & Cholesterol - Checking blood pressure at home (%)
Blood Pressure & Cholesterol - Frequently checking blood cholesterol (%)
Blood Pressure & Cholesterol - Has high cholesterol level (%)
Consumer Behavior - Money monthly spent on food at supermarket/grocery store
Consumer Behavior - Money monthly spent on food at other stores
Consumer Behavior - Money monthly spent on eating out
Consumer Behavior - Money monthly spent on carryout/delivered foods
Consumer Behavior - Income spent on food at supermarket/grocery store (%)
Consumer Behavior - Income spent on food at other stores (%)
Consumer Behavior - Income spent on eating out (%)
Consumer Behavior - Income spent on carryout/delivered foods (%)
Current Health Status - General health condition (%)
Current Health Status - Blood donors (%)
Current Health Status - Has blood ever tested for HIV virus (%)
Current Health Status - Left-handed people (%)
Dermatology - People using sunscreen (%)
Diabetes - Diabetics (%)
Diabetes - Had a blood test for high blood sugar (%)
Diabetes - People taking insulin (%)
Diet Behavior & Nutrition - Diet health (%)
Diet Behavior & Nutrition - Milk product consumption (# of products/month)
Diet Behavior & Nutrition - Meals not home prepared (#/week)
Diet Behavior & Nutrition - Meals from fast food or pizza place (#/week)
Diet Behavior & Nutrition - Ready-to-eat foods (#/month)
Diet Behavior & Nutrition - Frozen meals/pizza (#/month)
Drug Use - People that ever used marijuana or hashish (%)
Drug Use - Ever used hard drugs (%)
Drug Use - Ever used any form of cocaine (%)
Drug Use - Ever used heroin (%)
Drug Use - Ever used methamphetamine (%)
Health Insurance - People covered by health insurance (%)
Kidney Conditions-Urology - Avg. # of times urinating at night
Medical Conditions - People with asthma (%)
Medical Conditions - People with anemia (%)
Medical Conditions - People with psoriasis (%)
Medical Conditions - People with overweight (%)
Medical Conditions - Elderly people having difficulties in thinking or remembering (%)
Medical Conditions - People who ever received blood transfusion (%)
Medical Conditions - People having trouble seeing even with glass/contacts (%)
Medical Conditions - People with arthritis (%)
Medical Conditions - People with gout (%)
Medical Conditions - People with congestive heart failure (%)
Medical Conditions - People with coronary heart disease (%)
Medical Conditions - People with angina pectoris (%)
Medical Conditions - People who ever had heart attack (%)
Medical Conditions - People who ever had stroke (%)
Medical Conditions - People with emphysema (%)
Medical Conditions - People with thyroid problem (%)
Medical Conditions - People with chronic bronchitis (%)
Medical Conditions - People with any liver condition (%)
Medical Conditions - People who ever had cancer or malignancy (%)
Mental Health - People who have little interest in doing things (%)
Mental Health - People feeling down, depressed, or hopeless (%)
Mental Health - People who have trouble sleeping or sleeping too much (%)
Mental Health - People feeling tired or having little energy (%)
Mental Health - People with poor appetite or overeating (%)
Mental Health - People feeling bad about themself (%)
Mental Health - People who have trouble concentrating on things (%)
Mental Health - People moving or speaking slowly or too fast (%)
Mental Health - People having thoughts they would be better off dead (%)
Oral Health - Average years since last visit a dentist
Oral Health - People embarrassed because of mouth (%)
Oral Health - People with gum disease (%)
Oral Health - General health of teeth and gums (%)
Oral Health - Average days a week using dental floss/device
Oral Health - Average days a week using mouthwash for dental problem
Oral Health - Average number of teeth
Pesticide Use - Households using pesticides to control insects (%)
Pesticide Use - Households using pesticides to kill weeds (%)
Physical Activity - People doing vigorous-intensity work activities (%)
Physical Activity - People doing moderate-intensity work activities (%)
Physical Activity - People walking or bicycling (%)
Physical Activity - People doing vigorous-intensity recreational activities (%)
Physical Activity - People doing moderate-intensity recreational activities (%)
Physical Activity - Average hours a day doing sedentary activities
Physical Activity - Average hours a day watching TV or videos
Physical Activity - Average hours a day using computer
Physical Functioning - People having limitations keeping them from working (%)
Physical Functioning - People limited in amount of work they can do (%)
Physical Functioning - People that need special equipment to walk (%)
Physical Functioning - People experiencing confusion/memory problems (%)
Physical Functioning - People requiring special healthcare equipment (%)
Prescription Medications - Average number of prescription medicines taking
Preventive Aspirin Use - Adults 40+ taking low-dose aspirin (%)
Reproductive Health - Vaginal deliveries (%)
Reproductive Health - Cesarean deliveries (%)
Reproductive Health - Deliveries resulted in a live birth (%)
Reproductive Health - Pregnancies resulted in a delivery (%)
Reproductive Health - Women breastfeeding newborns (%)
Reproductive Health - Women that had a hysterectomy (%)
Reproductive Health - Women that had both ovaries removed (%)
Reproductive Health - Women that have ever taken birth control pills (%)
Reproductive Health - Women taking birth control pills (%)
Reproductive Health - Women that have ever used Depo-Provera or injectables (%)
Reproductive Health - Women that have ever used female hormones (%)
Sexual Behavior - People 18+ that ever had sex (vaginal, anal, or oral) (%)
Sexual Behavior - Males 18+ that ever had vaginal sex with a woman (%)
Sexual Behavior - Males 18+ that ever performed oral sex on a woman (%)
Sexual Behavior - Males 18+ that ever had anal sex with a woman (%)
Sexual Behavior - Males 18+ that ever had any sex with a man (%)
Sexual Behavior - Females 18+ that ever had vaginal sex with a man (%)
Sexual Behavior - Females 18+ that ever performed oral sex on a man (%)
Sexual Behavior - Females 18+ that ever had anal sex with a man (%)
Sexual Behavior - Females 18+ that ever had any kind of sex with a woman (%)
Sexual Behavior - Average age people first had sex
Sexual Behavior - Average number of female sex partners in lifetime (males 18+)
Sexual Behavior - Average number of female vaginal sex partners in lifetime (males 18+)
Sexual Behavior - Average age people first performed oral sex on a woman (18+)
Sexual Behavior - Average number of woman performed oral sex on in lifetime (18+)
Sexual Behavior - Average number of male sex partners in lifetime (males 18+)
Sexual Behavior - Average number of male anal sex partners in lifetime (males 18+)
Sexual Behavior - Average age people first performed oral sex on a man (18+)
Sexual Behavior - Average number of male oral sex partners in lifetime (18+)
Sexual Behavior - People using protection when performing oral sex (%)
Sexual Behavior - Average number of times people have vaginal or anal sex a year
Sexual Behavior - People having sex without condom (%)
Sexual Behavior - Average number of male sex partners in lifetime (females 18+)
Sexual Behavior - Average number of male vaginal sex partners in lifetime (females 18+)
Sexual Behavior - Average number of female sex partners in lifetime (females 18+)
Sexual Behavior - Circumcised males 18+ (%)
Sleep Disorders - Average hours sleeping at night
Sleep Disorders - People that has trouble sleeping (%)
Smoking-Cigarette Use - People smoking cigarettes (%)
Taste & Smell - People 40+ having problems with smell (%)
Taste & Smell - People 40+ having problems with taste (%)
Taste & Smell - People 40+ that ever had wisdom teeth removed (%)
Taste & Smell - People 40+ that ever had tonsils teeth removed (%)
Taste & Smell - People 40+ that ever had a loss of consciousness because of a head injury (%)
Taste & Smell - People 40+ that ever had a broken nose or other serious injury to face or skull (%)
Taste & Smell - People 40+ that ever had two or more sinus infections (%)
Weight - Average height (inches)
Weight - Average weight (pounds)
Weight - Average BMI
Weight - People that are obese (%)
Weight - People that ever were obese (%)
Weight - People trying to lose weight (%)
Urban population: 23,477
Rural population: 6,078
Estimated median house/condo value in 2022: $287,868
37849:
$287,868Tennessee:
$284,800
According to our research of Tennessee and other state lists, there were 42 registered sex offenders living in 37849 zip code as of April 26, 2024 . The ratio of all residents to sex offenders in zip code 37849 is 658 to 1.The ratio of registered sex offenders to all residents in this zip code is lower than the state average.
Median resident age: This zip code:
39.7 yearsTennessee median age:
39.2 years
Average household size: This zip code:
2.6 peopleTennessee:
2.4 people
Averages for the 2020 tax year for zip code 37849, filed in 2021:
Average Adjusted Gross Income (AGI) in 2020: $62,840 (Individual Income Tax Returns) Here:
$62,840State:
$69,014
Salary/wage: $54,842 (reported on 82.4% of returns )Here:
$54,842State:
$55,872
(% of AGI for various income ranges: 1126.3% for AGIs below $25k , 3452.8% for AGIs $25k-50k , 6132.8% for AGIs $50k-75k , 8905.0% for AGIs $75k-100k , 16304.0% for AGIs $100k-200k , 57167.1% for AGIs over 200k ) Taxable interest for individuals: $1,234 (reported on 30.3% of returns )This zip code:
$1,234Tennessee:
$1,945
(% of AGI for various income ranges: 16.0% for AGIs below $25k , 19.0% for AGIs $25k-50k , 34.4% for AGIs $50k-75k , 59.2% for AGIs $75k-100k , 114.7% for AGIs $100k-200k , 959.3% for AGIs over 200k ) Ordinary dividends: $3,445 (reported on 13.3% of returns )(% of AGI for various income ranges: 12.9% for AGIs below $25k , 17.9% for AGIs $25k-50k , 44.3% for AGIs $50k-75k , 73.2% for AGIs $75k-100k , 152.4% for AGIs $100k-200k , 1298.6% for AGIs over 200k ) Net capital gain/loss in AGI: +$10,482 (reported on 12.2% of returns )Here:
+$10,482State:
+$33,664
(% of AGI for various income ranges: 6.8% for AGIs below $25k , 25.8% for AGIs $25k-50k , 53.6% for AGIs $50k-75k , 84.5% for AGIs $75k-100k , 443.2% for AGIs $100k-200k , 6294.3% for AGIs over 200k ) Profit/loss from business: +$16,368 (reported on 16.2% of returns )Here:
+$16,368State:
+$18,991
(% of AGI for various income ranges: 142.7% for AGIs below $25k , 214.3% for AGIs $25k-50k , 255.1% for AGIs $50k-75k , 305.7% for AGIs $75k-100k , 728.0% for AGIs $100k-200k , 6224.3% for AGIs over 200k ) Taxable individual retirement arrangement distribution: $16,003 (reported on 8.8% of returns )37849:
$16,003Tennessee:
$20,036
(% of AGI for various income ranges: 56.6% for AGIs below $25k , 87.1% for AGIs $25k-50k , 171.9% for AGIs $50k-75k , 276.2% for AGIs $75k-100k , 537.9% for AGIs $100k-200k , 1710.0% for AGIs over 200k ) Self-employed (Keogh) retirement plans: $27,300 (reported on 0.2% of returns )37849:
$27,300Tennessee:
$28,955
(% of AGI for various income ranges: 69.4% for AGIs $100k-200k ) Total itemized deductions: $35,767 (reported on 3.7% of returns )Here:
$35,767State:
$40,136
(% of AGI for various income ranges: 24.0% for AGIs below $25k , 44.1% for AGIs $25k-50k , 113.5% for AGIs $50k-75k , 149.1% for AGIs $75k-100k , 459.3% for AGIs $100k-200k , 4631.4% for AGIs over 200k ) Charity contributions: $19,482 (reported on 3.1% of returns )Here:
$19,482State:
$19,852
(% of AGI for various income ranges: 11.3% for AGIs $25k-50k , 25.3% for AGIs $50k-75k , 56.3% for AGIs $75k-100k , 184.2% for AGIs $100k-200k , 3092.9% for AGIs over 200k ) Taxes paid: $4,511 (reported on 3.5% of returns )(% of AGI for various income ranges: 1.2% for AGIs below $25k , 3.0% for AGIs $25k-50k , 11.3% for AGIs $50k-75k , 20.1% for AGIs $75k-100k , 62.5% for AGIs $100k-200k , 591.4% for AGIs over 200k ) Earned income credit: $2,097 (reported on 15.1% of returns )(% of AGI for various income ranges: 79.0% for AGIs below $25k , 64.0% for AGIs $25k-50k , 1.7% for AGIs $50k-75k ) Percentage of individuals using paid preparers for their 2020 taxes: 93.2%(% for various income ranges: 91.7% for AGIs below $25k , 94.2% for AGIs $25k-50k , 94.1% for AGIs $50k-75k , 93.8% for AGIs $75k-100k , 93.2% for AGIs $100k-200k , 92.1% for AGIs over 200k )
Averages for the 2012 tax year for zip code 37849, filed in 2013:
Average Adjusted Gross Income (AGI) in 2012: $50,554 (Individual Income Tax Returns) Here:
$50,554State:
$53,767
Salary/wage: $45,577 (reported on 85.1% of returns )Here:
$45,577State:
$45,421
(% of AGI for various income ranges: 76.0% for AGIs below $25k , 79.4% for AGIs $25k-50k , 79.3% for AGIs $50k-75k , 78.8% for AGIs $75k-100k , 79.6% for AGIs $100k-200k , 55.8% for AGIs over 200k ) Taxable interest for individuals: $1,012 (reported on 30.4% of returns )This zip code:
$1,012Tennessee:
$1,732
(% of AGI for various income ranges: 0.8% for AGIs below $25k , 0.6% for AGIs $25k-50k , 0.6% for AGIs $50k-75k , 0.5% for AGIs $75k-100k , 0.5% for AGIs $100k-200k , 0.8% for AGIs over 200k ) Ordinary dividends: $2,338 (reported on 13.3% of returns )(% of AGI for various income ranges: 0.6% for AGIs below $25k , 0.5% for AGIs $25k-50k , 0.6% for AGIs $50k-75k , 0.6% for AGIs $75k-100k , 0.7% for AGIs $100k-200k , 0.8% for AGIs over 200k ) Net capital gain/loss in AGI: +$4,045 (reported on 9.7% of returns )Here:
+$4,045State:
+$19,082
(% of AGI for various income ranges: 0.2% for AGIs $25k-50k , 0.2% for AGIs $50k-75k , 0.4% for AGIs $75k-100k , 0.9% for AGIs $100k-200k , 4.1% for AGIs over 200k ) Profit/loss from business: +$12,488 (reported on 15.6% of returns )Here:
+$12,488State:
+$15,240
(% of AGI for various income ranges: 8.5% for AGIs below $25k , 3.1% for AGIs $25k-50k , 2.9% for AGIs $50k-75k , 2.7% for AGIs $75k-100k , 3.3% for AGIs $100k-200k , 6.4% for AGIs over 200k ) Taxable individual retirement arrangement distribution: $12,642 (reported on 9.7% of returns )37849:
$12,642Tennessee:
$15,505
(% of AGI for various income ranges: 3.3% for AGIs below $25k , 2.2% for AGIs $25k-50k , 2.0% for AGIs $50k-75k , 2.5% for AGIs $75k-100k , 2.5% for AGIs $100k-200k , 2.4% for AGIs over 200k ) Self-employment retirement plans: $19,900 (reported on 0.3% of returns )37849:
$19,900Tennessee:
$22,567
Total itemized deductions: $19,007 (21% of AGI, reported on 24.2% of returns )Here:
$19,007State:
$21,976
Here:
21.1% of AGIState:
17.8% of AGI
(% of AGI for various income ranges: 6.4% for AGIs below $25k , 7.7% for AGIs $25k-50k , 8.3% for AGIs $50k-75k , 9.2% for AGIs $75k-100k , 11.7% for AGIs $100k-200k , 8.8% for AGIs over 200k ) Charity contributions: $6,165 (reported on 19.6% of returns )(% of AGI for various income ranges: 0.8% for AGIs below $25k , 1.2% for AGIs $25k-50k , 2.0% for AGIs $50k-75k , 2.3% for AGIs $75k-100k , 3.5% for AGIs $100k-200k , 4.0% for AGIs over 200k ) Taxes paid: $3,475 (reported on 23.9% of returns )(% of AGI for various income ranges: 0.8% for AGIs below $25k , 1.2% for AGIs $25k-50k , 1.5% for AGIs $50k-75k , 1.8% for AGIs $75k-100k , 2.1% for AGIs $100k-200k , 2.0% for AGIs over 200k ) Earned income credit: $2,192 (reported on 18.0% of returns )(% of AGI for various income ranges: 6.3% for AGIs below $25k , 1.2% for AGIs $25k-50k ) Percentage of individuals using paid preparers for their 2012 taxes: 47.7%(% for various income ranges: 44.3% for AGIs below $25k , 48.6% for AGIs $25k-50k , 50.3% for AGIs $50k-75k , 48.4% for AGIs $75k-100k , 50.0% for AGIs $100k-200k , 70.6% for AGIs over 200k )
Averages for the 2004 tax year for zip code 37849, filed in 2005:
Average Adjusted Gross Income (AGI) in 2004: $42,841 (Individual Income Tax Returns) Here:
$42,841State:
$44,088
Salary/wage: $40,235 (reported on 85.9% of returns )Here:
$40,235State:
$38,825
(% of AGI for various income ranges: 114.2% for AGIs below $10k , 75.1% for AGIs $10k-25k , 82.1% for AGIs $25k-50k , 83.9% for AGIs $50k-75k , 86.6% for AGIs $75k-100k , 72.0% for AGIs over 100k ) Taxable interest for individuals: $1,089 (reported on 44.3% of returns )This zip code:
$1,089Tennessee:
$1,802
(% of AGI for various income ranges: 4.5% for AGIs below $10k , 2.2% for AGIs $10k-25k , 1.2% for AGIs $25k-50k , 0.9% for AGIs $50k-75k , 0.7% for AGIs $75k-100k , 1.0% for AGIs over 100k ) Taxable dividends: $1,306 (reported on 16.9% of returns )(% of AGI for various income ranges: 1.5% for AGIs below $10k , 0.6% for AGIs $10k-25k , 0.5% for AGIs $25k-50k , 0.3% for AGIs $50k-75k , 0.4% for AGIs $75k-100k , 0.7% for AGIs over 100k ) Net capital gain/loss: +$4,777 (reported on 13.0% of returns )Here:
+$4,777State:
+$15,776
(% of AGI for various income ranges: -1.5% for AGIs below $10k , 0.2% for AGIs $10k-25k , 0.4% for AGIs $25k-50k , 0.6% for AGIs $50k-75k , 0.7% for AGIs $75k-100k , 4.3% for AGIs over 100k ) Profit/loss from business: +$11,737 (reported on 16.8% of returns )Here:
+$11,737State:
+$12,882
(% of AGI for various income ranges: 2.1% for AGIs below $10k , 6.9% for AGIs $10k-25k , 3.9% for AGIs $25k-50k , 2.9% for AGIs $50k-75k , 2.4% for AGIs $75k-100k , 7.8% for AGIs over 100k ) IRA payment deduction: $2,984 (reported on 2.3% of returns )37849:
$2,984Tennessee:
$2,934
(% of AGI for various income ranges: 0.2% for AGIs $10k-25k , 0.3% for AGIs $25k-50k , 0.2% for AGIs $50k-75k , 0.1% for AGIs $75k-100k , 0.1% for AGIs over 100k ) Self-employed pension: $13,586 (reported on 0.5% of returns )Here:
$13,586Tennessee:
$16,857
Total itemized deductions: $15,830 (22% of AGI, reported on 28.2% of returns )Here:
$15,830State:
$18,035
Here:
21.7% of AGIState:
19.9% of AGI
(% of AGI for various income ranges: 10.8% for AGIs below $10k , 7.3% for AGIs $10k-25k , 9.7% for AGIs $25k-50k , 10.9% for AGIs $50k-75k , 11.6% for AGIs $75k-100k , 10.8% for AGIs over 100k ) Charity contributions deductions: $4,923 (6% of AGI, reported on 24.5% of returns )Here:
6.4% of AGIState:
5.3% of AGI
(% of AGI for various income ranges: 0.8% for AGIs below $10k , 1.1% for AGIs $10k-25k , 1.8% for AGIs $25k-50k , 2.4% for AGIs $50k-75k , 3.1% for AGIs $75k-100k , 4.5% for AGIs over 100k ) Total tax: $5,706 (reported on 78.0% of returns )(% of AGI for various income ranges: 3.8% for AGIs below $10k , 4.4% for AGIs $10k-25k , 6.8% for AGIs $25k-50k , 8.7% for AGIs $50k-75k , 10.4% for AGIs $75k-100k , 17.7% for AGIs over 100k ) Earned income credit: $1,764 (reported on 14.7% of returns )Percentage of individuals using paid preparers for their 2004 taxes: 53.2%(% for various income ranges: 46.3% for AGIs below $10k , 58.1% for AGIs $10k-25k , 55.2% for AGIs $25k-50k , 52.2% for AGIs $50k-75k , 50.2% for AGIs $75k-100k , 54.0% for AGIs over 100k )
Estimated median household income in 2022: This zip code:
$79,346Tennessee:
$65,254
Nearest zip codes: 37912 ,
37754 ,
37921 ,
37909 ,
37931 ,
37938 .
Knoxville Zip Code Map
Percentage of family households: This zip code:
47.8%Tennessee:
46.2%
Percentage of households with unmarried partners: This zip code:
5.2%Tennessee:
47.1%
No gay or lesbian households reported
Household received Food Stamps/SNAP in the past 12 months: 882Household did not receive Food Stamps/SNAP in the past 12 months: 10,511
Women who had a birth in the past 12 months: 405 (351 now married , 58 unmarried) Women who did not have a birth in the past 12 months: 6,457 (2,886 now married , 3,571 unmarried)
Housing units in zip code 37849 with a mortgage: 5,191 (463
second mortgage , 354
both second mortgage and home equity loan )
Houses without a mortgage: 162
Median monthly owner costs for units with a mortgage: $1,441
Median monthly owner costs for units without a mortgage: $393
Residents with income below the poverty level in 2022:
This zip code:
7.5%Whole state:
13.3%
Residents with income below 50% of the poverty level in 2022:
This zip code:
4.1%Whole state:
7.1%
Median number of rooms in houses and condos: Median number of rooms in apartments: Notable locations in this zip code not listed on our city pages
Click to draw/clear zip code borders Notable locations in zip code 37849: (A) , Marine Playland Dock (B) , Jordan Siding (C) , Scenic Woods (D) , Baker Mill (E) , Claxton Volunteer Fire Department (F) . Display/hide their locations on the map
Shopping Center: (1) . Display/hide its location on the map
Churches in zip code 37849 include: (A) , Spring Hill Baptist Church (B) , Sunnyview Church (C) , Temple Baptist Church (D) , Zion Baptist Church (E) , Pleasant Hill Church (F) , Haven Chapel (G) , First Baptist Church of Powell (H) , Glenwood Baptist Church (I) . Display/hide their locations on the map
Cemeteries: (1) , Jennings Cemetery (2) , Jett Cemetery (3) , Wallace Cemetery (4) , King Cemetery (5) , Latham Cemetery (6) , Bookout Cemetery (7) . Display/hide their locations on the map
Streams, rivers, and creeks: (A) , Hansard Mill Branch (B) , Fowler Spring Branch (C) , Burnett Branch (D) , Dooling Spring Branch (E) , Copper Ridge Branch (F) , Blazer Branch (G) , Coward Branch (H) , Aulton Branch (I) . Display/hide their locations on the map
Year house built (houses)
109 2020 or later1,231 2010 to 20192,896 2000 to 20091,901 1990 to 19991,492 1980 to 19891,620 1970 to 19791,014 1960 to 1969598 1950 to 1959292 1940 to 1949199 1939 or earlier
Zip code 37849 household income distribution in 2022 507 Less than $10,000507 $10,000 to $14,999321 $15,000 to $19,999469 $20,000 to $24,999201 $25,000 to $29,999277 $30,000 to $34,999386 $35,000 to $39,999469 $40,000 to $44,999462 $45,000 to $49,999598 $50,000 to $59,9991,167 $60,000 to $74,9991,994 $75,000 to $99,9991,258 $100,000 to $124,999890 $125,000 to $149,9991,209 $150,000 to $199,999703 $200,000 or moreEstimate of home value of owner-occupied houses/condos in 2022 in zip code 37849 169 Less than $10,00043 $10,000 to $14,9993 $15,000 to $19,99954 $25,000 to $29,99952 $30,000 to $34,99929 $35,000 to $39,99938 $40,000 to $49,99923 $50,000 to $59,99923 $60,000 to $69,999110 $70,000 to $79,999120 $80,000 to $89,99975 $90,000 to $99,999311 $100,000 to $124,999205 $125,000 to $149,999652 $150,000 to $174,999629 $175,000 to $199,9991,578 $200,000 to $249,9991,686 $250,000 to $299,9991,828 $300,000 to $399,999628 $400,000 to $499,999351 $500,000 to $749,999163 $750,000 to $999,99918 $1,000,000 to $1,499,999Rent paid by renters in 2022 in zip code 37849 4 Less than $10070 $150 to $19938 $200 to $24920 $250 to $29911 $300 to $34941 $350 to $3995 $400 to $449155 $450 to $499116 $500 to $54957 $550 to $599168 $600 to $649143 $650 to $69971 $700 to $74932 $750 to $799250 $800 to $89973 $900 to $999160 $1,000 to $1,249209 $1,250 to $1,499151 $1,500 to $1,99951 $3,500 or more288 No cash rent
Median gross rent in 2022: $964.
Median price asked for vacant for-sale houses and condos in 2022: $312,402.
Estimated median house (or condo) value in 2022 for: White Non-Hispanic householders: $315,774Black or African American householders: $352,175American Indian or Alaska Native householders: $227,503Asian householders: $492,924Native Hawaiian and other Pacific Islander householders: $288,170Two or more races householders: $259,657Hispanic or Latino householders: $166,835Estimated median house or condo value in 2022: $287,868
37849:
$287,868Tennessee:
$284,800
Lower value quartile - upper value quartile: $206,973 - $363,639
Mean price in 2022: Detached houses: $307,401Here:
$307,401State:
$374,382
Townhouses or other attached units: $260,759Here:
$260,759State:
$354,101
In 3-to-4-unit structures: $129,722Here:
$129,722State:
$239,060
Mobile homes: $65,047Here:
$65,047State:
$101,421
Housing units in structures:
One, detached: 8,729One, attached: 923Two: 1353 or 4: 1595 to 9: 18410 to 19: 7720 to 49: 13850 or more: 157Mobile homes: 1,091Unemployment : 2.8%
Means of transportation to work in zip code 37849 75.2% 11,134 Drove a car alone9.4% 1,394 Carpooled0.7% 97 Bus or trolley bus0.1% 12 Motorcycle0.1% 21 Bicycle0.4% 53 Walked0.4% 54 Other means13.6% 2,008 Worked at homeTravel time to work (commute) in zip code 37849 156 Less than 5 minutes617 5 to 9 minutes1,141 10 to 14 minutes2,284 15 to 19 minutes3,024 20 to 24 minutes1,393 25 to 29 minutes2,222 30 to 34 minutes491 35 to 39 minutes246 40 to 44 minutes663 45 to 59 minutes317 60 to 89 minutes243 90 or more minutes
Percentage of zip code residents living and working in this county: 76.1%
Household type by relationship:
Households: 29,556
Male householders: 5,901 (1,125 living alone ), Female householders: 5,465 (1,709 living alone )6,439 spouses (6,422 opposite-sex spouses ), 803 unmarried partners , (746 opposite-sex unmarried partners ), 8,528 children (7,864 natural , 244 adopted , 418 stepchildren ), 818 grandchildren , 11 brothers or sisters , 253 parents , 0 foster children , 393 other relatives , 489 non-relatives In group quarters: 507 (-1 institutionalized population )
Size of family households: 3,345 2-persons , 1,877 3-persons , 1,632 4-persons , 628 5-persons , 216 6-persons , 200 7-or-more-persons
Size of nonfamily households: 2,840 1-person , 501 2-persons , 88 3-persons , 37 5-persons
4,621 married couples with children. single-parent households (234 men , 584 women ).
95.1% of residents of 37849 zip code speak English at home. of residents speak Spanish at home (53% very well, 14% well, 33% not well ).of residents speak other Indo-European language at home (100% very well ).of residents speak Asian or Pacific Island language at home (14% well, 86% not well ).of residents speak other language at home (40% very well, 55% well, 5% not at all ).
Foreign born population: 817 (2.8%)
(35.6%
of them are naturalized citizens )
This zip code:
2.8%Whole state:
5.6%
43% Honduras 11% Israel 9% Georgia 6% France 4% Brazil 3% El Salvador 3% Guatemala 21% American 18% English 9% Irish 9% German 4% European 2% Scotch-Irish 2% Iraqi
Year of entry for the foreign-born population
546 2010 or later 388 2000 to 2009 21 1990 to 1999 175 Before 1990
Facilities with environmental interests located in this zip code:
CLAXTON ELEMENTARY SCHOOL (2218 CLINTON HW in POWELL, TN)
(Geographic Names Information System) (National Center for Education Statistics) - STATE ID-0015 Organizations: ANDERSON COUNTY SCHOOL DISTRCT (SCHOOL DISTRICT)
COOPER RIDGE ELEMENTARY SCHOOL (2502 BRUSHY VALLEY RD in POWELL, TN)
(National Center for Education Statistics) - STATE ID-0051 Organizations: KNOX COUNTY SCHOOL DISTRICT (SCHOOL DISTRICT)
BROOKS AUTO BODY (7934 CONNER ROAD in POWELL, TN)
(Resource Conservation and Recovery Act (tracking hazardous waste))
DEROYAL INDUSTRIES (200 DEBUSK LN in POWELL, TN)
(Resource Conservation and Recovery Act (tracking hazardous waste)) Business NAICS classification: SURGICAL APPLIANCE AND SUPPLIES MANUFACTURING.
ARNOLD'S GARAGE INC (NEXT TO RAILROAD AND COMMERCE in POWELL, TN)
Conditionally Exempt Small Quantity Generators, less than 100 kg/month of hazardous waste (Resource Conservation and Recovery Act (tracking hazardous waste)) - notification Business NAICS classification: ALL OTHER AUTOMOTIVE REPAIR AND MAINTENANCE.Organizations: WILLIAM N GAINES & OSIE LEE ARNOLD (CONTACT/OWNER)
Housing units lacking complete plumbing facilities: 1.2%
Housing units lacking complete kitchen facilities: 0.4%
61.9% Electricity 35.4% Utility gas 1.7% Bottled, tank, or LP gas 1.0% Wood
Population in 1990: 14,646. Population change in the 1990s: +6,963 (+47.5%).
Place of birth for U.S.-born residents:
This state: 18,945Northeast: 843Midwest: 2,459South: 5,175West: 890
61% of the 37849 zip code residents lived in the same house 5 years ago.
Out of people who lived in different houses, 64% lived in this county.
Out of people who lived in different counties, 50% lived in Tennessee.
93% of the 37849 zip code residents lived in the same house 1 year ago.
Out of people who lived in different houses, 42% moved from this county.
Out of people who lived in different houses, 25% moved from different county within same state.
Out of people who lived in different houses, 34% moved from different state.
Out of people who lived in different houses, 4% moved from abroad.
Private vs. public school enrollment:
Students in private schools in grades 1 to 8 (elementary and middle school): 714
Here:
28.7%Tennessee:
15.0%
Students in private schools in grades 9 to 12 (high school): 291
Here:
18.5%Tennessee:
16.2%
Students in private undergraduate colleges: 281
Here:
16.3%Tennessee:
23.5%
Occupation by median earnings in the past 12 months ($)
102,987 Architecture and engineering occupations 82,105 Law enforcement workers including supervisors 77,195 Computer and mathematical occupations 68,922 Health diagnosing and treating practitioners and other technical occupations 66,932 Management occupations 64,631 Community and social service occupations
Companies with federal contracts located in this zip code:
COMMON GROUND LANDSCAPE MANAGE (2333 W EMORY RD in POWELL, TN; small business)
$30,123 with Army for Landscaping/Groundskeeping Services. Signed on 2005-01-05. Completion date: 2006-01-05.
MICHAEL A ROBINSON (1900 SPRING ST in POWELL, TN; small business) in 3 contracts from 2003 to 2005
$4,502 with Army for Inspection Services (including commercial testing and lab services, except medical/dental) -- Miscellaneous. Signed on 2005-10-01. Completion date: 2006-09-30.
, same as above. Signed on 2004-10-01. Completion date: 2005-09-30.
, same as above. Signed on 2003-10-08. Completion date: 2004-09-30.
WELLS, CHARLES A SALES CO (IN (7421 CLINTON HIGHWAY in POWELL, TN; small business)
$3,280 with Army for Miscellaneous Construction Materials. Signed on 2004-07-22. Completion date: 2004-08-21.
Top industries in this zip code by the number of employees in 2005:
Wholesale Trade: Medical, Dental, and Hospital Equipment and Supplies Merchant Wholesalers (250-499 employees: 1 establishment, 20-49 employees: 1 establishment)Other Services (except Public Administration): Religious Organizations (50-99: 3, 20-49: 1, 5-9: 6, 1-4: 6)Accommodation and Food Services: Full-Service Restaurants (50-99: 3, 20-49: 1, 10-19: 2, 1-4: 3)Accommodation and Food Services: Limited-Service Restaurants (50-99: 1, 20-49: 5, 10-19: 1, 5-9: 2)Health Care and Social Assistance: Child Day Care Services (20-49: 2, 10-19: 3, 5-9: 1, 1-4: 1)Construction: Plumbing, Heating, and Air-Conditioning Contractors (20-49: 1, 10-19: 3, 5-9: 2, 1-4: 5)
People in group quarters in 2010:
368 people in college/university student housing
46 people in hospitals with patients who have no usual home elsewhere
People in group quarters in 2000:
394 people in college dormitories (includes college quarters off campus)
22 people in other noninstitutional group quarters
4 people in homes for the mentally retarded
Fatal accident statistics in 2014:
Fatal accident count: 8Vehicles involved in fatal accidents: 10Fatal accidents caused by drunken drivers: 2Fatalities: 9Persons involved in fatal accidents: 13Pedestrians involved in fatal accidents: 2
Fatal accident statistics in 2013:
Fatal accident count: 2Vehicles involved in fatal accidents: 3Fatal accidents caused by drunken drivers: 0Fatalities: 2Persons involved in fatal accidents: 3Pedestrians involved in fatal accidents: 0
Home Mortgage Disclosure Act Aggregated Statistics For Year 2009(Based on 2 full and 10 partial tracts) A) FHA, FSA/RHS & VA B) Conventional C) Refinancings D) Home Improvement Loans E) Loans on Dwellings For 5+ Families F) Non-occupant Loans on G) Loans On Manufactured Number Average Value Number Average Value Number Average Value Number Average Value Number Average Value Number Average Value Number Average Value
LOANS ORIGINATED 290 $148,172 237 $153,772 1,373 $150,304 86 $71,930 1 $513,000 63 $110,586 17 $84,978 APPLICATIONS APPROVED, NOT ACCEPTED 10 $148,414 20 $179,564 116 $162,238 8 $38,874 0 $0 8 $127,492 5 $41,376 APPLICATIONS DENIED 25 $131,711 38 $100,451 346 $154,961 32 $28,464 0 $0 18 $64,715 21 $60,838 APPLICATIONS WITHDRAWN 31 $183,702 40 $133,782 291 $166,306 8 $64,463 0 $0 2 $139,055 3 $28,273 FILES CLOSED FOR INCOMPLETENESS 10 $167,728 8 $99,768 73 $161,256 1 $5,940 0 $0 5 $100,184 4 $48,838
Aggregated Statistics For Year 2008(Based on 2 full and 10 partial tracts) A) FHA, FSA/RHS & VA B) Conventional C) Refinancings D) Home Improvement Loans E) Loans on Dwellings For 5+ Families F) Non-occupant Loans on G) Loans On Manufactured Number Average Value Number Average Value Number Average Value Number Average Value Number Average Value Number Average Value Number Average Value
LOANS ORIGINATED 224 $159,519 441 $154,333 759 $141,704 115 $50,612 1 $153,900 74 $119,935 47 $62,944 APPLICATIONS APPROVED, NOT ACCEPTED 14 $154,583 41 $135,772 87 $137,674 23 $55,810 0 $0 4 $101,585 7 $75,210 APPLICATIONS DENIED 31 $137,966 66 $136,850 390 $153,767 98 $70,709 0 $0 11 $75,009 27 $84,869 APPLICATIONS WITHDRAWN 19 $139,942 62 $175,483 175 $157,821 26 $84,082 0 $0 8 $96,694 15 $49,134 FILES CLOSED FOR INCOMPLETENESS 4 $130,658 8 $138,855 51 $192,079 2 $85,495 0 $0 1 $83,190 2 $84,965
Aggregated Statistics For Year 2007(Based on 2 full and 10 partial tracts) A) FHA, FSA/RHS & VA B) Conventional C) Refinancings D) Home Improvement Loans E) Loans on Dwellings For 5+ Families F) Non-occupant Loans on G) Loans On Manufactured Number Average Value Number Average Value Number Average Value Number Average Value Number Average Value Number Average Value Number Average Value
LOANS ORIGINATED 101 $145,332 918 $134,613 767 $131,869 183 $54,356 3 $7,527,620 127 $115,469 56 $62,495 APPLICATIONS APPROVED, NOT ACCEPTED 4 $107,590 81 $110,894 123 $130,322 11 $55,199 0 $0 11 $90,493 17 $30,555 APPLICATIONS DENIED 4 $142,128 147 $116,308 473 $126,444 106 $61,191 1 $662,630 28 $93,949 57 $55,491 APPLICATIONS WITHDRAWN 6 $140,837 63 $137,772 215 $142,043 36 $99,248 0 $0 9 $125,980 10 $68,966 FILES CLOSED FOR INCOMPLETENESS 0 $0 42 $137,455 100 $136,694 2 $34,970 0 $0 10 $118,564 3 $80,800
Aggregated Statistics For Year 2006(Based on 2 full and 10 partial tracts) A) FHA, FSA/RHS & VA B) Conventional C) Refinancings D) Home Improvement Loans E) Loans on Dwellings For 5+ Families F) Non-occupant Loans on G) Loans On Manufactured Number Average Value Number Average Value Number Average Value Number Average Value Number Average Value Number Average Value Number Average Value
LOANS ORIGINATED 139 $129,246 1,211 $118,419 831 $112,513 168 $42,345 1 $5,823,160 146 $90,200 62 $62,140 APPLICATIONS APPROVED, NOT ACCEPTED 20 $120,786 170 $92,761 157 $100,348 27 $58,098 0 $0 44 $68,829 55 $55,569 APPLICATIONS DENIED 10 $119,098 219 $90,151 521 $118,365 96 $48,832 0 $0 82 $68,191 122 $55,904 APPLICATIONS WITHDRAWN 14 $137,418 96 $121,675 350 $129,213 31 $85,664 0 $0 9 $95,029 8 $98,342 FILES CLOSED FOR INCOMPLETENESS 1 $120,620 46 $102,619 114 $107,335 2 $231,725 0 $0 8 $139,654 0 $0
Aggregated Statistics For Year 2005(Based on 2 full and 10 partial tracts) A) FHA, FSA/RHS & VA B) Conventional C) Refinancings D) Home Improvement Loans E) Loans on Dwellings For 5+ Families F) Non-occupant Loans on G) Loans On Manufactured Number Average Value Number Average Value Number Average Value Number Average Value Number Average Value Number Average Value Number Average Value
LOANS ORIGINATED 146 $126,390 1,304 $111,916 941 $109,154 134 $37,519 2 $144,475 135 $98,722 117 $46,842 APPLICATIONS APPROVED, NOT ACCEPTED 9 $104,561 201 $88,554 168 $101,047 18 $44,636 0 $0 15 $76,262 96 $38,829 APPLICATIONS DENIED 13 $97,667 312 $80,908 563 $115,400 112 $48,415 0 $0 51 $76,978 202 $49,351 APPLICATIONS WITHDRAWN 17 $111,946 88 $137,715 567 $131,858 47 $92,599 0 $0 12 $96,181 13 $74,349 FILES CLOSED FOR INCOMPLETENESS 2 $131,880 36 $97,608 67 $122,296 1 $76,600 0 $0 0 $0 1 $95,760
Aggregated Statistics For Year 2004(Based on 2 full and 10 partial tracts) A) FHA, FSA/RHS & VA B) Conventional C) Refinancings D) Home Improvement Loans E) Loans on Dwellings For 5+ Families F) Non-occupant Loans on G) Loans On Manufactured Number Average Value Number Average Value Number Average Value Number Average Value Number Average Value Number Average Value Number Average Value
LOANS ORIGINATED 235 $109,942 1,076 $106,729 997 $109,685 117 $37,529 1 $189,890 101 $91,796 143 $46,944 APPLICATIONS APPROVED, NOT ACCEPTED 23 $100,567 181 $72,023 202 $111,546 12 $38,558 0 $0 16 $97,428 112 $41,347 APPLICATIONS DENIED 33 $90,259 327 $61,475 516 $102,302 93 $34,002 0 $0 30 $80,206 280 $47,770 APPLICATIONS WITHDRAWN 31 $107,418 90 $113,258 445 $112,557 13 $33,988 0 $0 14 $101,135 24 $76,939 FILES CLOSED FOR INCOMPLETENESS 2 $122,260 6 $183,587 30 $105,087 2 $41,980 0 $0 1 $51,300 0 $0
Aggregated Statistics For Year 2003(Based on 2 full and 10 partial tracts) A) FHA, FSA/RHS & VA B) Conventional C) Refinancings D) Home Improvement Loans F) Non-occupant Loans on Number Average Value Number Average Value Number Average Value Number Average Value Number Average Value
LOANS ORIGINATED 198 $111,235 819 $109,882 1,981 $104,824 93 $30,054 107 $77,964 APPLICATIONS APPROVED, NOT ACCEPTED 8 $75,285 114 $81,701 226 $98,207 15 $41,930 12 $66,430 APPLICATIONS DENIED 16 $98,078 218 $69,072 610 $95,149 41 $31,359 25 $95,306 APPLICATIONS WITHDRAWN 28 $104,544 60 $110,250 380 $106,805 6 $42,310 12 $75,562 FILES CLOSED FOR INCOMPLETENESS 0 $0 20 $136,164 53 $113,296 0 $0 4 $98,005
Aggregated Statistics For Year 2002(Based on 2 full and 10 partial tracts) A) FHA, FSA/RHS & VA B) Conventional C) Refinancings D) Home Improvement Loans F) Non-occupant Loans on Number Average Value Number Average Value Number Average Value Number Average Value Number Average Value
LOANS ORIGINATED 182 $103,667 622 $108,191 1,281 $99,429 158 $21,184 79 $83,559 APPLICATIONS APPROVED, NOT ACCEPTED 8 $113,386 93 $60,882 172 $89,592 12 $15,967 10 $50,121 APPLICATIONS DENIED 17 $84,518 219 $50,317 425 $84,413 62 $16,660 21 $54,448 APPLICATIONS WITHDRAWN 16 $121,057 55 $79,674 200 $98,571 16 $22,012 8 $71,429 FILES CLOSED FOR INCOMPLETENESS 1 $145,140 24 $82,957 38 $87,534 1 $13,100 3 $51,217
Aggregated Statistics For Year 2001(Based on 2 full and 10 partial tracts) A) FHA, FSA/RHS & VA B) Conventional C) Refinancings D) Home Improvement Loans E) Loans on Dwellings For 5+ Families F) Non-occupant Loans on Number Average Value Number Average Value Number Average Value Number Average Value Number Average Value Number Average Value
LOANS ORIGINATED 208 $96,269 602 $98,575 1,230 $96,239 131 $23,300 1 $89,920 66 $96,224 APPLICATIONS APPROVED, NOT ACCEPTED 7 $98,583 114 $52,629 151 $83,691 17 $14,724 0 $0 6 $128,708 APPLICATIONS DENIED 11 $75,357 313 $51,187 436 $85,763 57 $27,287 0 $0 13 $74,840 APPLICATIONS WITHDRAWN 15 $93,086 61 $118,267 189 $81,079 8 $27,771 0 $0 6 $40,963 FILES CLOSED FOR INCOMPLETENESS 2 $139,635 7 $98,643 55 $96,941 0 $0 0 $0 0 $0
Aggregated Statistics For Year 2000(Based on 2 full and 10 partial tracts) A) FHA, FSA/RHS & VA B) Conventional C) Refinancings D) Home Improvement Loans F) Non-occupant Loans on Number Average Value Number Average Value Number Average Value Number Average Value Number Average Value
LOANS ORIGINATED 167 $92,989 573 $81,992 354 $67,938 121 $27,628 35 $59,767 APPLICATIONS APPROVED, NOT ACCEPTED 10 $75,201 146 $40,229 104 $69,657 20 $17,739 17 $31,774 APPLICATIONS DENIED 15 $52,164 354 $40,193 233 $70,300 37 $15,049 13 $62,351 APPLICATIONS WITHDRAWN 19 $77,549 55 $89,404 146 $74,113 14 $53,122 4 $89,920 FILES CLOSED FOR INCOMPLETENESS 1 $129,340 14 $102,696 19 $66,669 0 $0 0 $0
Aggregated Statistics For Year 1999(Based on 1 full and 5 partial tracts) A) FHA, FSA/RHS & VA B) Conventional C) Refinancings D) Home Improvement Loans F) Non-occupant Loans on Number Average Value Number Average Value Number Average Value Number Average Value Number Average Value
LOANS ORIGINATED 95 $90,352 291 $83,237 300 $75,103 67 $19,603 32 $68,279 APPLICATIONS APPROVED, NOT ACCEPTED 4 $87,660 89 $46,910 76 $74,952 10 $16,143 4 $50,985 APPLICATIONS DENIED 3 $89,507 199 $43,094 154 $72,201 29 $16,897 16 $52,450 APPLICATIONS WITHDRAWN 12 $79,751 30 $86,943 96 $71,990 8 $49,928 1 $23,860 FILES CLOSED FOR INCOMPLETENESS 0 $0 10 $61,831 20 $78,494 1 $28,190 1 $30,880
Private Mortgage Insurance Companies Aggregated Statistics For Year 2009(Based on 2 full and 10 partial tracts) A) Conventional B) Refinancings C) Non-occupant Loans on Number Average Value Number Average Value Number Average Value
LOANS ORIGINATED 53 $187,341 81 $183,582 0 $0 APPLICATIONS APPROVED, NOT ACCEPTED 13 $211,884 21 $208,280 1 $141,460 APPLICATIONS DENIED 3 $199,053 8 $177,171 0 $0 APPLICATIONS WITHDRAWN 5 $332,972 5 $253,780 0 $0 FILES CLOSED FOR INCOMPLETENESS 0 $0 2 $113,180 0 $0
Aggregated Statistics For Year 2008(Based on 2 full and 10 partial tracts) A) Conventional B) Refinancings C) Non-occupant Loans on Number Average Value Number Average Value Number Average Value
LOANS ORIGINATED 170 $179,693 82 $179,339 11 $132,445 APPLICATIONS APPROVED, NOT ACCEPTED 44 $172,365 23 $183,720 1 $190,390 APPLICATIONS DENIED 6 $128,262 2 $161,855 5 $138,464 APPLICATIONS WITHDRAWN 5 $139,828 6 $188,910 1 $153,530 FILES CLOSED FOR INCOMPLETENESS 3 $186,010 1 $111,120 1 $56,450
Aggregated Statistics For Year 2007(Based on 2 full and 10 partial tracts) A) Conventional B) Refinancings C) Non-occupant Loans on D) Loans On Manufactured Number Average Value Number Average Value Number Average Value Number Average Value
LOANS ORIGINATED 286 $154,570 101 $170,026 12 $127,898 2 $55,315 APPLICATIONS APPROVED, NOT ACCEPTED 29 $165,027 17 $184,706 3 $264,470 1 $101,670 APPLICATIONS DENIED 1 $160,620 4 $207,220 1 $72,670 0 $0 APPLICATIONS WITHDRAWN 10 $143,087 4 $195,705 1 $90,940 0 $0 FILES CLOSED FOR INCOMPLETENESS 0 $0 0 $0 0 $0 0 $0
Aggregated Statistics For Year 2006(Based on 2 full and 10 partial tracts) A) Conventional B) Refinancings C) Non-occupant Loans on Number Average Value Number Average Value Number Average Value
LOANS ORIGINATED 164 $157,040 68 $150,739 8 $181,444 APPLICATIONS APPROVED, NOT ACCEPTED 10 $186,012 17 $150,078 1 $102,130 APPLICATIONS DENIED 1 $123,000 1 $101,010 0 $0 APPLICATIONS WITHDRAWN 6 $285,812 5 $135,266 1 $241,820 FILES CLOSED FOR INCOMPLETENESS 0 $0 0 $0 0 $0
Aggregated Statistics For Year 2005(Based on 2 full and 10 partial tracts) A) Conventional B) Refinancings C) Non-occupant Loans on D) Loans On Manufactured Number Average Value Number Average Value Number Average Value Number Average Value
LOANS ORIGINATED 167 $132,161 71 $132,933 13 $112,084 5 $93,814 APPLICATIONS APPROVED, NOT ACCEPTED 15 $152,937 20 $130,510 3 $148,967 0 $0 APPLICATIONS DENIED 0 $0 0 $0 0 $0 0 $0 APPLICATIONS WITHDRAWN 2 $184,695 3 $116,567 0 $0 0 $0 FILES CLOSED FOR INCOMPLETENESS 0 $0 2 $105,905 2 $105,905 0 $0
Aggregated Statistics For Year 2004(Based on 2 full and 10 partial tracts) A) Conventional B) Refinancings C) Non-occupant Loans on D) Loans On Manufactured Number Average Value Number Average Value Number Average Value Number Average Value
LOANS ORIGINATED 136 $142,544 76 $128,513 9 $125,027 1 $96,020 APPLICATIONS APPROVED, NOT ACCEPTED 21 $126,013 30 $139,780 1 $85,970 0 $0 APPLICATIONS DENIED 1 $56,820 4 $105,800 0 $0 2 $76,715 APPLICATIONS WITHDRAWN 3 $206,753 9 $157,246 0 $0 0 $0 FILES CLOSED FOR INCOMPLETENESS 1 $151,520 0 $0 0 $0 0 $0
Aggregated Statistics For Year 2003(Based on 2 full and 10 partial tracts) A) Conventional B) Refinancings C) Non-occupant Loans on Number Average Value Number Average Value Number Average Value
LOANS ORIGINATED 222 $131,661 277 $121,263 18 $98,098 APPLICATIONS APPROVED, NOT ACCEPTED 10 $149,141 41 $137,288 2 $131,725 APPLICATIONS DENIED 3 $91,600 1 $114,570 2 $94,915 APPLICATIONS WITHDRAWN 4 $195,575 12 $104,284 0 $0 FILES CLOSED FOR INCOMPLETENESS 2 $89,400 1 $55,850 0 $0
Aggregated Statistics For Year 2002(Based on 2 full and 10 partial tracts) A) Conventional B) Refinancings C) Non-occupant Loans on Number Average Value Number Average Value Number Average Value
LOANS ORIGINATED 155 $126,899 206 $122,817 11 $93,821 APPLICATIONS APPROVED, NOT ACCEPTED 17 $129,094 28 $124,531 1 $82,940 APPLICATIONS DENIED 0 $0 0 $0 0 $0 APPLICATIONS WITHDRAWN 3 $107,573 13 $146,378 2 $95,915 FILES CLOSED FOR INCOMPLETENESS 1 $76,260 2 $142,735 0 $0
Aggregated Statistics For Year 2001(Based on 2 full and 10 partial tracts) A) Conventional B) Refinancings C) Non-occupant Loans on Number Average Value Number Average Value Number Average Value
LOANS ORIGINATED 158 $128,792 186 $119,603 6 $88,420 APPLICATIONS APPROVED, NOT ACCEPTED 12 $93,229 32 $126,090 1 $146,200 APPLICATIONS DENIED 1 $47,540 5 $105,878 0 $0 APPLICATIONS WITHDRAWN 4 $115,288 7 $102,909 0 $0 FILES CLOSED FOR INCOMPLETENESS 1 $181,580 3 $109,850 0 $0
Aggregated Statistics For Year 2000(Based on 2 full and 10 partial tracts) A) Conventional B) Refinancings C) Non-occupant Loans on Number Average Value Number Average Value Number Average Value
LOANS ORIGINATED 121 $124,456 36 $103,336 1 $268,380 APPLICATIONS APPROVED, NOT ACCEPTED 10 $113,007 8 $106,690 0 $0 APPLICATIONS DENIED 2 $75,430 0 $0 0 $0 APPLICATIONS WITHDRAWN 0 $0 1 $148,410 0 $0 FILES CLOSED FOR INCOMPLETENESS 1 $132,700 2 $75,930 0 $0
Aggregated Statistics For Year 1999(Based on 1 full and 5 partial tracts) A) Conventional B) Refinancings C) Non-occupant Loans on Number Average Value Number Average Value Number Average Value
LOANS ORIGINATED 72 $117,207 28 $104,136 6 $64,500 APPLICATIONS APPROVED, NOT ACCEPTED 8 $113,402 6 $98,137 0 $0 APPLICATIONS DENIED 1 $102,370 1 $146,700 0 $0 APPLICATIONS WITHDRAWN 0 $0 1 $71,170 0 $0 FILES CLOSED FOR INCOMPLETENESS 0 $0 0 $0 0 $0
2002 - 2018 National Fire Incident Reporting System (NFIRS) incidents See full 2006 National Fire Incident Reporting System statistics for zip code 37849, Tennessee
Most common first names in zip code 37849 among deceased individuals Name Count Lived (average)
James 152 70.0 years William 120 73.0 years Mary 97 78.4 years John 89 75.2 years Charles 78 70.3 years Robert 76 71.3 years George 47 74.1 years Margaret 39 76.8 years Ruth 36 80.9 years Helen 35 77.4 years
Most common last names in zip code 37849 among deceased individuals Last name Count Lived (average)
Smith 53 70.6 years Moore 48 69.8 years Jones 45 80.3 years Davis 44 74.0 years Brown 33 75.0 years Cooper 32 73.8 years Williams 29 77.5 years Johnson 25 71.4 years Baker 24 74.5 years Norman 23 75.3 years
Businesses in zip code 37849
Name Count Name Count
Advance Auto Parts 1 Ruby Tuesday 1 Arby's 1 Starbucks 1 CVS 1 Steak 'n Shake 1 Comfort Inn 1 Subway 1 Dairy Queen 1 Super 8 1 Domino's Pizza 1 True Value 1 FedEx 2 U-Haul 2 Hardee's 1 UPS 2 Holiday Inn 1 Waffle House 1 Little Caesars Pizza 1 Walgreens 1 McDonald's 2 Wendy's 1 Pizza Hut 1
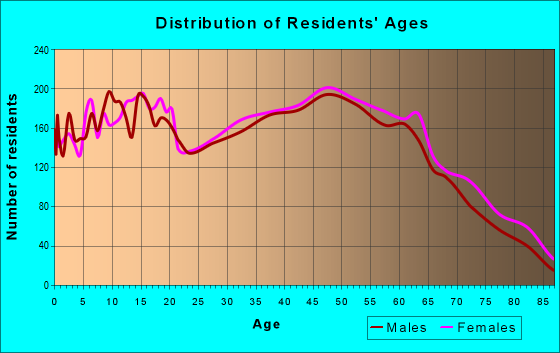
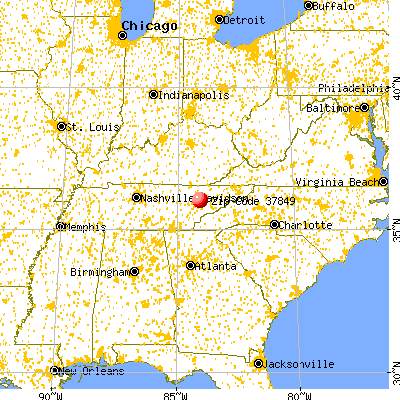


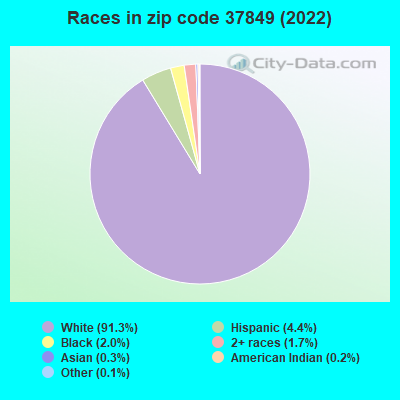


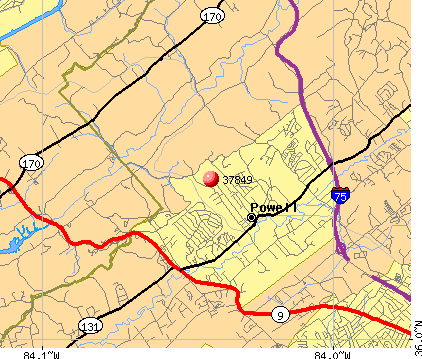 Nearest zip codes: 37912, 37754, 37921, 37909, 37931, 37938.
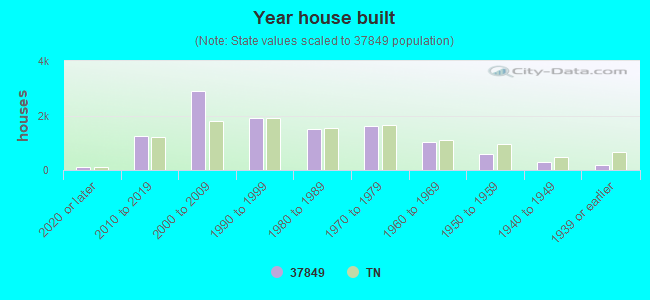

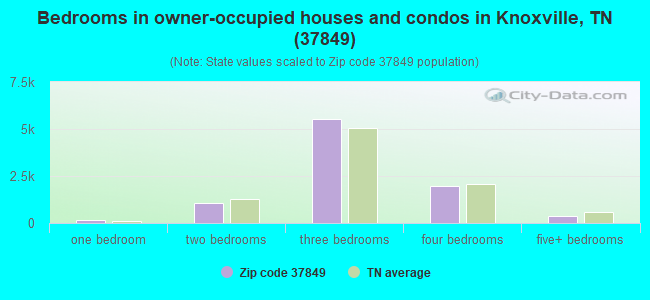
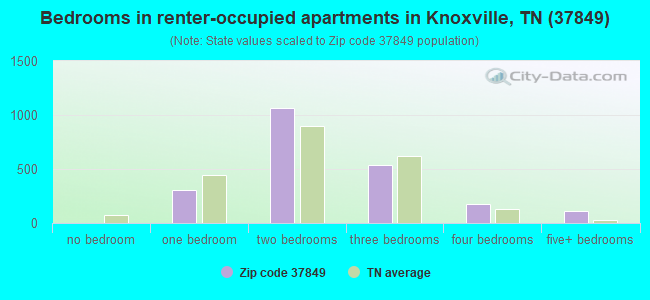
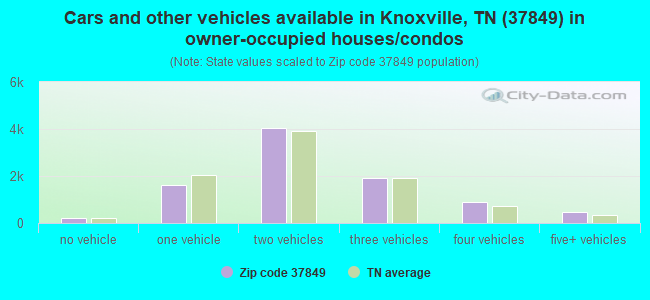
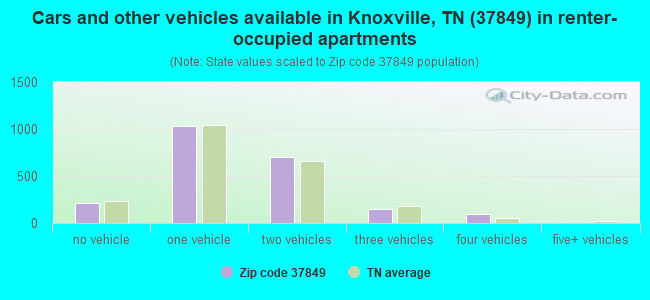


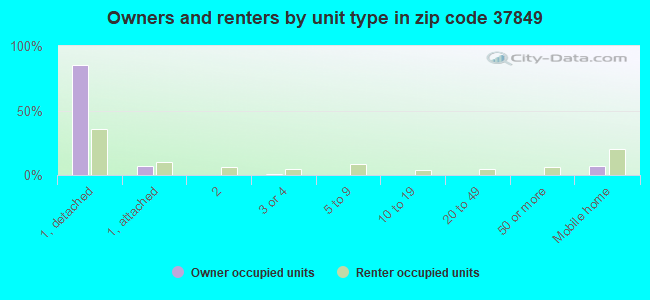
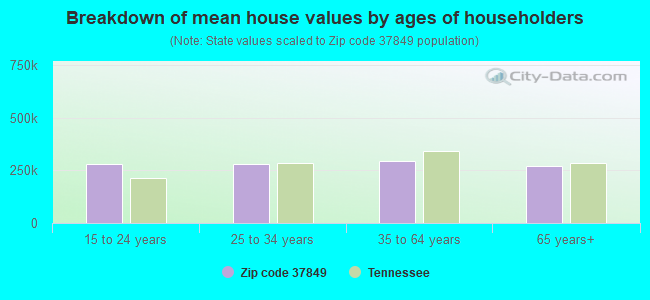


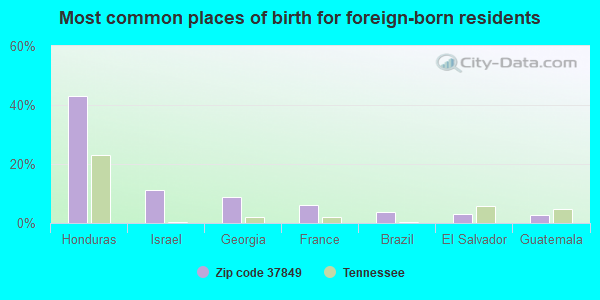
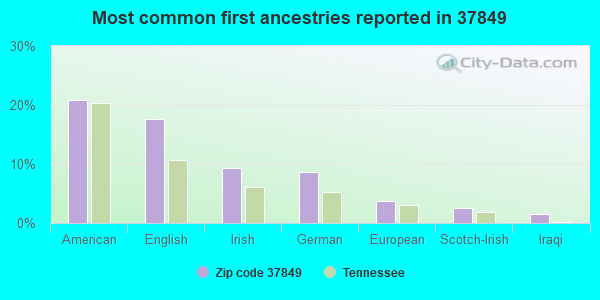
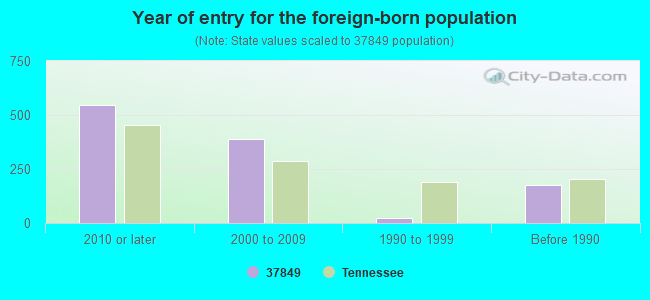


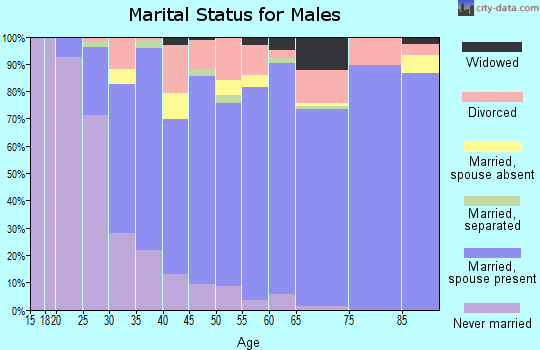
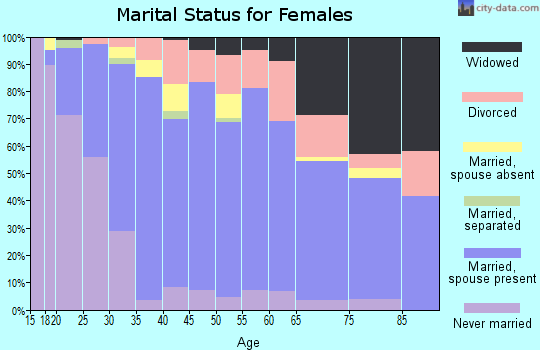
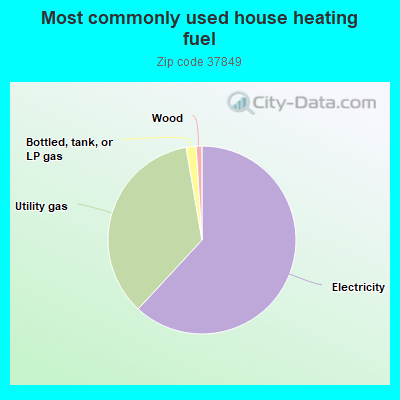
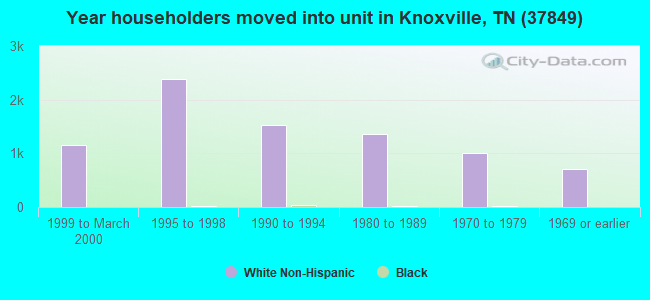
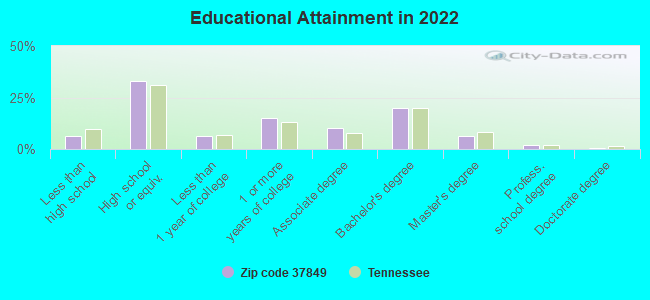
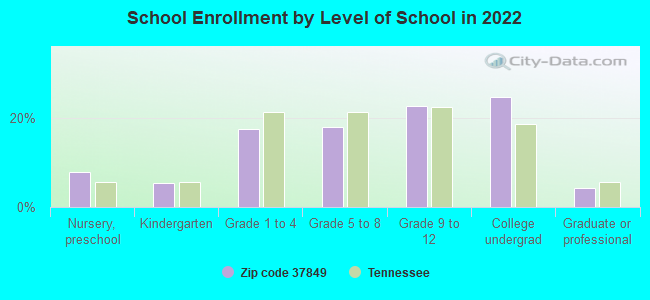
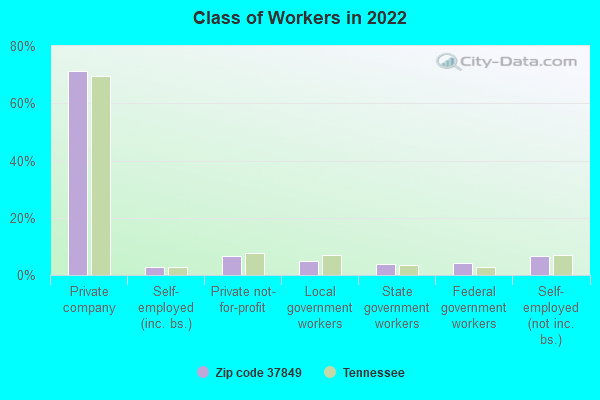
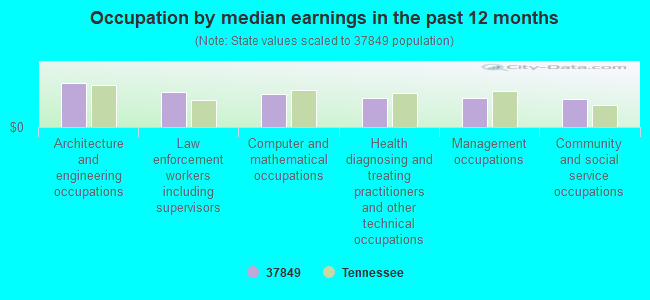


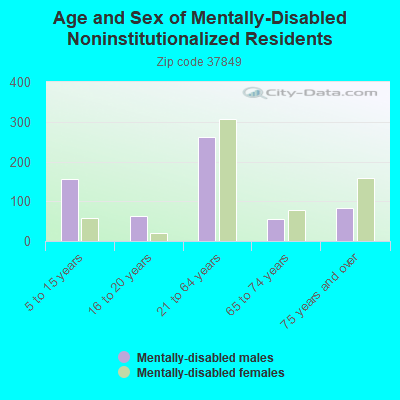
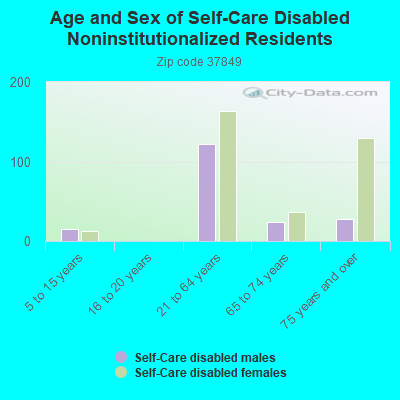
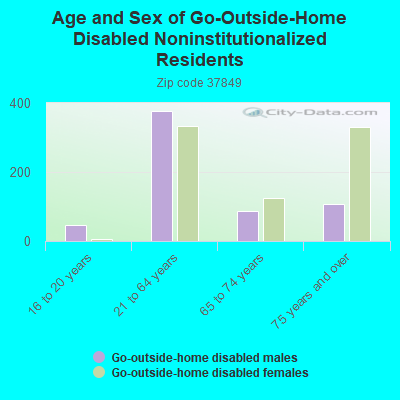

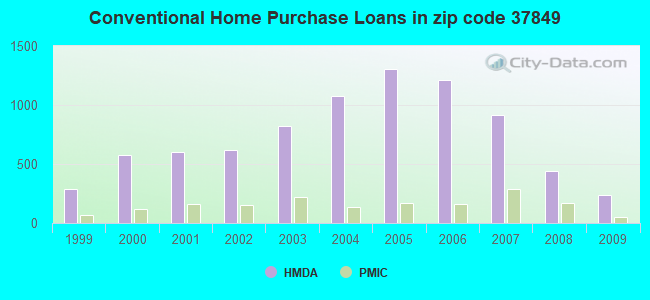
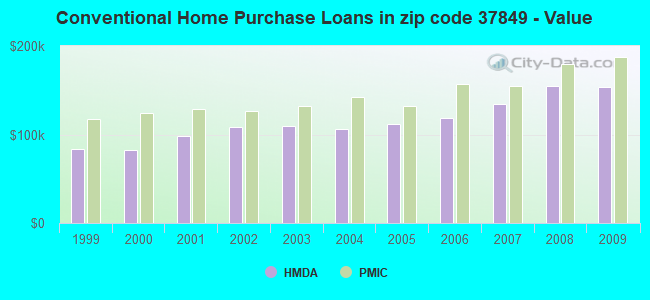
 Based on the data from the years 2002 - 2018 the average number of fire incidents per year is 61. The highest number of reported fires - 118 took place in 2008, and the least - 22 in 2003. The data has a rising trend.
 When looking into fire subcategories, the most incidents belonged to: Outside Fires (40.3%), and Structure Fires (34.8%).