Estimated zip code population in 2022: 22,457 Zip code population in 2010: 20,673 Zip code population in 2000: 18,695
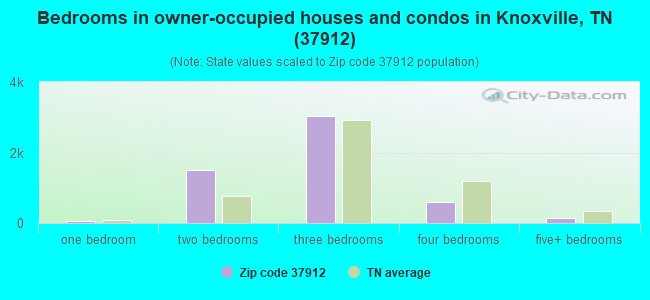
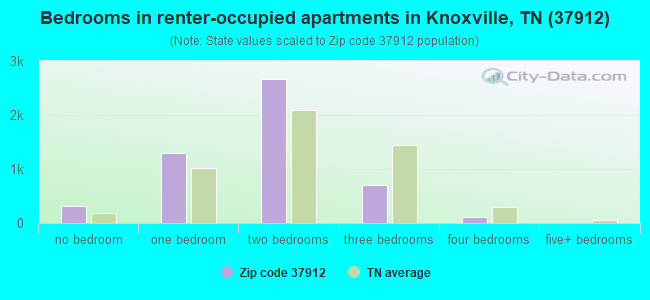
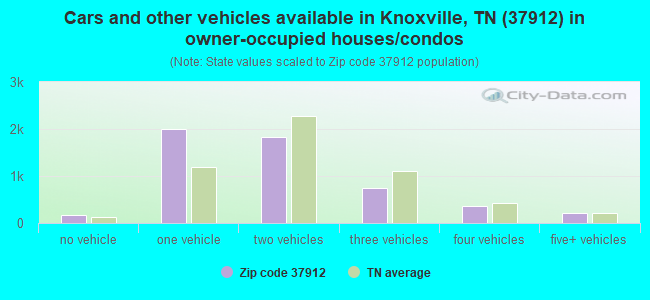
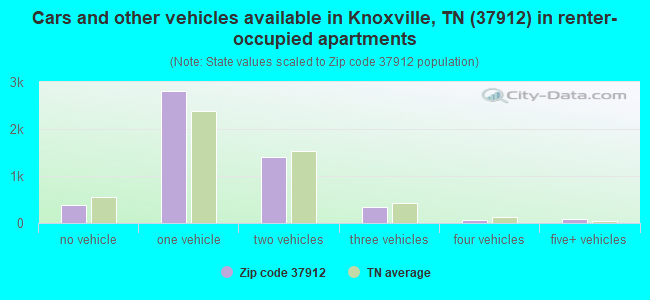
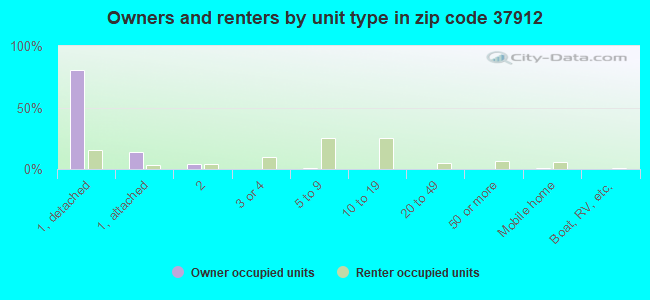
Houses and condos: 11,275 Renter-occupied apartments: 5,037
% of renters here:
49%
State:
33%
March 2022 cost of living index in zip code 37912: 86.8 (less than average, U.S. average is 100)
Land area: 10.8 sq. mi. Water area: 0.0 sq. mi.
Population density: 2,071 people per square mile
(low).
OSM Map
General Map
Google Map
MSN Map
OSM Map
General Map
Google Map
MSN Map
OSM Map
General Map
Google Map
MSN Map
OSM Map
General Map
Google Map
MSN Map
Please wait while loading the map...
Real estate property taxes paid for housing units in 2022:
This zip code:
0.6% ($1,292)
Tennessee:
0.5% ($1,376)
Median real estate property taxes paid for housing units with mortgages in 2022: $1,341 (0.6%) Median real estate property taxes paid for housing units with no mortgage in 2022: $1,209 (0.7%)
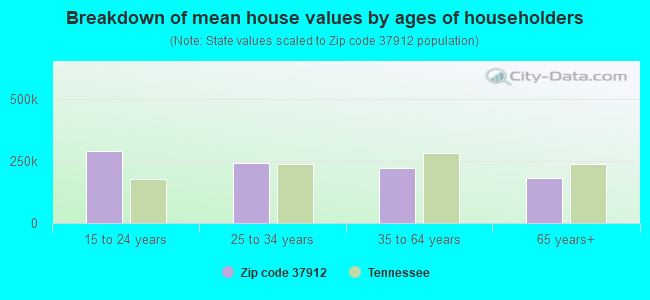
Estimated median house/condo value in 2022: $199,397
37912:
$199,397
Tennessee:
$284,800
According to our research of Tennessee and other state lists, there were 56 registered sex offenders living in 37912 zip code as of April 27, 2024. The ratio of all residents to sex offenders in zip code 37912 is 393 to 1. The ratio of registered sex offenders to all residents in this zip code is near the state average.
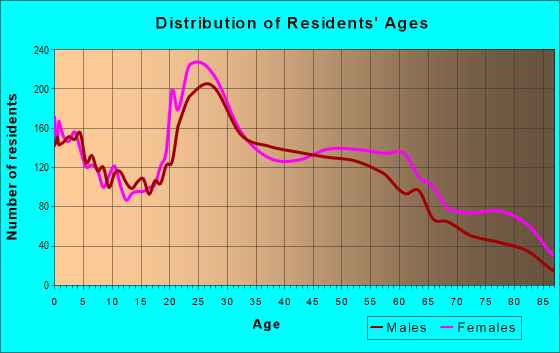
Median resident age:
This zip code:
35.7 years
Tennessee median age:
39.2 years
Average household size:
This zip code:
2.2 people
Tennessee:
2.4 people
Averages for the 2020 tax year for zip code 37912, filed in 2021:
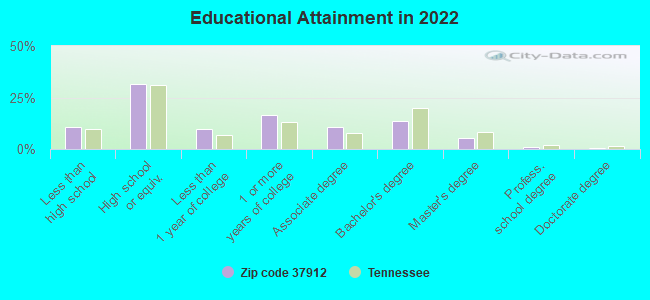
Average Adjusted Gross Income (AGI) in 2020: $41,917 (Individual Income Tax Returns)
Here:
$41,917
State:
$69,014
Salary/wage: $36,881 (reported on 84.9% of returns)
Here:
$36,881
State:
$55,872
(% of AGI for various income ranges: 1208.8% for AGIs below $25k, 3642.9% for AGIs $25k-50k, 6229.3% for AGIs $50k-75k, 9045.8% for AGIs $75k-100k, 16217.1% for AGIs $100k-200k, 39553.3% for AGIs over 200k)
Taxable interest for individuals: $1,067 (reported on 19.5% of returns)
This zip code:
$1,067
Tennessee:
$1,945
(% of AGI for various income ranges: 8.6% for AGIs below $25k, 15.5% for AGIs $25k-50k, 30.6% for AGIs $50k-75k, 54.4% for AGIs $75k-100k, 85.5% for AGIs $100k-200k, 1916.7% for AGIs over 200k)
Ordinary dividends: $3,506 (reported on 8.5% of returns)
Here:
$3,506
State:
$8,105
(% of AGI for various income ranges: 6.7% for AGIs below $25k, 12.7% for AGIs $25k-50k, 49.8% for AGIs $50k-75k, 92.7% for AGIs $75k-100k, 282.9% for AGIs $100k-200k, 1876.7% for AGIs over 200k)
Net capital gain/loss in AGI: +$13,497 (reported on 8.1% of returns)
Here:
+$13,497
State:
+$33,664
(% of AGI for various income ranges: 6.0% for AGIs below $25k, 14.2% for AGIs $25k-50k, 57.6% for AGIs $50k-75k, 91.2% for AGIs $75k-100k, 575.3% for AGIs $100k-200k, 27200.0% for AGIs over 200k)
Profit/loss from business: +$13,530 (reported on 14.0% of returns)
Here:
+$13,530
State:
+$18,991
(% of AGI for various income ranges: 150.5% for AGIs below $25k, 156.2% for AGIs $25k-50k, 224.4% for AGIs $50k-75k, 316.5% for AGIs $75k-100k, 1270.3% for AGIs $100k-200k, 5890.0% for AGIs over 200k)
Taxable individual retirement arrangement distribution: $15,037 (reported on 5.6% of returns)
37912:
$15,037
Tennessee:
$20,036
(% of AGI for various income ranges: 30.9% for AGIs below $25k, 43.4% for AGIs $25k-50k, 103.5% for AGIs $50k-75k, 354.2% for AGIs $75k-100k, 1064.5% for AGIs $100k-200k)
Total itemized deductions: $32,667 (reported on 1.9% of returns)
Here:
$32,667
State:
$40,136
(% of AGI for various income ranges: 39.5% for AGIs $25k-50k, 104.8% for AGIs $50k-75k, 242.1% for AGIs $75k-100k, 839.5% for AGIs $100k-200k)
Charity contributions: $14,950 (reported on 1.6% of returns)
Here:
$14,950
State:
$19,852
(% of AGI for various income ranges: 5.0% for AGIs $25k-50k, 16.2% for AGIs $50k-75k, 92.5% for AGIs $75k-100k, 498.4% for AGIs $100k-200k)
Taxes paid: $4,090 (reported on 1.9% of returns)
37912:
$4,090
State:
$6,038
(% of AGI for various income ranges: 4.1% for AGIs $25k-50k, 12.5% for AGIs $50k-75k, 35.6% for AGIs $75k-100k, 107.4% for AGIs $100k-200k)
Earned income credit: $2,245 (reported on 22.1% of returns)
Here:
$2,245
State:
$2,391
(% of AGI for various income ranges: 99.9% for AGIs below $25k, 62.8% for AGIs $25k-50k, 1.0% for AGIs $50k-75k)
Percentage of individuals using paid preparers for their 2020 taxes: 93.6%
Here:
94%
State:
93%
(% for various income ranges: 92.8% for AGIs below $25k, 95.1% for AGIs $25k-50k, 93.0% for AGIs $50k-75k, 92.8% for AGIs $75k-100k, 93.8% for AGIs $100k-200k, 88.9% for AGIs over 200k)
Averages for the 2012 tax year for zip code 37912, filed in 2013:
Average Adjusted Gross Income (AGI) in 2012: $34,153 (Individual Income Tax Returns)
Here:
$34,153
State:
$53,767
Salary/wage: $30,624 (reported on 85.6% of returns)
Here:
$30,624
State:
$45,421
(% of AGI for various income ranges: 80.1% for AGIs below $25k, 84.5% for AGIs $25k-50k, 78.9% for AGIs $50k-75k, 76.9% for AGIs $75k-100k, 69.9% for AGIs $100k-200k, 23.7% for AGIs over 200k)
Taxable interest for individuals: $1,017 (reported on 20.5% of returns)
This zip code:
$1,017
Tennessee:
$1,732
(% of AGI for various income ranges: 0.8% for AGIs below $25k, 0.5% for AGIs $25k-50k, 0.6% for AGIs $50k-75k, 0.5% for AGIs $75k-100k, 0.6% for AGIs $100k-200k, 1.1% for AGIs over 200k)
Ordinary dividends: $2,844 (reported on 8.9% of returns)
Here:
$2,844
State:
$6,739
(% of AGI for various income ranges: 0.7% for AGIs below $25k, 0.3% for AGIs $25k-50k, 0.6% for AGIs $50k-75k, 0.8% for AGIs $75k-100k, 2.5% for AGIs $100k-200k)
Net capital gain/loss in AGI: +$3,570 (reported on 6.4% of returns)
Here:
+$3,570
State:
+$19,082
(% of AGI for various income ranges: 0.1% for AGIs $25k-50k, 0.4% for AGIs $50k-75k, 0.8% for AGIs $75k-100k, 4.4% for AGIs $100k-200k)
Profit/loss from business: +$11,251 (reported on 13.4% of returns)
Here:
+$11,251
State:
+$15,240
(% of AGI for various income ranges: 8.3% for AGIs below $25k, 2.8% for AGIs $25k-50k, 2.4% for AGIs $50k-75k, 3.1% for AGIs $75k-100k, 9.4% for AGIs $100k-200k)
Taxable individual retirement arrangement distribution: $10,720 (reported on 6.9% of returns)
37912:
$10,720
Tennessee:
$15,505
(% of AGI for various income ranges: 1.5% for AGIs below $25k, 1.5% for AGIs $25k-50k, 2.3% for AGIs $50k-75k, 1.7% for AGIs $75k-100k, 7.0% for AGIs $100k-200k)
Total itemized deductions: $15,580 (25% of AGI, reported on 15.3% of returns)
Here:
$15,580
State:
$21,976
Here:
24.6% of AGI
State:
17.8% of AGI
(% of AGI for various income ranges: 4.7% for AGIs below $25k, 6.8% for AGIs $25k-50k, 7.3% for AGIs $50k-75k, 7.6% for AGIs $75k-100k, 9.5% for AGIs $100k-200k, 8.3% for AGIs over 200k)
Charity contributions: $4,530 (reported on 10.4% of returns)
Here:
$4,530
State:
$6,709
(% of AGI for various income ranges: 0.5% for AGIs below $25k, 1.0% for AGIs $25k-50k, 1.4% for AGIs $50k-75k, 2.0% for AGIs $75k-100k, 4.1% for AGIs $100k-200k)
Taxes paid: $3,171 (reported on 14.9% of returns)
37912:
$3,171
State:
$4,829
(% of AGI for various income ranges: 0.7% for AGIs below $25k, 1.3% for AGIs $25k-50k, 1.5% for AGIs $50k-75k, 1.6% for AGIs $75k-100k, 2.2% for AGIs $100k-200k, 1.6% for AGIs over 200k)
Earned income credit: $2,249 (reported on 25.7% of returns)
Here:
$2,249
State:
$2,404
(% of AGI for various income ranges: 6.9% for AGIs below $25k, 1.1% for AGIs $25k-50k)
Percentage of individuals using paid preparers for their 2012 taxes: 47.3%
Here:
47%
State:
52%
(% for various income ranges: 46.9% for AGIs below $25k, 45.2% for AGIs $25k-50k, 52.1% for AGIs $50k-75k, 46.0% for AGIs $75k-100k, 51.7% for AGIs $100k-200k, 100.0% for AGIs over 200k)
Averages for the 2004 tax year for zip code 37912, filed in 2005:
Average Adjusted Gross Income (AGI) in 2004: $31,769 (Individual Income Tax Returns)
Here:
$31,769
State:
$44,088
Salary/wage: $28,741 (reported on 86.4% of returns)
Here:
$28,741
State:
$38,825
(% of AGI for various income ranges: 94.7% for AGIs below $10k, 81.6% for AGIs $10k-25k, 85.3% for AGIs $25k-50k, 82.6% for AGIs $50k-75k, 82.5% for AGIs $75k-100k, 44.8% for AGIs over 100k)
Taxable interest for individuals: $1,405 (reported on 31.5% of returns)
This zip code:
$1,405
Tennessee:
$1,802
(% of AGI for various income ranges: 2.7% for AGIs below $10k, 1.7% for AGIs $10k-25k, 1.2% for AGIs $25k-50k, 1.2% for AGIs $50k-75k, 1.0% for AGIs $75k-100k, 1.8% for AGIs over 100k)
Taxable dividends: $1,959 (reported on 12.2% of returns)
Here:
$1,959
State:
$3,727
(% of AGI for various income ranges: 1.2% for AGIs below $10k, 0.5% for AGIs $10k-25k, 0.5% for AGIs $25k-50k, 0.6% for AGIs $50k-75k, 0.4% for AGIs $75k-100k, 2.1% for AGIs over 100k)
Net capital gain/loss: +$11,142 (reported on 9.4% of returns)
Here:
+$11,142
State:
+$15,776
(% of AGI for various income ranges: -1.0% for AGIs below $10k, 0.1% for AGIs $10k-25k, 0.4% for AGIs $25k-50k, 1.1% for AGIs $50k-75k, 1.0% for AGIs $75k-100k, 19.7% for AGIs over 100k)
Profit/loss from business: +$6,841 (reported on 13.0% of returns)
Here:
+$6,841
State:
+$12,882
(% of AGI for various income ranges: 3.2% for AGIs below $10k, 3.7% for AGIs $10k-25k, 2.1% for AGIs $25k-50k, 2.6% for AGIs $50k-75k, 2.6% for AGIs $75k-100k, 3.6% for AGIs over 100k)
IRA payment deduction: $2,512 (reported on 1.4% of returns)
37912:
$2,512
Tennessee:
$2,934
Self-employed pension: $5,000 (reported on 0.2% of returns)
Here:
$5,000
Tennessee:
$16,857
Total itemized deductions: $13,297 (23% of AGI, reported on 19.0% of returns)
Here:
$13,297
State:
$18,035
Here:
23.4% of AGI
State:
19.9% of AGI
(% of AGI for various income ranges: 5.3% for AGIs below $10k, 5.7% for AGIs $10k-25k, 8.2% for AGIs $25k-50k, 8.8% for AGIs $50k-75k, 10.1% for AGIs $75k-100k, 8.0% for AGIs over 100k)
Charity contributions deductions: $3,662 (6% of AGI, reported on 15.2% of returns)
Here:
$3,662
State:
$5,167
Here:
6.0% of AGI
State:
5.3% of AGI
(% of AGI for various income ranges: 0.3% for AGIs below $10k, 0.9% for AGIs $10k-25k, 1.3% for AGIs $25k-50k, 2.1% for AGIs $50k-75k, 3.0% for AGIs $75k-100k, 2.8% for AGIs over 100k)
Total tax: $4,022 (reported on 73.8% of returns)
37912:
$4,022
State:
$7,482
(% of AGI for various income ranges: 2.6% for AGIs below $10k, 4.1% for AGIs $10k-25k, 7.3% for AGIs $25k-50k, 9.7% for AGIs $50k-75k, 11.6% for AGIs $75k-100k, 19.6% for AGIs over 100k)
Earned income credit: $1,666 (reported on 19.9% of returns)
Here:
$1,666
State:
$1,826
Percentage of individuals using paid preparers for their 2004 taxes: 54.8%
Here:
55%
State:
60%
(% for various income ranges: 51.1% for AGIs below $10k, 57.0% for AGIs $10k-25k, 54.7% for AGIs $25k-50k, 51.1% for AGIs $50k-75k, 54.2% for AGIs $75k-100k, 76.4% for AGIs over 100k)
Likely homosexual households (counted as self-reported same-sex unmarried-partner households)
Lesbian couples: 0.5% of all households
Gay men: 0.4% of all households
Household received Food Stamps/SNAP in the past 12 months: 1,452 Household did not receive Food Stamps/SNAP in the past 12 months: 8,916
Women who had a birth in the past 12 months: 219 (127 now married, 90 unmarried) Women who did not have a birth in the past 12 months: 6,195 (1,622 now married, 4,570 unmarried)
Housing units in zip code 37912 with a mortgage: 3,291 (249 second mortgage, 8 home equity loan, 234 both second mortgage and home equity loan) Houses without a mortgage: 99
Median monthly owner costs for units with a mortgage: $1,139 Median monthly owner costs for units without a mortgage: $414
Residents with income below the poverty level in 2022:
This zip code:
20.6%
Whole state:
13.3%
Residents with income below 50% of the poverty level in 2022:
This zip code:
13.3%
Whole state:
7.1%
Median number of rooms in houses and condos:
Here:
5.5
State:
6.5
Median number of rooms in apartments:
Here:
3.9
State:
4.4
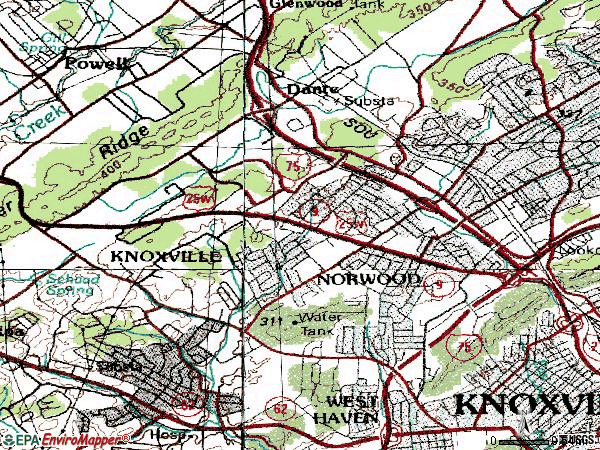
Notable locations in this zip code not listed on our city pages
Shopping Centers: Merchants Village Shopping Center (1), McClain Shopping Center (2), Clinton Plaza Shopping Center (3). Display/hide their locations on the map
Churches in zip code 37912 include: Ridgeview Church (A), Bookwalter United Methodist Church (B), Heritage Baptist Church (C), Inskip Baptist Church (D), Inskip United Methodist Church (E), Northwest Church of God (F), Norwood Church of Christ (G), Norwood United Methodist Church (H), Saint Thomas Episcopal Church (I). Display/hide their locations on the map
1,644 married couples with children.
2,280 single-parent households (1,068 men, 1,212 women).
88.5% of residents of 37912 zip code speak English at home.
7.2% of residents speak Spanish at home (43% very well, 25% well, 29% not well, 2% not at all).
0.4% of residents speak other Indo-European language at home (100% very well).
0.4% of residents speak Asian or Pacific Island language at home (39% very well, 37% well, 24% not well).
4.0% of residents speak other language at home (53% very well, 3% well, 44% not well).
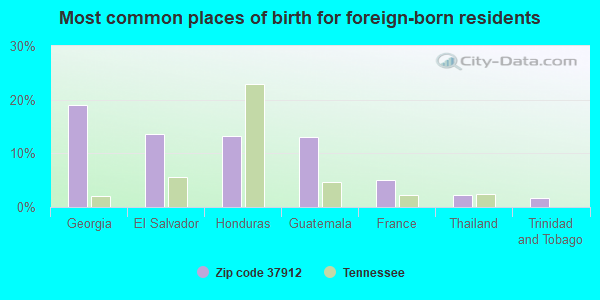
Foreign born population: 2,191 (9.8%) (23.4% of them are naturalized citizens)
Major facilities with environmental interests located in this zip code:
CLAYTON NISSAN INC (4515 CLINTON HIGHWAY in KNOXVILLE, TN)
(Resource Conservation and Recovery Act (tracking hazardous waste)) Business NAICS classification: ALL OTHER AUTOMOTIVE REPAIR AND MAINTENANCE. Organizations: LEE RICKER (CONTACT/OPERATOR)
, JOE CLAYTON (CONTACT/OWNER)
ACCURATE ALUMINUM PRODUCTS (4619-R CENTRAL AVE PIKE in KNOXVILLE, TN)
(Resource Conservation and Recovery Act (tracking hazardous waste)) Business NAICS classification: SHEET METAL WORK MANUFACTURING.
AIR CONTROL FILTER SV CO INC (2005 ALLOR AVENUE in KNOXVILLE, TN)
(Resource Conservation and Recovery Act (tracking hazardous waste)) Business NAICS classification: APPLIANCE REPAIR AND MAINTENANCE.
BULL RUN MACHINE & WLDG CO* (PO BOX 12198 in KNOXVILLE, TN)
(Resource Conservation and Recovery Act (tracking hazardous waste)) Business NAICS classification: FABRICATED STRUCTURAL METAL MANUFACTURING.; OTHER COMMERCIAL AND SERVICE INDUSTRY MACHINERY MANUFACTURING.
BURGIN DODGE INC (4500 CLINTON HIGHWAY in KNOXVILLE, TN)
Small Quantity Generators, between 100 kg and 1000 kg of hazardous waste/month (Resource Conservation and Recovery Act (tracking hazardous waste)) - notification Organizations: ROBERT FRIER (CONTACT/OPERATOR)
, JAMES QUINLAN (CONTACT/OWNER)
BUSCH IRON & STEEL CO INC (PO BOX 12143 in KNOXVILLE, TN)
(Resource Conservation and Recovery Act (tracking hazardous waste)) Business NAICS classification: FABRICATED STRUCTURAL METAL MANUFACTURING.
CANYON, THE (600 EAST INSKIP DR in KNOXVILLE, TN)
ENFORCEMENT/COMPLIANCE ACTIVITY (Integrated Compliance Information System) COMPLIANCE ACTIVITY (Tracking inspections of insecticide, fungicide, and rodenticide, and toxic substances) Business SIC classification: OPERATORS OF APARTMENT BUILDINGS
CLAYTON INDUSTRIES INC (STOCKYARD ROAD in KNOXVILLE, TN)
(Resource Conservation and Recovery Act (tracking hazardous waste)) Business NAICS classification: MANUFACTURED HOME (MOBILE HOME) MANUFACTURING.
CLAYTON MOTORS - VOLVO (5800 CLINTON HWY in KNOXVILLE, TN)
(Resource Conservation and Recovery Act (tracking hazardous waste)) Alternative names: CLAYTON BODYSHOP
CLAYTON MOTORS BODY SHOP, INC. (4601 CLINTON HIGHWAY in KNOXVILLE, TN)
Conditionally Exempt Small Quantity Generators, less than 100 kg/month of hazardous waste (Resource Conservation and Recovery Act (tracking hazardous waste)) - notification Business NAICS classification: ALL OTHER AUTOMOTIVE REPAIR AND MAINTENANCE. Organizations: EDDIE WATSON (CONTACT/OPERATOR)
, JOE CLAYTON (CONTACT/OWNER)
Alternative names: CLAYTON MOTORS INC
COLEMAN CROWN BRIDGE DNTL LAB (4617-1/2 CENTRAL AVE PIKE in KNOXVILLE, TN)
(Resource Conservation and Recovery Act (tracking hazardous waste)) Business NAICS classification: DENTAL LABORATORIES.
COOK'S PEST CONTROL, INC. (P O BOX 12195 4725 CLINTON HWY in KNOXVILLE, TN)
(Resource Conservation and Recovery Act (tracking hazardous waste))
DIVERSIFIED WASTE MANAGEMENT, INC. (6636 CENTRAL AVENUE PIKE in KNOXVILLE, TN)
(Resource Conservation and Recovery Act (tracking hazardous waste))
Housing units lacking complete plumbing facilities: 1.7% Housing units lacking complete kitchen facilities: 2.1%
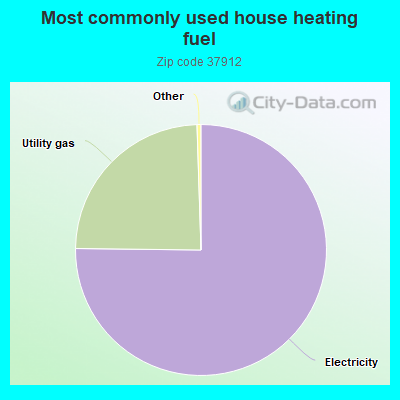
75.2%Electricity
24.3%Utility gas
Population in 1990: 16,919. Population change in the 1990s: +1,776 (+10.5%).
Place of birth for U.S.-born residents:
This state: 12,875
Northeast: 760
Midwest: 1,988
South: 3,758
West: 671
51% of the 37912 zip code residents lived in the same house 5 years ago. Out of people who lived in different houses, 66% lived in this county. Out of people who lived in different counties, 50% lived in Tennessee.
84% of the 37912 zip code residents lived in the same house 1 year ago. Out of people who lived in different houses, 54% moved from this county. Out of people who lived in different houses, 19% moved from different county within same state. Out of people who lived in different houses, 21% moved from different state. Out of people who lived in different houses, 4% moved from abroad.
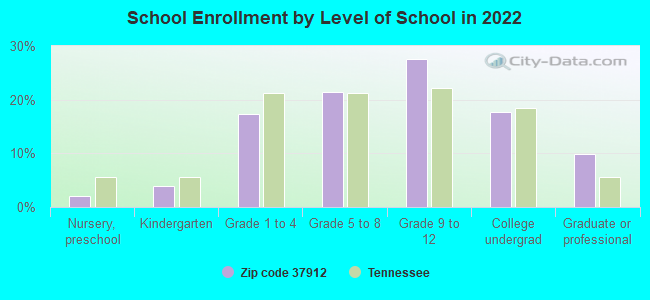
Private vs. public school enrollment:
Students in private schools in grades 1 to 8 (elementary and middle school): 280
Here:
13.5%
Tennessee:
15.0%
Students in private schools in grades 9 to 12 (high school): 18
Here:
1.2%
Tennessee:
16.2%
Students in private undergraduate colleges: 74
Here:
7.8%
Tennessee:
23.5%
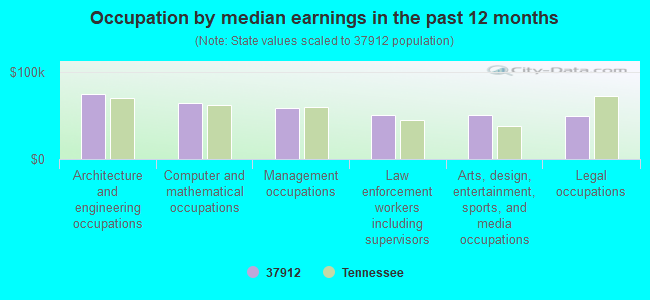
Occupation by median earnings in the past 12 months ($)
74,955Architecture and engineering occupations
64,074Computer and mathematical occupations
58,379Management occupations
50,205Law enforcement workers including supervisors
50,192Arts, design, entertainment, sports, and media occupations
48,965Legal occupations
Companies with federal contracts located in this zip code (KNOXVILLE, TN):
PHILLIPS & JORDAN, INCORPORATE (6621 WILBANKS RD; small business) : $60,295,721 in 37 contractsfrom 2000 to 2006
Contracts for Trash/Garbage Collection Services - Including Portable Sanitation Services, Construction of Structures and Facilities -- Highways, Roads, Streets, Bridges, and Railways (includes resurfacing), Waste Treatment and Storage, Maintenance, Repair or Alteration of Real Property -- Highways, Roads, Streets, Bridges, and Railways (includes resurfacing), and moreby U.S. Army Corps of Engineers - civil program financing only, Army, Animal and Plant Health Inspection Service, Forest Service, and others Signed by year:2000: $495,901; 2001: $373,135; 2002: $999,999; 2003: $668,227; 2004: $15,232,487; 2005: $41,699,457; 2006: $826,515.
Biggest contracts:
$30,598,315 with U.S. Army Corps of Engineers - civil program financing only for Trash/Garbage Collection Services - Including Portable Sanitation Services. Taking place in AL. Signed on 2005-09-05. Completion date: 2005-11-30.
$7,033,202 with U.S. Army Corps of Engineers - civil program financing only for Construction of Structures and Facilities -- Highways, Roads, Streets, Bridges, and Railways (includes resurfacing). Taking place in FL. Signed on 2004-10-16. Completion date: 2004-10-06.
$3,574,470 with U.S. Army Corps of Engineers - civil program financing only for Trash/Garbage Collection Services - Including Portable Sanitation Services. Taking place in AL. Signed on 2005-09-30. Completion date: 2005-11-30.
$3,065,101, same as above.Signed on 2005-09-28. Completion date: 2005-11-30.
OMEGA HOSPITALITY (118 MERCHANT DRIVE) : $401,866 in 6 contractsfrom 1999 to 2001
Contracts for Lodging - Hotel/Motel by Army Signed by year:2000: $142,412; 2001: $155,882; 2002: $0; 2003: $0; 2004: $0; 2005: $0; 2006: $0.
Biggest contracts:
$87,446 with Army for Lodging - Hotel/Motel. Signed on 2001-04-13. Completion date: 1999-04-30.
$72,131, same as above.Signed on 2000-04-04. Completion date: 2000-06-30.
$70,281, same as above.Signed on 2000-06-26. Completion date: 2000-09-30.
$68,436, same as above.Signed on 2001-01-10. Completion date: 2001-03-31.
AVISCO, INC. (6621 WILBANKSROAD) : $222,797 in 2 contractsin 2000
$175,080 with Army for Construction of Structures and Facilities -- Other Non-Building Facilities. Taking place in IL. Signed on 2000-03-17. Completion date: 2000-11-01.
$47,717, same as above.Signed on 2000-01-21. Completion date: 2000-11-01.
SUNBELT PRODUCTS INC (6714 CLINTON HWY; small business)
$53,064 with Army for Miscellaneous Prefabricated Structures. Signed on 2004-09-24. Completion date: 2004-11-08.
CONCRETE CUTTING SYSTEMS, INC (1721 CALLAHAN RD SUITE C; small business) : $27,480 in 4 contractsfrom 2002 to 2004
$15,250 with U.S. Army Corps of Engineers - civil program financing only for Maintenance, Repair and Rebuilding of Equipment -- Special Industry Machinery. Signed on 2002-10-09. Completion date: 2002-10-09.
$9,450 with Army for Lease or Rental of Equipment -- Construction, Mining, Excavating, and Highway Maintenance Equipment. Signed on 2004-01-12. Completion date: 2004-01-07.
$9,450 with U.S. Army Corps of Engineers - civil program financing only for Lease or Rental of Equipment -- Construction, Mining, Excavating, and Highway Maintenance Equipment. Signed on 2004-01-12. Completion date: 2004-01-07.
-$6,670, same as above.Signed on 2002-11-13. Completion date: 2002-10-09.
TENNESSEE BOILER REPAIR SERVIC (1725 CALLAHAN DR; small business)
$12,508 with Army for Maintenance, Repair or Alteration of Real Property -- Other Administrative Facilities and Service Buildings. Taking place in KY. Signed on 2000-09-30. Completion date: 2000-01-31.
OWEN-FREEMAN, CONSTANCE R (5610 WALLWOOD RD; small business)
$5,532 with Army for Custodial Janitorial Services. Signed on 2005-09-14. Completion date: 2006-09-14.
Top industries in this zip code by the number of employees in 2005:
2002 - 2018 National Fire Incident Reporting System (NFIRS) incidents
According to the data from the years 2002 - 2018 the average number of fire incidents per year is 98. The highest number of reported fires - 132 took place in 2007, and the least - 63 in 2017. The data has a decreasing trend.
When looking into fire subcategories, the most incidents belonged to: Outside Fires (49.0%), and Structure Fires (28.1%).
Fire incident types reported to NFIRS in Zip Code 37912


 Nearest zip codes: 37921, 37909, 37917, 37916, 37849, 37902.
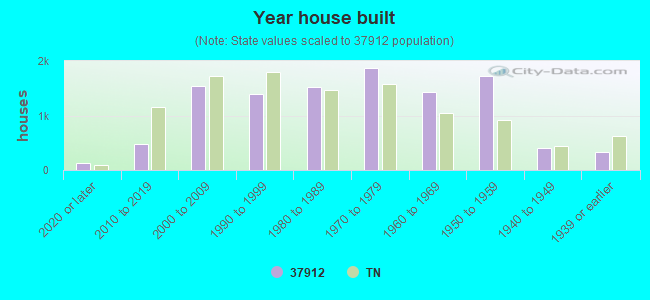


 According to the data from the years 2002 - 2018 the average number of fire incidents per year is 98. The highest number of reported fires - 132 took place in 2007, and the least - 63 in 2017. The data has a decreasing trend.
 When looking into fire subcategories, the most incidents belonged to: Outside Fires (49.0%), and Structure Fires (28.1%).