Estimated zip code population in 2022: 2,427 Zip code population in 2010: 1,586 Zip code population in 2000: 1,241
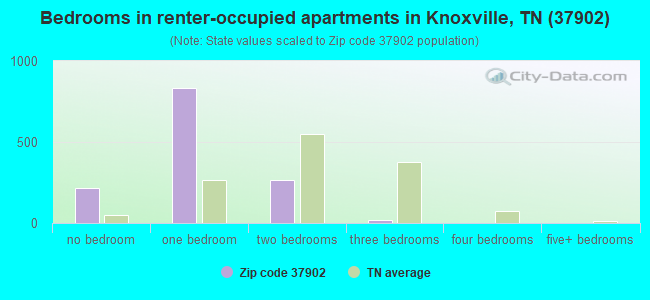
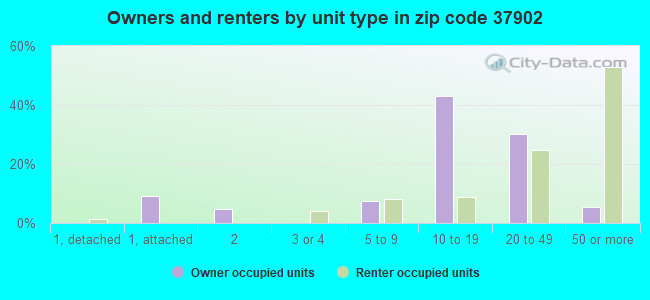
Houses and condos: 1,940 Renter-occupied apartments: 1,298
% of renters here:
80%
State:
33%
March 2022 cost of living index in zip code 37902: 92.3 (less than average, U.S. average is 100)
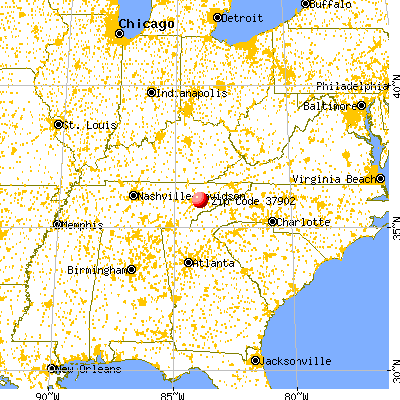
Land area: 0.5 sq. mi. Water area: 0.0 sq. mi.
Population density: 5,210 people per square mile
(average).
OSM Map
General Map
Google Map
MSN Map
OSM Map
General Map
Google Map
MSN Map
OSM Map
General Map
Google Map
MSN Map
OSM Map
General Map
Google Map
MSN Map
Please wait while loading the map...
Real estate property taxes paid for housing units in 2022:
This zip code:
0.7% ($4,306)
Tennessee:
0.5% ($1,376)
Median real estate property taxes paid for housing units with mortgages in 2022: $3,802 (0.6%) Median real estate property taxes paid for housing units with no mortgage in 2022: $4,795 (0.8%)
Averages for the 2020 tax year for zip code 37902, filed in 2021:
Average Adjusted Gross Income (AGI) in 2020: $157,472 (Individual Income Tax Returns)
Here:
$157,472
State:
$69,014
Salary/wage: $103,719 (reported on 85.5% of returns)
Here:
$103,719
State:
$55,872
(% of AGI for various income ranges: 1136.5% for AGIs below $25k, 4078.2% for AGIs $25k-50k, 6779.2% for AGIs $50k-75k, 10108.8% for AGIs $75k-100k, 20630.0% for AGIs $100k-200k, 110446.0% for AGIs over 200k)
Taxable interest for individuals: $2,821 (reported on 35.5% of returns)
This zip code:
$2,821
Tennessee:
$1,945
(% of AGI for various income ranges: 3.9% for AGIs below $25k, 11.2% for AGIs $25k-50k, 50.0% for AGIs $50k-75k, 105.0% for AGIs $75k-100k, 382.5% for AGIs $100k-200k, 1244.0% for AGIs over 200k)
Ordinary dividends: $9,595 (reported on 33.6% of returns)
Here:
$9,595
State:
$8,105
(% of AGI for various income ranges: 45.2% for AGIs below $25k, 28.8% for AGIs $25k-50k, 245.0% for AGIs $50k-75k, 235.0% for AGIs $75k-100k, 588.8% for AGIs $100k-200k, 4888.0% for AGIs over 200k)
Net capital gain/loss in AGI: +$44,379 (reported on 30.9% of returns)
Here:
+$44,379
State:
+$33,664
(% of AGI for various income ranges: 50.0% for AGIs below $25k, 52.9% for AGIs $25k-50k, 84.2% for AGIs $50k-75k, 45.0% for AGIs $75k-100k, 748.8% for AGIs $100k-200k, 28296.0% for AGIs over 200k)
Profit/loss from business: +$36,333 (reported on 19.1% of returns)
Here:
+$36,333
State:
+$18,991
(% of AGI for various income ranges: 43.5% for AGIs below $25k, 332.9% for AGIs $25k-50k, 359.2% for AGIs $50k-75k, 1851.2% for AGIs $100k-200k, 10104.0% for AGIs over 200k)
Taxable individual retirement arrangement distribution: $24,738 (reported on 7.3% of returns)
37902:
$24,738
Tennessee:
$20,036
(% of AGI for various income ranges: 182.4% for AGIs $25k-50k, 2086.2% for AGIs $100k-200k)
Total itemized deductions: $48,645 (reported on 10.0% of returns)
Here:
$48,645
State:
$40,136
(% of AGI for various income ranges: 694.2% for AGIs $50k-75k, 1015.0% for AGIs $100k-200k, 7412.0% for AGIs over 200k)
Charity contributions: $27,812 (reported on 7.3% of returns)
Here:
$27,812
State:
$19,852
(% of AGI for various income ranges: 371.2% for AGIs $75k-100k, 3856.0% for AGIs over 200k)
Taxes paid: $6,973 (reported on 10.0% of returns)
37902:
$6,973
State:
$6,038
(% of AGI for various income ranges: 90.8% for AGIs $50k-75k, 172.5% for AGIs $100k-200k, 1040.0% for AGIs over 200k)
Earned income credit: $700 (reported on 9.1% of returns)
Here:
$700
State:
$2,391
(% of AGI for various income ranges: 30.4% for AGIs below $25k)
Percentage of individuals using paid preparers for their 2020 taxes: 93.6%
Here:
94%
State:
93%
(% for various income ranges: 90.0% for AGIs below $25k, 95.5% for AGIs $25k-50k, 93.8% for AGIs $50k-75k, 100.0% for AGIs $75k-100k, 93.8% for AGIs $100k-200k, 93.3% for AGIs over 200k)
Averages for the 2012 tax year for zip code 37902, filed in 2013:
Average Adjusted Gross Income (AGI) in 2012: $103,728 (Individual Income Tax Returns)
Here:
$103,728
State:
$53,767
Salary/wage: $71,120 (reported on 84.1% of returns)
Here:
$71,120
State:
$45,421
(% of AGI for various income ranges: 86.3% for AGIs below $25k, 88.7% for AGIs $25k-50k, 76.3% for AGIs $50k-75k, 78.3% for AGIs $75k-100k, 70.2% for AGIs $100k-200k, 44.5% for AGIs over 200k)
Taxable interest for individuals: $4,307 (reported on 34.1% of returns)
This zip code:
$4,307
Tennessee:
$1,732
(% of AGI for various income ranges: 0.6% for AGIs below $25k, 0.3% for AGIs $25k-50k, 1.2% for AGIs $50k-75k, 0.4% for AGIs $75k-100k, 0.4% for AGIs $100k-200k, 2.0% for AGIs over 200k)
Ordinary dividends: $12,318 (reported on 25.0% of returns)
Here:
$12,318
State:
$6,739
(% of AGI for various income ranges: 3.4% for AGIs below $25k, 0.9% for AGIs $25k-50k, 3.2% for AGIs $50k-75k, 2.4% for AGIs $100k-200k, 3.6% for AGIs over 200k)
Net capital gain/loss in AGI: +$102,273 (reported on 17.0% of returns)
Here:
+$102,273
State:
+$19,082
(% of AGI for various income ranges: 1.3% for AGIs $50k-75k, 1.9% for AGIs $100k-200k, 27.0% for AGIs over 200k)
Profit/loss from business: +$39,256 (reported on 20.5% of returns)
Here:
+$39,256
State:
+$15,240
(% of AGI for various income ranges: 9.1% for AGIs below $25k, 7.6% for AGIs $25k-50k, 10.9% for AGIs $50k-75k, 11.8% for AGIs $100k-200k, 7.1% for AGIs over 200k)
Taxable individual retirement arrangement distribution: $18,700 (reported on 6.8% of returns)
37902:
$18,700
Tennessee:
$15,505
Total itemized deductions: $36,072 (13% of AGI, reported on 28.4% of returns)
Here:
$36,072
State:
$21,976
Here:
13.3% of AGI
State:
17.8% of AGI
(% of AGI for various income ranges: 9.1% for AGIs below $25k, 6.3% for AGIs $25k-50k, 11.0% for AGIs $50k-75k, 9.8% for AGIs $75k-100k, 12.8% for AGIs $100k-200k, 9.6% for AGIs over 200k)
Charity contributions: $10,632 (reported on 21.6% of returns)
Here:
$10,632
State:
$6,709
(% of AGI for various income ranges: 0.9% for AGIs below $25k, 1.2% for AGIs $50k-75k, 1.3% for AGIs $75k-100k, 2.2% for AGIs $100k-200k, 2.8% for AGIs over 200k)
Taxes paid: $7,456 (reported on 28.4% of returns)
37902:
$7,456
State:
$4,829
(% of AGI for various income ranges: 1.8% for AGIs $25k-50k, 2.2% for AGIs $50k-75k, 3.2% for AGIs $75k-100k, 3.1% for AGIs $100k-200k, 1.8% for AGIs over 200k)
Earned income credit: $475 (reported on 9.1% of returns)
Here:
$475
State:
$2,404
(% of AGI for various income ranges: 1.0% for AGIs below $25k)
Percentage of individuals using paid preparers for their 2012 taxes: 38.6%
Here:
39%
State:
52%
(% for various income ranges: 34.4% for AGIs below $25k, 23.8% for AGIs $25k-50k, 33.3% for AGIs $50k-75k, 50.0% for AGIs $75k-100k, 55.6% for AGIs $100k-200k, 75.0% for AGIs over 200k)
Averages for the 2004 tax year for zip code 37902, filed in 2005:
Average Adjusted Gross Income (AGI) in 2004: $61,964 (Individual Income Tax Returns)
Here:
$61,964
State:
$44,088
Salary/wage: $37,409 (reported on 85.5% of returns)
Here:
$37,409
State:
$38,825
(% of AGI for various income ranges: 161.1% for AGIs below $10k, 83.7% for AGIs $10k-25k, 86.4% for AGIs $25k-50k, 86.3% for AGIs $50k-75k, 63.7% for AGIs $75k-100k, 32.3% for AGIs over 100k)
Taxable interest for individuals: $11,071 (reported on 32.5% of returns)
This zip code:
$11,071
Tennessee:
$1,802
(% of AGI for various income ranges: 2.4% for AGIs below $10k, 2.7% for AGIs $10k-25k, 0.6% for AGIs $25k-50k, 1.1% for AGIs $50k-75k, 0.6% for AGIs $75k-100k, 8.5% for AGIs over 100k)
Taxable dividends: $6,153 (reported on 24.7% of returns)
Here:
$6,153
State:
$3,727
(% of AGI for various income ranges: 6.9% for AGIs below $10k, 2.2% for AGIs $10k-25k, 0.6% for AGIs $25k-50k, 1.6% for AGIs $50k-75k, 1.8% for AGIs $75k-100k, 2.9% for AGIs over 100k)
Net capital gain/loss: +$5,374 (reported on 19.1% of returns)
Here:
+$5,374
State:
+$15,776
(% of AGI for various income ranges: -1.1% for AGIs $10k-25k, -0.3% for AGIs $25k-50k, 0.3% for AGIs $50k-75k, 2.8% for AGIs over 100k)
Profit/loss from business: +$60,147 (reported on 14.3% of returns)
Here:
+$60,147
State:
+$12,882
(% of AGI for various income ranges: 10.4% for AGIs below $10k, 0.6% for AGIs $10k-25k, 2.8% for AGIs $25k-50k, 5.5% for AGIs $50k-75k, 20.3% for AGIs over 100k)
Total itemized deductions: $24,980 (15% of AGI, reported on 21.2% of returns)
Here:
$24,980
State:
$18,035
Here:
14.8% of AGI
State:
19.9% of AGI
(% of AGI for various income ranges: 41.6% for AGIs below $10k, 9.3% for AGIs $25k-50k, 12.2% for AGIs $50k-75k, 12.3% for AGIs $75k-100k, 7.7% for AGIs over 100k)
Charity contributions deductions: $8,641 (4% of AGI, reported on 16.4% of returns)
Here:
$8,641
State:
$5,167
Here:
4.3% of AGI
State:
5.3% of AGI
Total tax: $15,240 (reported on 76.1% of returns)
37902:
$15,240
State:
$7,482
(% of AGI for various income ranges: 4.3% for AGIs below $10k, 5.4% for AGIs $10k-25k, 10.4% for AGIs $25k-50k, 12.9% for AGIs $50k-75k, 16.5% for AGIs $75k-100k, 23.3% for AGIs over 100k)
Earned income credit: $520 (reported on 15.7% of returns)
Here:
$520
State:
$1,826
Percentage of individuals using paid preparers for their 2004 taxes: 46.3%
Here:
46%
State:
60%
(% for various income ranges: 39.8% for AGIs below $10k, 36.6% for AGIs $10k-25k, 44.9% for AGIs $25k-50k, 45.3% for AGIs $50k-75k, 63.6% for AGIs $75k-100k, 85.7% for AGIs over 100k)
Likely homosexual households (counted as self-reported same-sex unmarried-partner households)
Lesbian couples: 0.0% of all households
Gay men: 1.1% of all households
Household received Food Stamps/SNAP in the past 12 months: 159 Household did not receive Food Stamps/SNAP in the past 12 months: 1,463
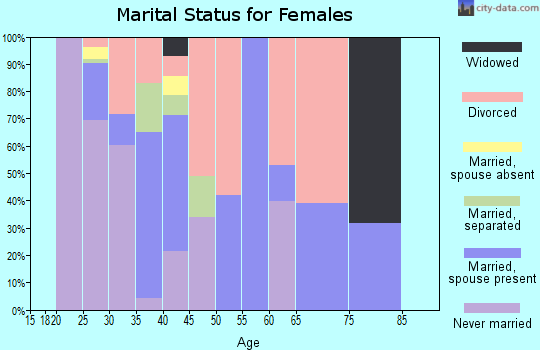
Women who did not have a birth in the past 12 months: 552 (133 now married, 418 unmarried)
Housing units in zip code 37902 with a mortgage: 203 (22 second mortgage, 22 both second mortgage and home equity loan) Median monthly owner costs for units with a mortgage: $2,598 Median monthly owner costs for units without a mortgage: $998
Residents with income below the poverty level in 2022:
This zip code:
18.6%
Whole state:
13.3%
Residents with income below 50% of the poverty level in 2022:
This zip code:
9.6%
Whole state:
7.1%
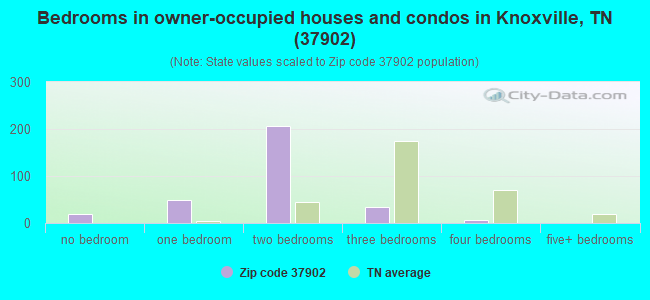
Median number of rooms in houses and condos:
Here:
3.9
State:
6.5
Median number of rooms in apartments:
Here:
2.7
State:
4.4
Notable locations in this zip code not listed on our city pages
Notable locations in zip code 37902: L N Station (A), Southern Station (B), Tennessee Amphitheater (C), Knoxville City Hall (D), Knox County Courthouse (E), Knoxville City Administration (F), Knoxville Fire Department Headquarters (G). Display/hide their locations on the map
Churches in zip code 37902 include: Church Street United Methodist Church (A), First Baptist Church of Knoxville (B), First Presbyterian Church (C), Immaculate Conception Catholic Church (D), Saint Johns Episcopal Church (E). Display/hide their locations on the map
In group quarters: 237 (-1 institutionalized population)
Size of family households: 379 2-persons, 16 3-persons, 8 4-persons
Size of nonfamily households: 1,050 1-person, 160 2-persons
16 married couples with children.
53 single-parent households (16 men, 37 women).
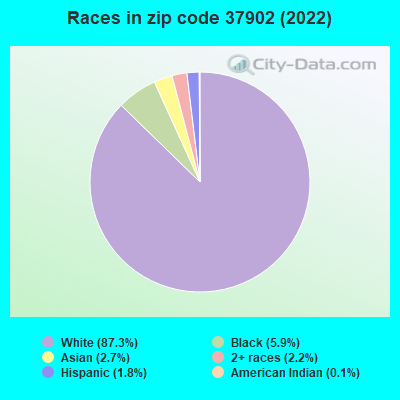
95.6% of residents of 37902 zip code speak English at home.
1.0% of residents speak Spanish at home (80% very well, 8% well, 12% not well).
0.6% of residents speak other Indo-European language at home (100% very well).
2.4% of residents speak Asian or Pacific Island language at home (62% very well, 38% well).
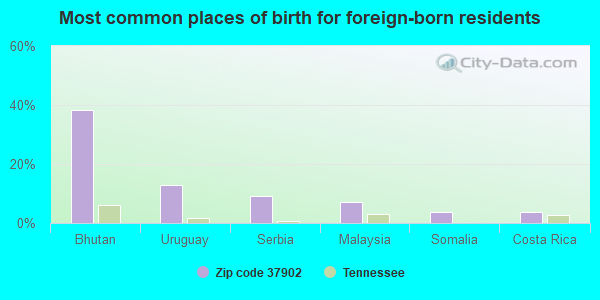
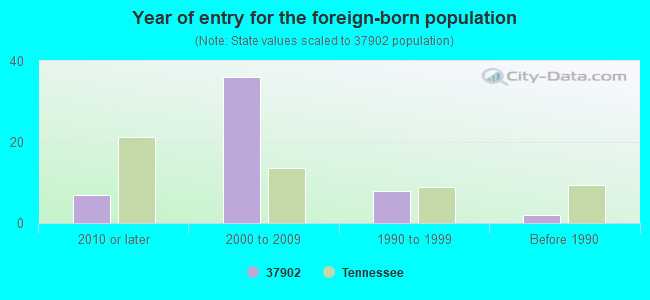
Foreign born population: 55 (2.3%) (69.5% of them are naturalized citizens)
Facilities with environmental interests located in this zip code:
BUSINESS TELECOM, INC. (BTI) (625 GAY STREET, SUITE 520 in KNOXVILLE, TN)
ENFORCEMENT/COMPLIANCE ACTIVITY (Integrated Compliance Information System) - ICIS-04-2003-9973, FORMAL ENFORCEMENT ACTION (Integrated Compliance Information System) - ICIS-04-2003-9973, FORMAL ENFORCEMENT ACTION
BUILDING COMPNT MACHRY CO INC (402 WEST JACKSON in KNOXVILLE, TN)
(Resource Conservation and Recovery Act (tracking hazardous waste)) Business NAICS classification: PLATE WORK MANUFACTURING.
CENTRAL VETERINARY HOSPITAL (1004 W MAIN ST in KNOXVILLE, TN)
(Resource Conservation and Recovery Act (tracking hazardous waste))
COFFEY DENTAL LABORATORY (172 N T50 in KNOXVILLE, TN)
(Resource Conservation and Recovery Act (tracking hazardous waste)) Business NAICS classification: DENTAL LABORATORIES.
DIFTLERS JEWELERS (503 MARKET ST in KNOXVILLE, TN)
(Resource Conservation and Recovery Act (tracking hazardous waste)) Business NAICS classification: JEWELRY (EXCEPT COSTUME) MANUFACTURING.
Housing units lacking complete plumbing facilities: 0.6% Housing units lacking complete kitchen facilities: 0.6%
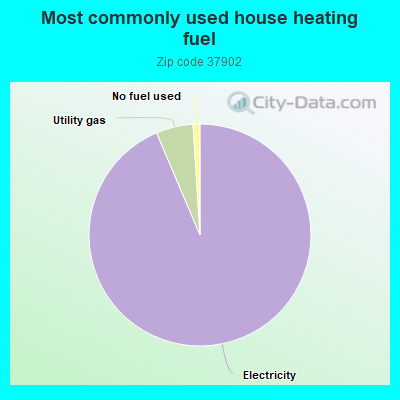
93.7%Electricity
5.4%Utility gas
1.0%No fuel used
Population in 1990: 1,457.
Place of birth for U.S.-born residents:
This state: 984
Northeast: 222
Midwest: 331
South: 769
West: 76
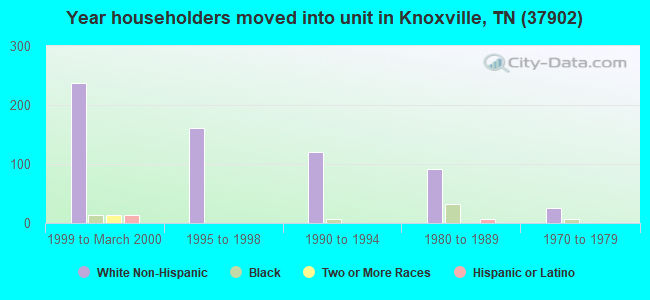
45% of the 37902 zip code residents lived in the same house 5 years ago. Out of people who lived in different houses, 47% lived in this county. Out of people who lived in different counties, 50% lived in Tennessee.
63% of the 37902 zip code residents lived in the same house 1 year ago. Out of people who lived in different houses, 45% moved from this county. Out of people who lived in different houses, 27% moved from different county within same state. Out of people who lived in different houses, 23% moved from different state.
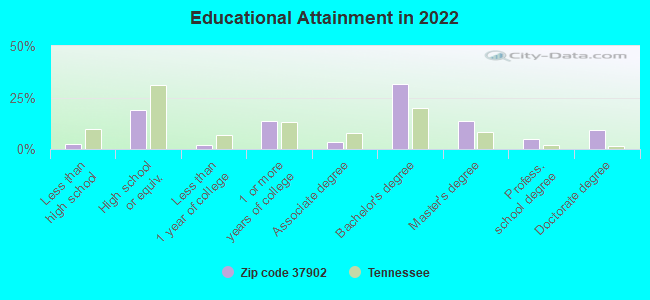
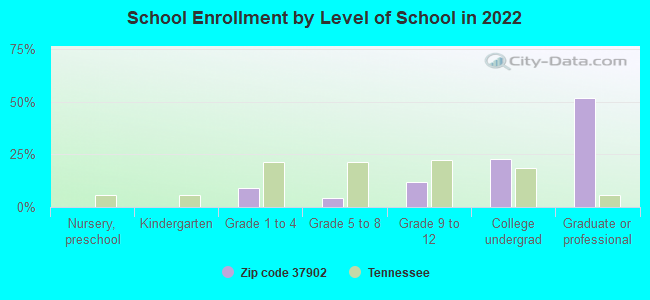
Private vs. public school enrollment:
Students in private schools in grades 1 to 8 (elementary and middle school): 16
Here:
33.2%
Tennessee:
15.0%
Students in private schools in grades 9 to 12 (high school):
Here:
0.0%
Tennessee:
16.2%
Students in private undergraduate colleges:
Here:
0.0%
Tennessee:
23.5%
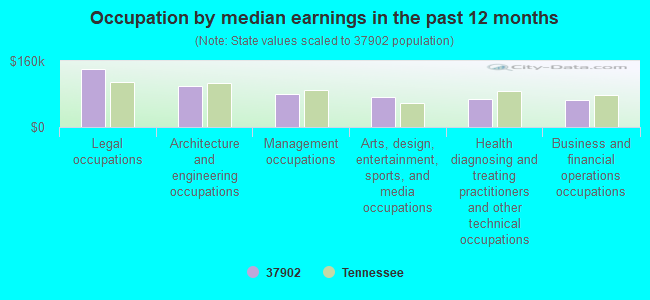
Occupation by median earnings in the past 12 months ($)
140,094Legal occupations
98,988Architecture and engineering occupations
80,023Management occupations
73,423Arts, design, entertainment, sports, and media occupations
68,757Health diagnosing and treating practitioners and other technical occupations
66,021Business and financial operations occupations
Companies with federal contracts located in this zip code (KNOXVILLE, TN):
TENNESSEE VALLEY AUTHORITY (400 WEST SUMMIT HILL DR; small business) : $62,211,471 in 53 contractsfrom 1999 to 2006
Contracts for Electric Services, Engineering and Technical Services, Maintenance, Repair or Alteration of Real Property -- Office Buildings by Air Force, Army, Public Buildings Service Signed by year:2000: $455,372; 2001: $13,498,682; 2002: $14,140,828; 2003: $2,995,105; 2004: $14,509,907; 2005: $16,206,933; 2006: $99,180.
Biggest contracts:
$2,557,869 with Air Force for Electric Services. Signed on 2004-06-01. Completion date: 2004-09-30.
$2,323,992, same as above.Signed on 2002-09-26. Completion date: 2002-10-25.
$2,119,787, same as above.Signed on 2004-04-01. Completion date: 2004-09-30.
$2,093,856, same as above.Signed on 2004-07-01. Completion date: 2004-09-30.
SECURITY WALLS LLC (104 W SUMMIT HILL DR; small business) : $1,906,716 in 13 contractsfrom 2004 to 2006
Contracts for Other Professional Services, Other Administrative Support Services, Miscellaneous Service and Trade Equipment, Nursing Services, and moreby Defense Threat Reduction Agency, Army, ENERGY, Department of, Indian Affairs (Assistant Secretary), and others Signed by year:2000: $0; 2001: $0; 2002: $0; 2003: $0; 2004: $164,338; 2005: $266,650; 2006: $1,475,728.
Biggest contracts:
$1,374,396 with Defense Threat Reduction Agency for Other Professional Services. Taking place in VA. Signed on 2006-03-20. Completion date: 2007-03-31.
$219,022 with Army for Other Administrative Support Services. Taking place in GA. Signed on 2005-09-23. Completion date: 2006-09-29.
$164,338 with Army for Miscellaneous Service and Trade Equipment. Taking place in GA. Signed on 2004-10-01. Completion date: 2005-09-29.
$101,331 with ENERGY, Department of for Nursing Services. Signed on 2006-07-06. Effective on 2006-07-10. Completion date: 2007-07-09.
META ENTERPRISES, LLC (500 W SUMMIT HILL; small business) : $63,325 in 2 contractsfrom 2004 to 2005
$60,000 with Food and Drug Administration for Printing, Duplicating, and Bookbinding Equipment. Signed on 2004-03-04. Completion date: 2004-09-30.
$3,325 with Army for ADP Input/Output and Storage Devices. Signed on 2005-02-02. Completion date: 2005-02-24.
BACON & COMPANY INC (200-208 W SUMMIT HL DR; small business) 30 employees, $0 revenue.
$48,000 with Tennessee Valley Authority for Clothing, Special Purpose. Signed on 2000-04-15. Completion date: 2000-07-15.
WJCE, INC (505 S GAY ST 930; small business)
$44,821 with Navy for Other Professional Services. Taking place in AL. Signed on 2006-02-07. Completion date: 2006-09-30.
BROOME, WILLIAM S JR (602 S GAY ST STE 602; small business) : $40,550 in 2 contractsin 2000
$40,550 with U.S. Army Corps of Engineers - civil program financing only for Real Property Appraisals Services (SIC 6531). Signed on 2000-03-22. Completion date: 2001-03-17.
$0, same as above.Signed on 2000-03-22. Completion date: 2001-03-17.
KENBAR SERVICES INC (808 STATE ST; small business) : $27,268 in 4 contractsfrom 2003 to 2006
$10,066 with Army for Food Services. Signed on 2005-10-01. Completion date: 2006-09-30.
$10,066, same as above.Signed on 2004-10-01. Completion date: 2005-09-30.
$10,066, same as above.Signed on 2003-10-07. Completion date: 2004-09-30.
-$2,930, same as above.Signed on 2006-01-05. Completion date: 2006-09-30.
JOHN H COLEMAN CO, LLC (814 STATE ST; small business)
$12,353 with U.S. Army Corps of Engineers - civil program financing only for Air Conditioning Equipment. Signed on 2002-08-16. Completion date: 2002-09-19.
REPUBLIC PARKING SYSTEM (P.O. BOX 2744; small business) : $600 in 12 contractsfrom 2005 to 2006
Contracts for Lease or Rental of Facilities -- Office Buildings by Public Buildings Service Signed by year:2000: $0; 2001: $0; 2002: $0; 2003: $0; 2004: $0; 2005: $0; 2006: $600.
Biggest contracts:
$100 with Public Buildings Service for Lease or Rental of Facilities -- Office Buildings. Signed on 2006-04-01. Completion date: 2006-09-30.
$100, same as above.Signed on 2006-07-01. Completion date: 2006-09-30.
$100, same as above.Signed on 2006-07-01. Completion date: 2006-09-30.
$100, same as above.Signed on 2006-07-01. Completion date: 2006-09-30.
FOUNDRY ON THE FAIR SITE INC (747 W JACKSON AVE; small business) : -$586 in 2 contractsin 2006
$0 with Army for Food Items For Resale. Signed on 2006-05-24. Completion date: 2006-05-26.
-$586, same as above.Signed on 2006-05-24. Completion date: 2006-05-26.
Top industries in this zip code by the number of employees in 2005:
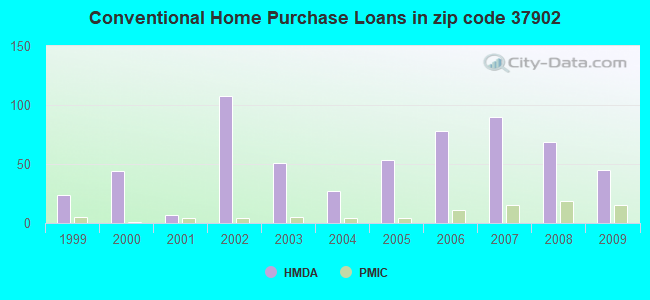
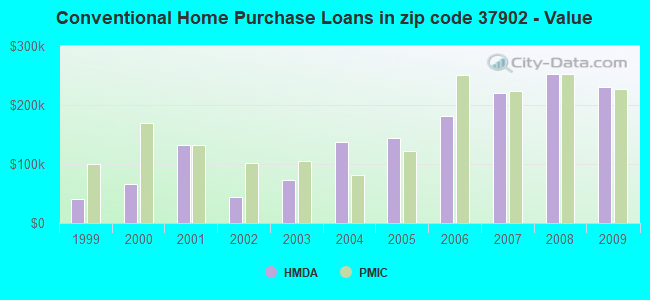
Detailed PMIC statistics for the following Tracts:0001.00
2002 - 2018 National Fire Incident Reporting System (NFIRS) incidents
Based on the data from the years 2002 - 2018 the average number of fire incidents per year is 42. The highest number of reported fires - 62 took place in 2002, and the least - 24 in 2009. The data has a declining trend.
When looking into fire subcategories, the most incidents belonged to: Outside Fires (57.6%), and Structure Fires (25.3%).
Fire incident types reported to NFIRS in Zip Code 37902


 Nearest zip codes: 37916, 37915, 37917, 37920, 37912, 37921.
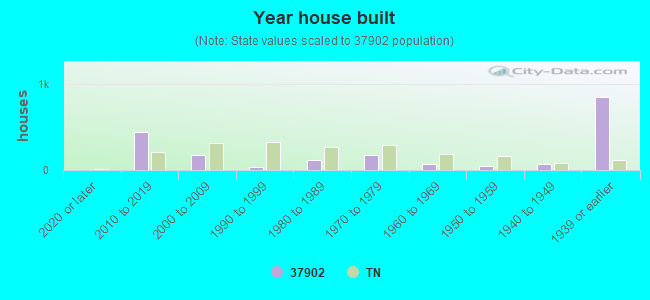


 Based on the data from the years 2002 - 2018 the average number of fire incidents per year is 42. The highest number of reported fires - 62 took place in 2002, and the least - 24 in 2009. The data has a declining trend.
 When looking into fire subcategories, the most incidents belonged to: Outside Fires (57.6%), and Structure Fires (25.3%).