Estimated zip code population in 2022: 43,320 Zip code population in 2010: 39,087 Zip code population in 2000: 37,698
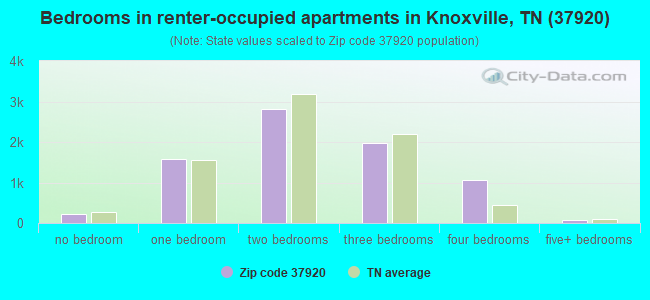
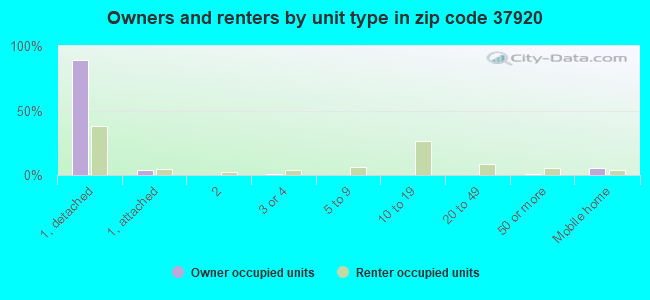
Houses and condos: 20,639 Renter-occupied apartments: 7,712
% of renters here:
41%
State:
33%
March 2022 cost of living index in zip code 37920: 86.3 (less than average, U.S. average is 100)
Land area: 72.5 sq. mi. Water area: 3.2 sq. mi.
Population density: 598 people per square mile
(low).
OSM Map
General Map
Google Map
MSN Map
OSM Map
General Map
Google Map
MSN Map
OSM Map
General Map
Google Map
MSN Map
OSM Map
General Map
Google Map
MSN Map
Please wait while loading the map...
Real estate property taxes paid for housing units in 2022:
This zip code:
0.5% ($1,116)
Tennessee:
0.5% ($1,376)
Median real estate property taxes paid for housing units with mortgages in 2022: $1,129 (0.5%) Median real estate property taxes paid for housing units with no mortgage in 2022: $1,102 (0.5%)
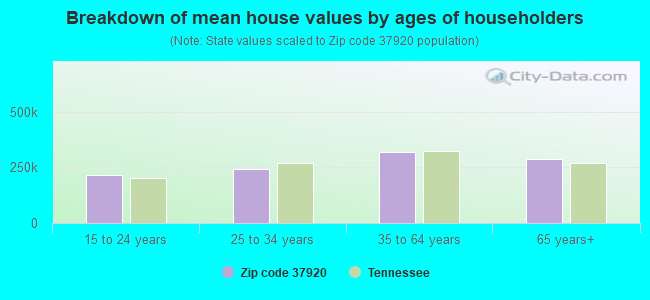
Estimated median house/condo value in 2022: $246,025
37920:
$246,025
Tennessee:
$284,800
According to our research of Tennessee and other state lists, there were 57 registered sex offenders living in 37920 zip code as of April 26, 2024. The ratio of all residents to sex offenders in zip code 37920 is 710 to 1. The ratio of registered sex offenders to all residents in this zip code is lower than the state average.
Median resident age:
This zip code:
36.3 years
Tennessee median age:
39.2 years
Average household size:
This zip code:
2.3 people
Tennessee:
2.4 people
Averages for the 2020 tax year for zip code 37920, filed in 2021:
Average Adjusted Gross Income (AGI) in 2020: $56,235 (Individual Income Tax Returns)
Here:
$56,235
State:
$69,014
Salary/wage: $47,407 (reported on 83.8% of returns)
Here:
$47,407
State:
$55,872
(% of AGI for various income ranges: 1152.7% for AGIs below $25k, 3577.9% for AGIs $25k-50k, 6406.3% for AGIs $50k-75k, 9428.1% for AGIs $75k-100k, 17028.6% for AGIs $100k-200k, 76544.4% for AGIs over 200k)
Taxable interest for individuals: $1,572 (reported on 26.0% of returns)
This zip code:
$1,572
Tennessee:
$1,945
(% of AGI for various income ranges: 10.7% for AGIs below $25k, 21.5% for AGIs $25k-50k, 43.5% for AGIs $50k-75k, 68.1% for AGIs $75k-100k, 173.2% for AGIs $100k-200k, 1729.4% for AGIs over 200k)
Ordinary dividends: $4,954 (reported on 14.6% of returns)
Here:
$4,954
State:
$8,105
(% of AGI for various income ranges: 12.0% for AGIs below $25k, 20.2% for AGIs $25k-50k, 56.9% for AGIs $50k-75k, 122.1% for AGIs $75k-100k, 266.3% for AGIs $100k-200k, 4302.5% for AGIs over 200k)
Net capital gain/loss in AGI: +$17,325 (reported on 13.3% of returns)
Here:
+$17,325
State:
+$33,664
(% of AGI for various income ranges: 6.1% for AGIs below $25k, 17.3% for AGIs $25k-50k, 71.6% for AGIs $50k-75k, 162.0% for AGIs $75k-100k, 667.3% for AGIs $100k-200k, 20222.5% for AGIs over 200k)
Profit/loss from business: +$18,967 (reported on 16.1% of returns)
Here:
+$18,967
State:
+$18,991
(% of AGI for various income ranges: 139.4% for AGIs below $25k, 149.0% for AGIs $25k-50k, 290.3% for AGIs $50k-75k, 446.6% for AGIs $75k-100k, 964.6% for AGIs $100k-200k, 14098.8% for AGIs over 200k)
Taxable individual retirement arrangement distribution: $16,994 (reported on 7.3% of returns)
37920:
$16,994
Tennessee:
$20,036
(% of AGI for various income ranges: 37.5% for AGIs below $25k, 68.5% for AGIs $25k-50k, 155.5% for AGIs $50k-75k, 263.2% for AGIs $75k-100k, 655.0% for AGIs $100k-200k, 3383.1% for AGIs over 200k)
Self-employed (Keogh) retirement plans: $26,618 (reported on 0.6% of returns)
37920:
$26,618
Tennessee:
$28,955
(% of AGI for various income ranges: 68.3% for AGIs $100k-200k, 1356.2% for AGIs over 200k)
Total itemized deductions: $45,619 (reported on 3.0% of returns)
Here:
$45,619
State:
$40,136
(% of AGI for various income ranges: 14.2% for AGIs below $25k, 33.0% for AGIs $25k-50k, 91.1% for AGIs $50k-75k, 154.3% for AGIs $75k-100k, 526.6% for AGIs $100k-200k, 9053.1% for AGIs over 200k)
Charity contributions: $27,600 (reported on 2.6% of returns)
Here:
$27,600
State:
$19,852
(% of AGI for various income ranges: 8.0% for AGIs $25k-50k, 21.2% for AGIs $50k-75k, 40.6% for AGIs $75k-100k, 221.7% for AGIs $100k-200k, 6166.9% for AGIs over 200k)
Taxes paid: $5,340 (reported on 2.9% of returns)
37920:
$5,340
State:
$6,038
(% of AGI for various income ranges: 1.6% for AGIs below $25k, 3.5% for AGIs $25k-50k, 13.1% for AGIs $50k-75k, 24.6% for AGIs $75k-100k, 71.8% for AGIs $100k-200k, 860.6% for AGIs over 200k)
Earned income credit: $2,130 (reported on 17.8% of returns)
Here:
$2,130
State:
$2,391
(% of AGI for various income ranges: 87.8% for AGIs below $25k, 52.8% for AGIs $25k-50k, 1.3% for AGIs $50k-75k)
Percentage of individuals using paid preparers for their 2020 taxes: 93.1%
Here:
93%
State:
93%
(% for various income ranges: 93.1% for AGIs below $25k, 94.0% for AGIs $25k-50k, 92.9% for AGIs $50k-75k, 91.7% for AGIs $75k-100k, 92.3% for AGIs $100k-200k, 91.2% for AGIs over 200k)
Averages for the 2012 tax year for zip code 37920, filed in 2013:
Average Adjusted Gross Income (AGI) in 2012: $43,642 (Individual Income Tax Returns)
Here:
$43,642
State:
$53,767
Salary/wage: $37,550 (reported on 84.0% of returns)
Here:
$37,550
State:
$45,421
(% of AGI for various income ranges: 77.1% for AGIs below $25k, 81.2% for AGIs $25k-50k, 77.3% for AGIs $50k-75k, 74.8% for AGIs $75k-100k, 68.6% for AGIs $100k-200k, 51.6% for AGIs over 200k)
Taxable interest for individuals: $1,495 (reported on 27.8% of returns)
This zip code:
$1,495
Tennessee:
$1,732
(% of AGI for various income ranges: 0.8% for AGIs below $25k, 0.6% for AGIs $25k-50k, 0.5% for AGIs $50k-75k, 0.9% for AGIs $75k-100k, 1.0% for AGIs $100k-200k, 2.0% for AGIs over 200k)
Ordinary dividends: $4,273 (reported on 13.6% of returns)
Here:
$4,273
State:
$6,739
(% of AGI for various income ranges: 0.9% for AGIs below $25k, 0.5% for AGIs $25k-50k, 0.8% for AGIs $50k-75k, 1.0% for AGIs $75k-100k, 1.9% for AGIs $100k-200k, 3.0% for AGIs over 200k)
Net capital gain/loss in AGI: +$10,936 (reported on 10.3% of returns)
Here:
+$10,936
State:
+$19,082
(% of AGI for various income ranges: 0.1% for AGIs $25k-50k, 0.4% for AGIs $50k-75k, 0.5% for AGIs $75k-100k, 1.3% for AGIs $100k-200k, 14.7% for AGIs over 200k)
Profit/loss from business: +$14,819 (reported on 16.5% of returns)
Here:
+$14,819
State:
+$15,240
(% of AGI for various income ranges: 9.5% for AGIs below $25k, 3.4% for AGIs $25k-50k, 3.3% for AGIs $50k-75k, 3.3% for AGIs $75k-100k, 6.3% for AGIs $100k-200k, 9.3% for AGIs over 200k)
Taxable individual retirement arrangement distribution: $15,197 (reported on 8.9% of returns)
37920:
$15,197
Tennessee:
$15,505
(% of AGI for various income ranges: 2.3% for AGIs below $25k, 2.0% for AGIs $25k-50k, 2.6% for AGIs $50k-75k, 2.7% for AGIs $75k-100k, 4.2% for AGIs $100k-200k, 4.9% for AGIs over 200k)
Self-employment retirement plans: $21,971 (reported on 0.4% of returns)
37920:
$21,971
Tennessee:
$22,567
(% of AGI for various income ranges: 0.2% for AGIs below $25k, 0.3% for AGIs $100k-200k, 0.9% for AGIs over 200k)
Total itemized deductions: $19,783 (21% of AGI, reported on 18.4% of returns)
Here:
$19,783
State:
$21,976
Here:
20.9% of AGI
State:
17.8% of AGI
(% of AGI for various income ranges: 5.0% for AGIs below $25k, 6.9% for AGIs $25k-50k, 8.4% for AGIs $50k-75k, 8.8% for AGIs $75k-100k, 10.2% for AGIs $100k-200k, 10.3% for AGIs over 200k)
Charity contributions: $6,390 (reported on 14.2% of returns)
Here:
$6,390
State:
$6,709
(% of AGI for various income ranges: 0.5% for AGIs below $25k, 0.9% for AGIs $25k-50k, 1.7% for AGIs $50k-75k, 2.0% for AGIs $75k-100k, 3.0% for AGIs $100k-200k, 4.4% for AGIs over 200k)
Taxes paid: $3,723 (reported on 18.1% of returns)
37920:
$3,723
State:
$4,829
(% of AGI for various income ranges: 0.7% for AGIs below $25k, 1.2% for AGIs $25k-50k, 1.4% for AGIs $50k-75k, 1.6% for AGIs $75k-100k, 2.1% for AGIs $100k-200k, 2.1% for AGIs over 200k)
Earned income credit: $2,138 (reported on 22.8% of returns)
Here:
$2,138
State:
$2,404
(% of AGI for various income ranges: 6.7% for AGIs below $25k, 1.0% for AGIs $25k-50k)
Percentage of individuals using paid preparers for their 2012 taxes: 47.0%
Here:
47%
State:
52%
(% for various income ranges: 45.7% for AGIs below $25k, 44.1% for AGIs $25k-50k, 47.8% for AGIs $50k-75k, 52.2% for AGIs $75k-100k, 53.7% for AGIs $100k-200k, 75.0% for AGIs over 200k)
Averages for the 2004 tax year for zip code 37920, filed in 2005:
Average Adjusted Gross Income (AGI) in 2004: $37,340 (Individual Income Tax Returns)
Here:
$37,340
State:
$44,088
Salary/wage: $33,406 (reported on 84.3% of returns)
Here:
$33,406
State:
$38,825
(% of AGI for various income ranges: 118.0% for AGIs below $10k, 79.1% for AGIs $10k-25k, 82.3% for AGIs $25k-50k, 80.7% for AGIs $50k-75k, 78.0% for AGIs $75k-100k, 58.8% for AGIs over 100k)
Taxable interest for individuals: $1,558 (reported on 37.3% of returns)
This zip code:
$1,558
Tennessee:
$1,802
(% of AGI for various income ranges: 5.1% for AGIs below $10k, 2.0% for AGIs $10k-25k, 1.1% for AGIs $25k-50k, 1.4% for AGIs $50k-75k, 1.2% for AGIs $75k-100k, 1.8% for AGIs over 100k)
Taxable dividends: $2,823 (reported on 17.8% of returns)
Here:
$2,823
State:
$3,727
(% of AGI for various income ranges: 2.8% for AGIs below $10k, 0.7% for AGIs $10k-25k, 0.7% for AGIs $25k-50k, 0.9% for AGIs $50k-75k, 1.0% for AGIs $75k-100k, 2.7% for AGIs over 100k)
Net capital gain/loss: +$9,046 (reported on 13.8% of returns)
Here:
+$9,046
State:
+$15,776
(% of AGI for various income ranges: -0.3% for AGIs below $10k, 0.2% for AGIs $10k-25k, 0.6% for AGIs $25k-50k, 1.2% for AGIs $50k-75k, 1.6% for AGIs $75k-100k, 10.1% for AGIs over 100k)
Profit/loss from business: +$10,929 (reported on 16.6% of returns)
Here:
+$10,929
State:
+$12,882
(% of AGI for various income ranges: 9.8% for AGIs below $10k, 5.1% for AGIs $10k-25k, 3.5% for AGIs $25k-50k, 3.0% for AGIs $50k-75k, 3.3% for AGIs $75k-100k, 7.6% for AGIs over 100k)
IRA payment deduction: $2,772 (reported on 2.4% of returns)
37920:
$2,772
Tennessee:
$2,934
(% of AGI for various income ranges: 0.3% for AGIs below $10k, 0.2% for AGIs $10k-25k, 0.3% for AGIs $25k-50k, 0.2% for AGIs $50k-75k, 0.2% for AGIs $75k-100k, 0.1% for AGIs over 100k)
Self-employed pension: $12,033 (reported on 0.6% of returns)
Here:
$12,033
Tennessee:
$16,857
Total itemized deductions: $16,935 (22% of AGI, reported on 20.8% of returns)
Here:
$16,935
State:
$18,035
Here:
22.1% of AGI
State:
19.9% of AGI
(% of AGI for various income ranges: 6.0% for AGIs below $10k, 5.8% for AGIs $10k-25k, 8.4% for AGIs $25k-50k, 9.2% for AGIs $50k-75k, 11.3% for AGIs $75k-100k, 11.8% for AGIs over 100k)
Charity contributions deductions: $5,391 (7% of AGI, reported on 17.8% of returns)
Here:
$5,391
State:
$5,167
Here:
6.6% of AGI
State:
5.3% of AGI
(% of AGI for various income ranges: 0.5% for AGIs below $10k, 0.9% for AGIs $10k-25k, 1.4% for AGIs $25k-50k, 2.0% for AGIs $50k-75k, 3.0% for AGIs $75k-100k, 4.8% for AGIs over 100k)
Total tax: $5,473 (reported on 73.5% of returns)
37920:
$5,473
State:
$7,482
(% of AGI for various income ranges: 4.1% for AGIs below $10k, 4.2% for AGIs $10k-25k, 7.0% for AGIs $25k-50k, 9.2% for AGIs $50k-75k, 11.3% for AGIs $75k-100k, 19.1% for AGIs over 100k)
Earned income credit: $1,706 (reported on 19.2% of returns)
Here:
$1,706
State:
$1,826
Percentage of individuals using paid preparers for their 2004 taxes: 55.8%
Here:
56%
State:
60%
(% for various income ranges: 52.0% for AGIs below $10k, 57.7% for AGIs $10k-25k, 56.1% for AGIs $25k-50k, 55.4% for AGIs $50k-75k, 53.1% for AGIs $75k-100k, 63.6% for AGIs over 100k)
Likely homosexual households (counted as self-reported same-sex unmarried-partner households)
Lesbian couples: 0.4% of all households
Gay men: 0.1% of all households
Household received Food Stamps/SNAP in the past 12 months: 2,138 Household did not receive Food Stamps/SNAP in the past 12 months: 16,518
Women who had a birth in the past 12 months: 357 (254 now married, 104 unmarried) Women who did not have a birth in the past 12 months: 10,643 (3,502 now married, 7,138 unmarried)
Housing units in zip code 37920 with a mortgage: 6,240 (315 second mortgage, 2 home equity loan, 241 both second mortgage and home equity loan) Houses without a mortgage: 81
Median monthly owner costs for units with a mortgage: $1,200 Median monthly owner costs for units without a mortgage: $432
Residents with income below the poverty level in 2022:
This zip code:
17.2%
Whole state:
13.3%
Residents with income below 50% of the poverty level in 2022:
This zip code:
9.1%
Whole state:
7.1%
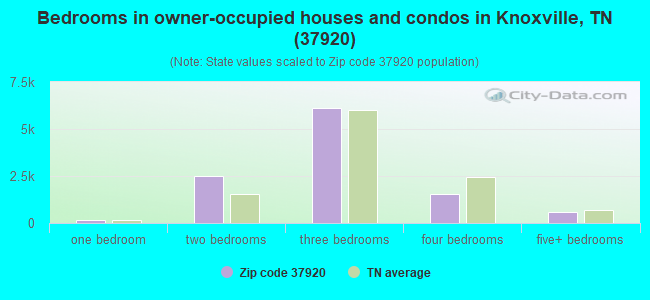
Median number of rooms in houses and condos:
Here:
6.2
State:
6.5
Median number of rooms in apartments:
Here:
4.7
State:
4.4
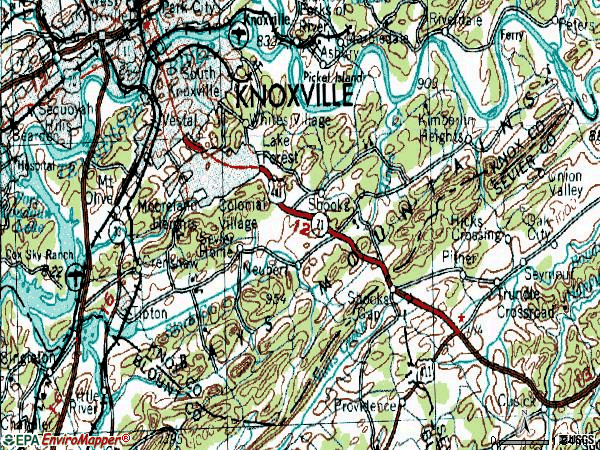
Notable locations in this zip code not listed on our city pages
Notable locations in zip code 37920: Tipton Station (A), Stock Creek Marina (B), Marble Springs (C), Huffaker Ferry (D), Maxey Dock (E), Hillvale Country Club (F), Knoxville Fire Department Station 13 / 19 (G), Williams-Henson Boys Home (H), Rural / Metro Fire Department Knoxville 28 (I), Knoxville Fire Department Station 10 (J), Seymour Volunteer Fire Department Station 2 (K), Seymour Volunteer Fire Department Station 6 (L). Display/hide their locations on the map
Churches in zip code 37920 include: Southside Church (A), Forest Grove Church (B), Friendly Chapel (C), Beulah United Methodist Church (D), Galilee Church (E), Stock Creek Church (F), Gap Creek Church (G), Tarklin Valley Church (H), Gloria Dei Church (I). Display/hide their locations on the map
Cemeteries: Johnson Cemetery (1), Wells Cemetery (2), Woodlawn Cemetery (3), Bethel Cemetery (4), McCall Cemetery (5), McCammon Cemetery (6), McCarrell Cemetery (7). Display/hide their locations on the map
Streams, rivers, and creeks: Baker Creek (A), Knob Creek (B), Hines Creek (C), Twin Creek (D), Toll Creek (E), Goose Creek (F), Gap Creek (G), Flenniken Branch (H), Cement Mill Creek (I). Display/hide their locations on the map
Parks in zip code 37920 include: I.C. King Park (1), Bower Field (2), Fort Dickerson Park (3), Mark James Park (4), Maynard Glen Park (5), Rock City Park (6), Blount County Access Area (7), South Knoxville Optimist Park (8), Eastern State Wildlife Management Area (9). Display/hide their locations on the map
Tourist attractions (not listed on the city page) : Ijams Nature Center (Nature Centers; 2915 Island Home Avenue) (1), C & D Amusement CO (Amusement & Theme Parks; 1109 Maryville Pike) (2), Brown Mountain Grass (Arcades & Amusements; 7507 Rule Road) (3). Display/hide their approximate locations on the map
3,708 married couples with children.
2,031 single-parent households (454 men, 1,577 women).
96.4% of residents of 37920 zip code speak English at home.
1.5% of residents speak Spanish at home (57% very well, 19% well, 24% not well).
0.8% of residents speak other Indo-European language at home (75% very well, 15% not well, 11% not at all).
0.8% of residents speak Asian or Pacific Island language at home (88% very well, 12% well).
0.3% of residents speak other language at home (67% very well, 33% well).
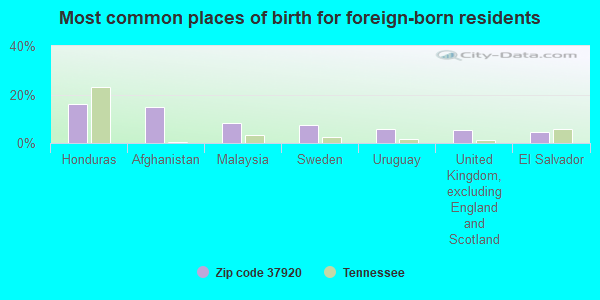
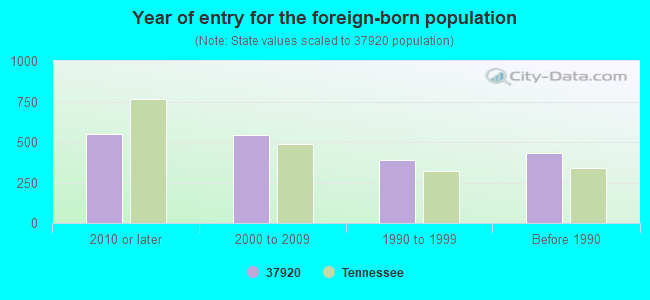
Foreign born population: 1,169 (2.7%) (42.9% of them are naturalized citizens)
Major facilities with environmental interests located in this zip code:
BULLET BOATS INC (8819 VALGRO ROAD in KNOXVILLE, TN)
AIR SYNTHETIC MINOR (AIRS/AFS) CRITERIA AND HAZARDOUS AIR POLLUTANT INVENTORY (Inventory of air pollution sources) HAZARDOUS WASTE BIENNIAL REPORTER (Resource Conservation and Recovery Act (tracking hazardous waste)) Large Quantity Generators, more that 1000 kg of hazardous waste/month (Resource Conservation and Recovery Act (tracking hazardous waste)) - notification TRI REPORTER (Tracking of toxic chemicals releasing facilities) Business SIC classification: BOAT BUILDING AND REPAIRING Organizations: WILLIAM R HILL, PRESIDENT (CONTACT/OPERATOR)
DOGWOOD ELEMENTARY (705 TIPTON AV in KNOXVILLE, TN)
(National Center for Education Statistics) - STATE ID-0059 Organizations: KNOX COUNTY SCHOOL DISTRICT (SCHOOL DISTRICT)
COLONIAL PIPELINE CO. - GOOSE CREEK/TENNESSEE RIVER FUEL OIL SPILL (GOOSE CREEK AND TENNESSEE RIVER in KNOXVILLE, TN)
(Integrated Compliance Information System) - ICIS-04-1997-0525, FORMAL ENFORCEMENT ACTION
DRY CLEAN TENNESSEE, INC. (7220 CHAPMAN HIGHWAY in KNOXVILLE, TN)
(Resource Conservation and Recovery Act (tracking hazardous waste)) Organizations: BILL HELTON (CONTACT/OWNER)
ACCURATE PRINTING CO (810 E GOVERNOR JOHN SEVIER HWY in KNOXVILLE, TN)
(Resource Conservation and Recovery Act (tracking hazardous waste))
AD-GRAPHICS INCORPORATED (RURAL RT 23 in KNOXVILLE, TN)
(Resource Conservation and Recovery Act (tracking hazardous waste)) Business NAICS classification: BROADWOVEN FABRIC FINISHING MILLS.
ADAMS COMPONENTS INC (PO BOX 9118 in KNOXVILLE, TN)
(Resource Conservation and Recovery Act (tracking hazardous waste))
APPROACH 13-30 CORPORATION (1005 MARYVILLE PK in KNOXVILLE, TN)
(Resource Conservation and Recovery Act (tracking hazardous waste)) Business NAICS classification: ALL OTHER PUBLISHERS.
B & R AUTOMOTIVE DIESEL MACHINE SHOP (6542 CHAPMAN HIGHWAY in KNOXVILLE, TN)
(Resource Conservation and Recovery Act (tracking hazardous waste)) Business NAICS classification: OTHER COMMERCIAL AND SERVICE INDUSTRY MACHINERY MANUFACTURING. Alternative names: B & R AUTOMOTIVE DIESEL MCH SP
BAPTIST HOSPITAL OF EAST TENNESSEE (137 BLOUNT AVENUE in KNOXVILLE, TN)
Conditionally Exempt Small Quantity Generators, less than 100 kg/month of hazardous waste (Resource Conservation and Recovery Act (tracking hazardous waste)) - notification Organizations: RON HELLMUND (CONTACT/OPERATOR)
Alternative names: EAST TENNESSEE BAPTIST HOSPITAL
BRADEN TRUCKS INCORPORATED (935 CHESTER ROAD SOUTHEAST in KNOXVILLE, TN)
(Resource Conservation and Recovery Act (tracking hazardous waste))
C.O. JOHNSON HEATING OIL CO (424 BLOUNT AVENUE in KNOXVILLE, TN)
(Resource Conservation and Recovery Act (tracking hazardous waste))
CAM & ENGINE SERVICE INC (PO BOX 9189 in KNOXVILLE, TN)
(Resource Conservation and Recovery Act (tracking hazardous waste)) Business NAICS classification: OTHER COMMERCIAL AND SERVICE INDUSTRY MACHINERY MANUFACTURING.
Housing units lacking complete plumbing facilities: 2.7% Housing units lacking complete kitchen facilities: 3.1%
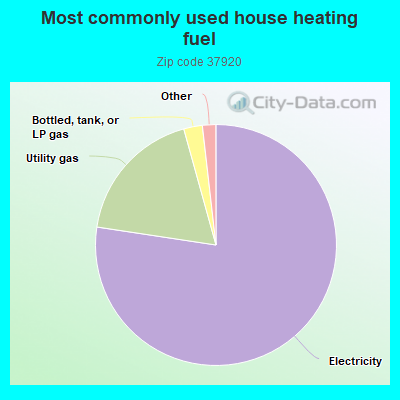
77.4%Electricity
18.3%Utility gas
2.5%Bottled, tank, or LP gas
0.8%Wood
0.6%No fuel used
Population in 1990: 35,762. Population change in the 1990s: +1,936 (+5.4%).
Place of birth for U.S.-born residents:
This state: 26,803
Northeast: 2,190
Midwest: 3,539
South: 6,961
West: 1,798
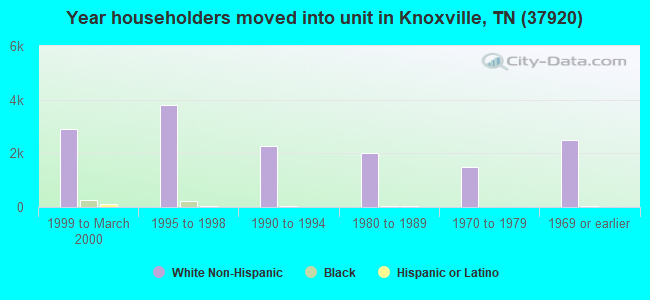
56% of the 37920 zip code residents lived in the same house 5 years ago. Out of people who lived in different houses, 56% lived in this county. Out of people who lived in different counties, 50% lived in Tennessee.
88% of the 37920 zip code residents lived in the same house 1 year ago. Out of people who lived in different houses, 50% moved from this county. Out of people who lived in different houses, 23% moved from different county within same state. Out of people who lived in different houses, 22% moved from different state. Out of people who lived in different houses, 5% moved from abroad.
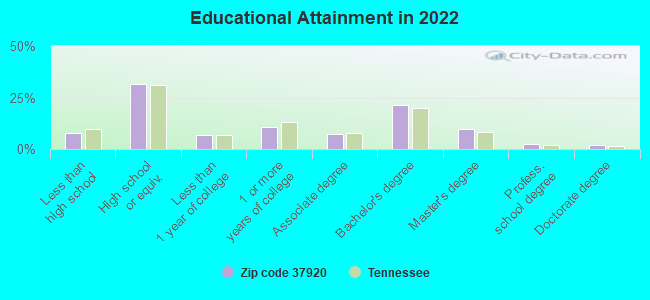
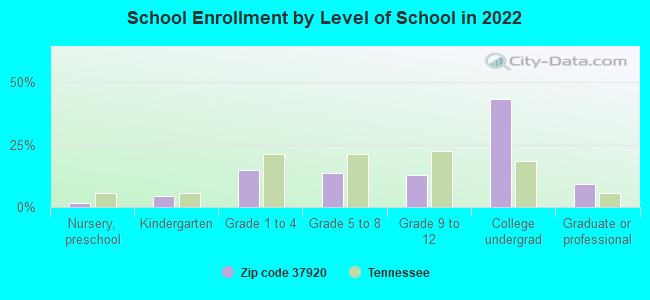
Private vs. public school enrollment:
Students in private schools in grades 1 to 8 (elementary and middle school): 429
Here:
13.8%
Tennessee:
15.0%
Students in private schools in grades 9 to 12 (high school): 92
Here:
6.6%
Tennessee:
16.2%
Students in private undergraduate colleges: 546
Here:
11.5%
Tennessee:
23.5%
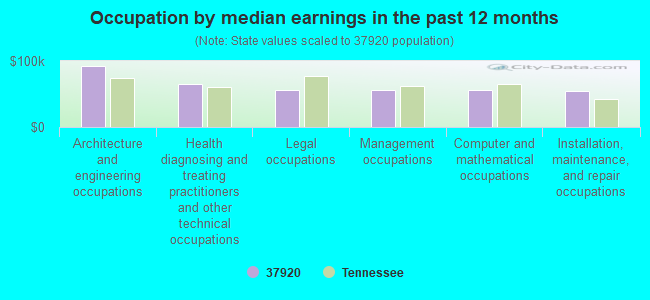
Occupation by median earnings in the past 12 months ($)
92,577Architecture and engineering occupations
65,582Health diagnosing and treating practitioners and other technical occupations
56,732Legal occupations
56,624Management occupations
56,578Computer and mathematical occupations
54,281Installation, maintenance, and repair occupations
Companies with biggest federal contracts located in this zip code (KNOXVILLE, TN):
VALLEY APPAREL, LLC (2323 BLOUNT AVENUE; small business) : $48,100,163 in 40 contractsfrom 2001 to 2006
Contracts for Clothing, Special Purpose by Defense Logistics Agency, Navy Signed by year:2000: $0; 2001: $477,880; 2002: $10,496,239; 2003: $4,018; 2004: $25,741,976; 2005: $4,130,198; 2006: $7,249,852.
Biggest contracts:
$11,627,849 with Defense Logistics Agency for Clothing, Special Purpose. Signed on 2004-12-08. Completion date: 2006-01-01.
$6,220,200, same as above.Signed on 2004-03-08. Completion date: 2004-12-31.
$4,391,039, same as above.Signed on 2002-01-09. Completion date: 2003-01-25.
$3,579,360, same as above.Signed on 2004-07-16. Completion date: 2005-04-30.
KNOXVILLE GLOVE CO (444 BLOUNT AVE; small business) : $2,514,582 in 8 contractsfrom 1999 to 2004
Contracts for Clothing, Special Purpose by Defense Logistics Agency Signed by year:2000: $1,008,639; 2001: $65,333; 2002: $0; 2003: $1,190,400; 2004: $129,024; 2005: $0; 2006: $0.
Biggest contracts:
$1,190,400 with Defense Logistics Agency for Clothing, Special Purpose. Signed on 2003-11-17. Completion date: 2004-06-20.
$917,189, same as above.Signed on 2000-09-21. Completion date: 2001-07-11.
$121,186, same as above.Signed on 1999-12-06. Completion date: 2000-05-01.
$95,693, same as above.Signed on 2004-03-08. Completion date: 2004-09-04.
VULCAN CONSTRUCTION MATERIALS, (3001 ALCOA HIGHWAY; small business) : $507,738 in 33 contractsfrom 1999 to 2006
Contracts for Mineral Construction Materials, Bulk, Wallboard, Building Paper, and Thermal Insulation Materials, by National Park Service, Army, Forest Service, U.S. Army Corps of Engineers - civil program financing only, and others Signed by year:2000: $124,560; 2001: $0; 2002: $0; 2003: $16,110; 2004: $146,537; 2005: $61,924; 2006: $32,067.
Biggest contracts:
$50,400 with National Park Service for Mineral Construction Materials, Bulk. Signed on 2005-03-09. Completion date: 2005-03-30.
$49,210 with Army for Mineral Construction Materials, Bulk. Taking place in KY. Signed on 2000-03-07. Completion date: 2000-03-12.
$49,210, same as above.Signed on 1999-10-06. Completion date: 1999-11-01.
$42,180, same as above.Signed on 1999-12-30. Completion date: 2000-01-19.
DAVID G GERKIN, M D (2300 LAKEMOOR DRIVE; small business) : $184,916 in 7 contractsfrom 2002 to 2006
Contracts for Technical Assistance, Other Professional Services by Army Signed by year:2000: $0; 2001: $0; 2002: $24,750; 2003: $59,400; 2004: $50,593; 2005: $0; 2006: $50,173.
Biggest contracts:
$50,173 with Army for Technical Assistance. Signed on 2006-02-14. Completion date: 2005-11-24.
$50,173, same as above.Signed on 2004-12-06. Completion date: 2005-11-24.
$49,500 with Army for Other Professional Services. Signed on 2003-10-07. Completion date: 2004-10-07.
$24,750 with Army for Other Professional Services. Taking place in KY. Signed on 2002-08-14. Completion date: 2003-09-20.
THIRD DIMENSION TECHNOLOGIES (3601 BLUFF POINT DR; small business)
$99,987 with Air Force for Other Research and Development -- Basic Research (R&D). Signed on 2005-04-28. Completion date: 2006-01-31.
KEISLER AUTOMOTIVE ENGINEERING (2216-B W GOV JOHN SEVIE; small business)
$68,400 with Air Force for Miscellaneous Electrical and Electronic Components. Signed on 2002-02-19. Completion date: 2002-05-15.
M P C INDUSTRIES (INC) (638 MARYSVILLE PIKE; small business)
$27,720 with Air Force for Abrasive Materials. Signed on 2003-08-13. Completion date: 2003-08-22.
VOLUNTEER GAS CONTROL INC (1055 KIMBERLIN HEIGHTS RD; small business)
$12,050 with Army for Maintenance, Repair and Rebuilding of Equipment -- Miscellaneous. Signed on 2004-07-21. Completion date: 2004-07-21.
VEXUS INTERNATIONAL ALLEN SIGN (2408 CHAPMAN HWY; small business)
$8,836 with Army for Maintenance, Repair or Alteration of Real Property -- Restoration of real property. Signed on 2005-08-02. Completion date: 2005-09-01.
GREG WEBB (7525 CHAPMAN HWY; small business)
$7,765 with Army for Miscellaneous Prefabricated Structures. Signed on 2005-09-13. Completion date: 2005-09-26.
Top industries in this zip code by the number of employees in 2005:
Health Care and Social Assistance: General Medical and Surgical Hospitals (over 1000 employees: 2 establishments)
Health Care and Social Assistance: Offices of Physicians (except Mental Health Specialists) (100-249: 1, 50-99: 3, 20-49: 12, 10-19: 20, 5-9: 13, 1-4: 30)
Finance and Insurance: Financial Transactions Processing, Reserve, and Clearinghouse Activities (500-999: 1)
Other Services (except Public Administration): Religious Organizations (100-249: 1, 50-99: 1, 10-19: 4, 5-9: 10, 1-4: 12)
2002 - 2018 National Fire Incident Reporting System (NFIRS) incidents
According to the data from the years 2002 - 2018 the average number of fire incidents per year is 187. The highest number of reported fire incidents - 282 took place in 2007, and the least - 118 in 2015. The data has a dropping trend.
When looking into fire subcategories, the most reports belonged to: Outside Fires (49.6%), and Structure Fires (30.9%).
Fire incident types reported to NFIRS in Zip Code 37920

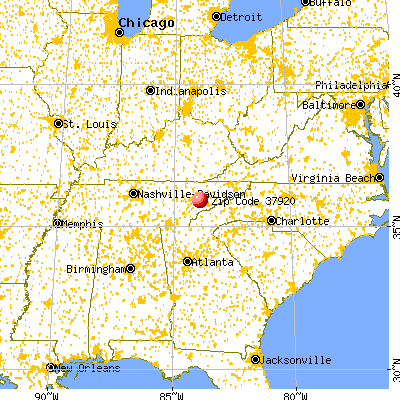


 Nearest zip codes: 37915, 37902, 37916, 37853, 37917, 37914.


 According to the data from the years 2002 - 2018 the average number of fire incidents per year is 187. The highest number of reported fire incidents - 282 took place in 2007, and the least - 118 in 2015. The data has a dropping trend.
 When looking into fire subcategories, the most reports belonged to: Outside Fires (49.6%), and Structure Fires (30.9%).