Estimated zip code population in 2022: 20,958 Zip code population in 2010: 19,663 Zip code population in 2000: 20,120
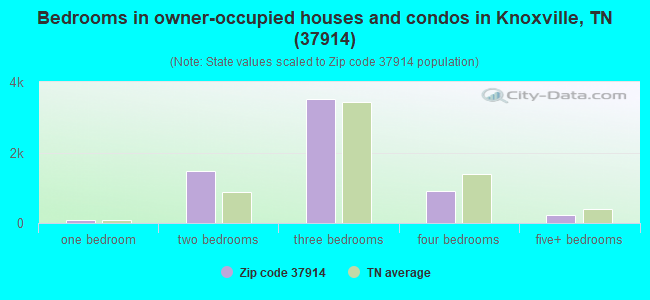
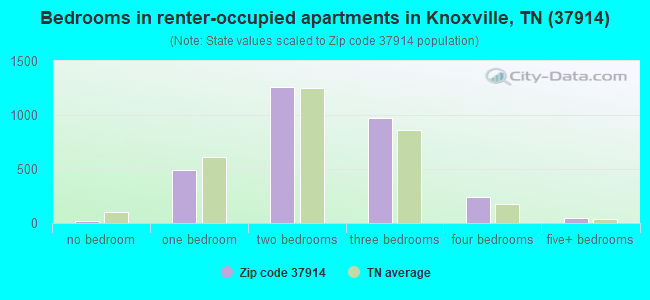
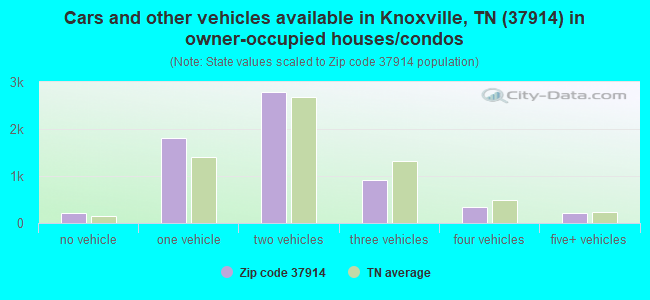
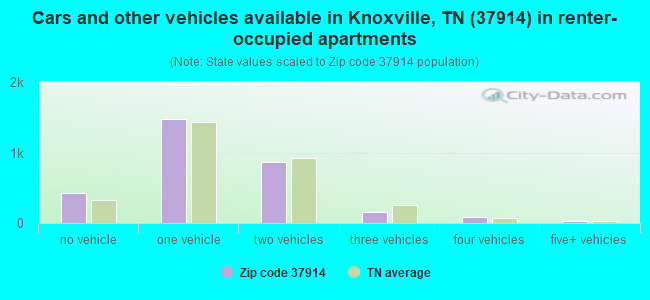
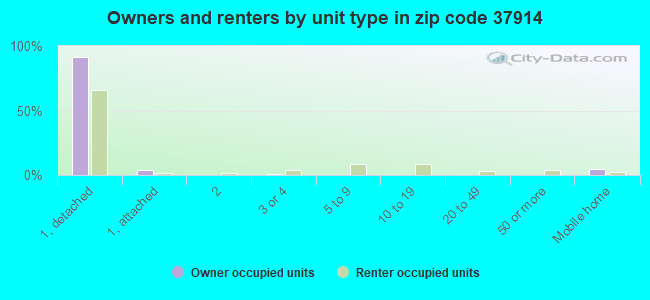
Houses and condos: 10,110 Renter-occupied apartments: 3,042
% of renters here:
33%
State:
33%
March 2022 cost of living index in zip code 37914: 86.4 (less than average, U.S. average is 100)
Land area: 39.8 sq. mi. Water area: 1.3 sq. mi.
Population density: 526 people per square mile
(low).
OSM Map
General Map
Google Map
MSN Map
OSM Map
General Map
Google Map
MSN Map
OSM Map
General Map
Google Map
MSN Map
OSM Map
General Map
Google Map
MSN Map
Please wait while loading the map...
Real estate property taxes paid for housing units in 2022:
This zip code:
0.5% ($1,158)
Tennessee:
0.5% ($1,376)
Median real estate property taxes paid for housing units with mortgages in 2022: $1,195 (0.5%) Median real estate property taxes paid for housing units with no mortgage in 2022: $1,108 (0.5%)
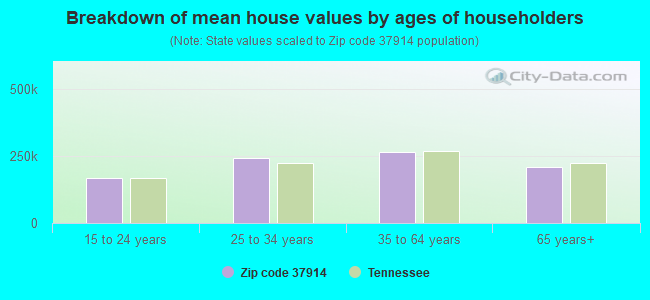
Estimated median house/condo value in 2022: $217,803
37914:
$217,803
Tennessee:
$284,800
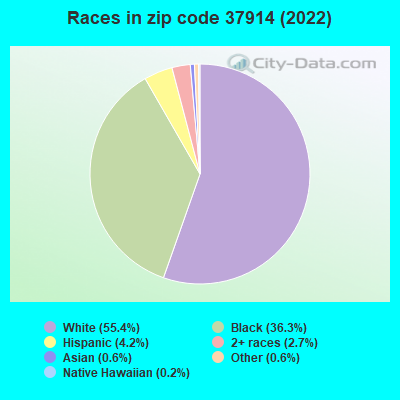
According to our research of Tennessee and other state lists, there were 41 registered sex offenders living in 37914 zip code as of April 27, 2024. The ratio of all residents to sex offenders in zip code 37914 is 506 to 1. The ratio of registered sex offenders to all residents in this zip code is lower than the state average.
Median resident age:
This zip code:
41.6 years
Tennessee median age:
39.2 years
Average household size:
This zip code:
2.2 people
Tennessee:
2.4 people
Averages for the 2020 tax year for zip code 37914, filed in 2021:
Average Adjusted Gross Income (AGI) in 2020: $45,555 (Individual Income Tax Returns)
Here:
$45,555
State:
$69,014
Salary/wage: $39,458 (reported on 82.9% of returns)
Here:
$39,458
State:
$55,872
(% of AGI for various income ranges: 1101.2% for AGIs below $25k, 3533.9% for AGIs $25k-50k, 6013.2% for AGIs $50k-75k, 8941.1% for AGIs $75k-100k, 16710.5% for AGIs $100k-200k, 65898.0% for AGIs over 200k)
Taxable interest for individuals: $1,481 (reported on 20.9% of returns)
This zip code:
$1,481
Tennessee:
$1,945
(% of AGI for various income ranges: 6.9% for AGIs below $25k, 27.3% for AGIs $25k-50k, 58.0% for AGIs $50k-75k, 84.9% for AGIs $75k-100k, 171.4% for AGIs $100k-200k, 1018.0% for AGIs over 200k)
Ordinary dividends: $4,231 (reported on 10.2% of returns)
Here:
$4,231
State:
$8,105
(% of AGI for various income ranges: 8.7% for AGIs below $25k, 21.3% for AGIs $25k-50k, 35.7% for AGIs $50k-75k, 98.2% for AGIs $75k-100k, 281.2% for AGIs $100k-200k, 3020.0% for AGIs over 200k)
Net capital gain/loss in AGI: +$14,108 (reported on 9.0% of returns)
Here:
+$14,108
State:
+$33,664
(% of AGI for various income ranges: 4.8% for AGIs below $25k, 29.9% for AGIs $25k-50k, 53.4% for AGIs $50k-75k, 199.8% for AGIs $75k-100k, 715.8% for AGIs $100k-200k, 14642.0% for AGIs over 200k)
Profit/loss from business: +$13,410 (reported on 15.1% of returns)
Here:
+$13,410
State:
+$18,991
(% of AGI for various income ranges: 135.4% for AGIs below $25k, 96.5% for AGIs $25k-50k, 214.9% for AGIs $50k-75k, 263.8% for AGIs $75k-100k, 895.1% for AGIs $100k-200k, 12068.0% for AGIs over 200k)
Taxable individual retirement arrangement distribution: $14,969 (reported on 6.1% of returns)
37914:
$14,969
Tennessee:
$20,036
(% of AGI for various income ranges: 25.1% for AGIs below $25k, 48.8% for AGIs $25k-50k, 142.1% for AGIs $50k-75k, 256.7% for AGIs $75k-100k, 643.7% for AGIs $100k-200k, 3616.0% for AGIs over 200k)
Self-employed (Keogh) retirement plans: $38,950 (reported on 0.2% of returns)
37914:
$38,950
Tennessee:
$28,955
(% of AGI for various income ranges: 181.2% for AGIs $100k-200k)
Total itemized deductions: $31,745 (reported on 2.9% of returns)
Here:
$31,745
State:
$40,136
(% of AGI for various income ranges: 18.0% for AGIs below $25k, 65.7% for AGIs $25k-50k, 107.4% for AGIs $50k-75k, 259.6% for AGIs $75k-100k, 515.1% for AGIs $100k-200k, 5176.0% for AGIs over 200k)
Charity contributions: $15,204 (reported on 2.3% of returns)
Here:
$15,204
State:
$19,852
(% of AGI for various income ranges: 14.6% for AGIs $25k-50k, 29.9% for AGIs $50k-75k, 79.8% for AGIs $75k-100k, 210.7% for AGIs $100k-200k, 3186.0% for AGIs over 200k)
Taxes paid: $4,300 (reported on 2.6% of returns)
37914:
$4,300
State:
$6,038
(% of AGI for various income ranges: 1.2% for AGIs below $25k, 5.1% for AGIs $25k-50k, 12.7% for AGIs $50k-75k, 36.4% for AGIs $75k-100k, 72.8% for AGIs $100k-200k, 712.0% for AGIs over 200k)
Earned income credit: $2,456 (reported on 25.7% of returns)
Here:
$2,456
State:
$2,391
(% of AGI for various income ranges: 130.8% for AGIs below $25k, 73.6% for AGIs $25k-50k)
Percentage of individuals using paid preparers for their 2020 taxes: 93.3%
Here:
93%
State:
93%
(% for various income ranges: 93.5% for AGIs below $25k, 94.2% for AGIs $25k-50k, 93.6% for AGIs $50k-75k, 90.8% for AGIs $75k-100k, 90.9% for AGIs $100k-200k, 88.2% for AGIs over 200k)
Averages for the 2012 tax year for zip code 37914, filed in 2013:
Average Adjusted Gross Income (AGI) in 2012: $36,441 (Individual Income Tax Returns)
Here:
$36,441
State:
$53,767
Salary/wage: $31,892 (reported on 83.8% of returns)
Here:
$31,892
State:
$45,421
(% of AGI for various income ranges: 75.2% for AGIs below $25k, 81.1% for AGIs $25k-50k, 74.7% for AGIs $50k-75k, 74.7% for AGIs $75k-100k, 68.7% for AGIs $100k-200k, 52.2% for AGIs over 200k)
Taxable interest for individuals: $1,412 (reported on 21.0% of returns)
This zip code:
$1,412
Tennessee:
$1,732
(% of AGI for various income ranges: 0.7% for AGIs below $25k, 0.5% for AGIs $25k-50k, 0.3% for AGIs $50k-75k, 0.6% for AGIs $75k-100k, 1.1% for AGIs $100k-200k, 2.6% for AGIs over 200k)
Ordinary dividends: $3,129 (reported on 10.0% of returns)
Here:
$3,129
State:
$6,739
(% of AGI for various income ranges: 0.6% for AGIs below $25k, 0.5% for AGIs $25k-50k, 0.7% for AGIs $50k-75k, 0.7% for AGIs $75k-100k, 1.6% for AGIs $100k-200k, 1.4% for AGIs over 200k)
Net capital gain/loss in AGI: +$3,961 (reported on 6.7% of returns)
Here:
+$3,961
State:
+$19,082
(% of AGI for various income ranges: 0.2% for AGIs $25k-50k, 0.3% for AGIs $50k-75k, 0.6% for AGIs $75k-100k, 1.4% for AGIs $100k-200k, 3.8% for AGIs over 200k)
Profit/loss from business: +$11,144 (reported on 15.4% of returns)
Here:
+$11,144
State:
+$15,240
(% of AGI for various income ranges: 9.9% for AGIs below $25k, 1.9% for AGIs $25k-50k, 2.2% for AGIs $50k-75k, 1.6% for AGIs $75k-100k, 4.9% for AGIs $100k-200k, 10.7% for AGIs over 200k)
Taxable individual retirement arrangement distribution: $11,714 (reported on 7.7% of returns)
37914:
$11,714
Tennessee:
$15,505
(% of AGI for various income ranges: 2.0% for AGIs below $25k, 2.4% for AGIs $25k-50k, 2.0% for AGIs $50k-75k, 2.3% for AGIs $75k-100k, 5.0% for AGIs $100k-200k)
Self-employment retirement plans: $16,867 (reported on 0.3% of returns)
37914:
$16,867
Tennessee:
$22,567
Total itemized deductions: $17,577 (23% of AGI, reported on 16.6% of returns)
Here:
$17,577
State:
$21,976
Here:
23.5% of AGI
State:
17.8% of AGI
(% of AGI for various income ranges: 5.2% for AGIs below $25k, 7.8% for AGIs $25k-50k, 9.1% for AGIs $50k-75k, 9.6% for AGIs $75k-100k, 9.9% for AGIs $100k-200k, 6.2% for AGIs over 200k)
Charity contributions: $5,186 (reported on 13.4% of returns)
Here:
$5,186
State:
$6,709
(% of AGI for various income ranges: 0.6% for AGIs below $25k, 1.1% for AGIs $25k-50k, 2.0% for AGIs $50k-75k, 2.7% for AGIs $75k-100k, 3.3% for AGIs $100k-200k, 2.8% for AGIs over 200k)
Taxes paid: $3,577 (reported on 16.3% of returns)
37914:
$3,577
State:
$4,829
(% of AGI for various income ranges: 0.8% for AGIs below $25k, 1.6% for AGIs $25k-50k, 1.6% for AGIs $50k-75k, 1.9% for AGIs $75k-100k, 2.2% for AGIs $100k-200k, 1.7% for AGIs over 200k)
Earned income credit: $2,451 (reported on 31.1% of returns)
Here:
$2,451
State:
$2,404
(% of AGI for various income ranges: 9.4% for AGIs below $25k, 1.4% for AGIs $25k-50k)
Percentage of individuals using paid preparers for their 2012 taxes: 49.8%
Here:
50%
State:
52%
(% for various income ranges: 48.3% for AGIs below $25k, 48.1% for AGIs $25k-50k, 52.6% for AGIs $50k-75k, 54.2% for AGIs $75k-100k, 58.7% for AGIs $100k-200k, 75.0% for AGIs over 200k)
Averages for the 2004 tax year for zip code 37914, filed in 2005:
Average Adjusted Gross Income (AGI) in 2004: $32,672 (Individual Income Tax Returns)
Here:
$32,672
State:
$44,088
Salary/wage: $29,879 (reported on 86.3% of returns)
Here:
$29,879
State:
$38,825
(% of AGI for various income ranges: 96.1% for AGIs below $10k, 81.3% for AGIs $10k-25k, 84.5% for AGIs $25k-50k, 81.8% for AGIs $50k-75k, 79.0% for AGIs $75k-100k, 65.0% for AGIs over 100k)
Taxable interest for individuals: $1,468 (reported on 29.9% of returns)
This zip code:
$1,468
Tennessee:
$1,802
(% of AGI for various income ranges: 3.2% for AGIs below $10k, 1.2% for AGIs $10k-25k, 1.1% for AGIs $25k-50k, 0.8% for AGIs $50k-75k, 0.7% for AGIs $75k-100k, 2.3% for AGIs over 100k)
Taxable dividends: $1,979 (reported on 12.8% of returns)
Here:
$1,979
State:
$3,727
(% of AGI for various income ranges: 1.6% for AGIs below $10k, 0.5% for AGIs $10k-25k, 0.4% for AGIs $25k-50k, 0.7% for AGIs $50k-75k, 0.7% for AGIs $75k-100k, 1.5% for AGIs over 100k)
Net capital gain/loss: +$6,107 (reported on 9.8% of returns)
Here:
+$6,107
State:
+$15,776
(% of AGI for various income ranges: -0.2% for AGIs below $10k, 0.1% for AGIs $10k-25k, 0.4% for AGIs $25k-50k, 0.6% for AGIs $50k-75k, 1.7% for AGIs $75k-100k, 6.6% for AGIs over 100k)
Profit/loss from business: +$9,192 (reported on 13.5% of returns)
Here:
+$9,192
State:
+$12,882
(% of AGI for various income ranges: 3.7% for AGIs below $10k, 4.0% for AGIs $10k-25k, 1.4% for AGIs $25k-50k, 2.5% for AGIs $50k-75k, 1.7% for AGIs $75k-100k, 9.0% for AGIs over 100k)
IRA payment deduction: $2,616 (reported on 1.7% of returns)
37914:
$2,616
Tennessee:
$2,934
(% of AGI for various income ranges: 0.2% for AGIs below $10k, 0.1% for AGIs $10k-25k, 0.2% for AGIs $25k-50k, 0.1% for AGIs $50k-75k, 0.1% for AGIs $75k-100k, 0.1% for AGIs over 100k)
Self-employed pension: $18,560 (reported on 0.3% of returns)
Here:
$18,560
Tennessee:
$16,857
Total itemized deductions: $14,967 (23% of AGI, reported on 20.3% of returns)
Here:
$14,967
State:
$18,035
Here:
23.3% of AGI
State:
19.9% of AGI
(% of AGI for various income ranges: 7.5% for AGIs below $10k, 6.4% for AGIs $10k-25k, 9.2% for AGIs $25k-50k, 10.9% for AGIs $50k-75k, 12.6% for AGIs $75k-100k, 9.0% for AGIs over 100k)
Charity contributions deductions: $4,272 (6% of AGI, reported on 17.6% of returns)
Here:
$4,272
State:
$5,167
Here:
6.4% of AGI
State:
5.3% of AGI
(% of AGI for various income ranges: 0.6% for AGIs below $10k, 1.1% for AGIs $10k-25k, 1.9% for AGIs $25k-50k, 2.8% for AGIs $50k-75k, 3.6% for AGIs $75k-100k, 2.9% for AGIs over 100k)
Total tax: $4,634 (reported on 68.9% of returns)
37914:
$4,634
State:
$7,482
(% of AGI for various income ranges: 2.7% for AGIs below $10k, 3.6% for AGIs $10k-25k, 6.5% for AGIs $25k-50k, 9.5% for AGIs $50k-75k, 11.3% for AGIs $75k-100k, 19.5% for AGIs over 100k)
Earned income credit: $1,818 (reported on 26.8% of returns)
Here:
$1,818
State:
$1,826
Percentage of individuals using paid preparers for their 2004 taxes: 61.1%
Here:
61%
State:
60%
(% for various income ranges: 56.3% for AGIs below $10k, 65.2% for AGIs $10k-25k, 61.1% for AGIs $25k-50k, 57.8% for AGIs $50k-75k, 58.6% for AGIs $75k-100k, 65.4% for AGIs over 100k)
Likely homosexual households (counted as self-reported same-sex unmarried-partner households)
Lesbian couples: 0.3% of all households
Gay men: 0.3% of all households
Household received Food Stamps/SNAP in the past 12 months: 1,599 Household did not receive Food Stamps/SNAP in the past 12 months: 7,670
Women who had a birth in the past 12 months: 283 (178 now married, 104 unmarried) Women who did not have a birth in the past 12 months: 4,316 (1,483 now married, 2,832 unmarried)
Housing units in zip code 37914 with a mortgage: 3,601 (297 second mortgage, 42 home equity loan, 170 both second mortgage and home equity loan) Houses without a mortgage: 19
Median monthly owner costs for units with a mortgage: $1,201 Median monthly owner costs for units without a mortgage: $430
Residents with income below the poverty level in 2022:
This zip code:
13.4%
Whole state:
13.3%
Residents with income below 50% of the poverty level in 2022:
This zip code:
7.4%
Whole state:
7.1%
Median number of rooms in houses and condos:
Here:
6.1
State:
6.5
Median number of rooms in apartments:
Here:
4.8
State:
4.4
Notable locations in this zip code not listed on our city pages
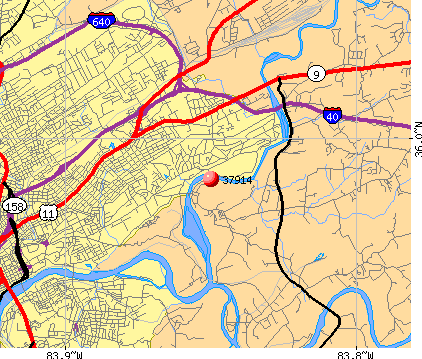
Notable locations in zip code 37914: Vista Farms (A), Eastern State Hospital Farm (B), Holston Hills Golf and Country Club (C), Forks of the River Industrial Park (D), Knoxville Fire Department Station 6 (E), Knoxville Fire Department Station 16 (F), Rural / Metro Fire Department Knoxville 27 (G). Display/hide their locations on the map
Churches in zip code 37914 include: Flint Gap Church (A), Stony Point Church (B), Riverdale Church (C), Riverview Church (D), Lebanon Church (E), Sand Branch United Methodist Church (F), Bell Avenue Church (G), Asbury United Methodist Church (H), Bentley Street Christian Church (I). Display/hide their locations on the map
Cemeteries: Jack Cemetery (1), Underwood Cemetery (2), Union Cemetery (3), Johnson Cemetery (4), Williams Cemetery (5), Armstrong Cemetery (6), Asbury Cemetery (7). Display/hide their locations on the map
Streams, rivers, and creeks: Manifold Branch (A), Inman Branch (B), Swanpond Creek (C), Frazier Branch (D), Holston River (E), Sawmill Run (F), Cruze Creek (G), Moulden Hollow Branch (H), French Broad River (I). Display/hide their locations on the map
Tourist attraction (not listed on the city page) : Knoxville Zoological Gardens (Cultural Attractions- Events- & Facilities; 3500 Knoxville Zoo Drive) (1). Display/hide its approximate location on the map
1,845 married couples with children.
1,697 single-parent households (297 men, 1,400 women).
94.0% of residents of 37914 zip code speak English at home.
3.7% of residents speak Spanish at home (33% very well, 24% well, 37% not well, 5% not at all).
0.4% of residents speak other Indo-European language at home (73% very well, 24% well, 4% not well).
0.4% of residents speak Asian or Pacific Island language at home (43% very well, 57% well).
1.4% of residents speak other language at home (4% very well, 74% well, 22% not well).
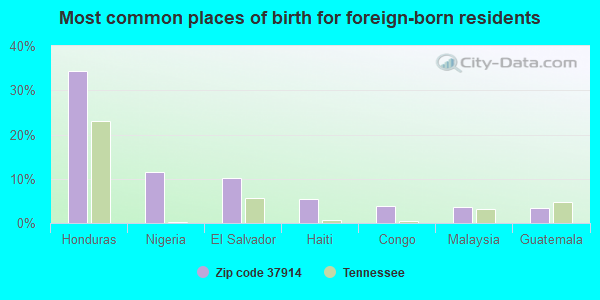
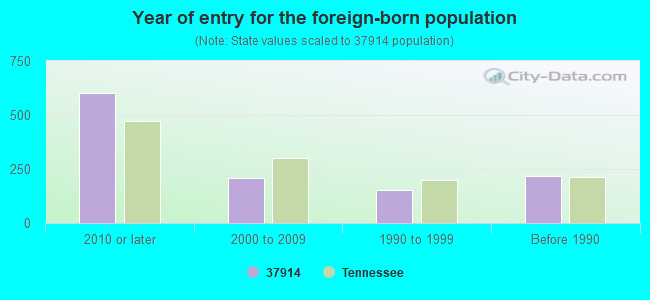
Foreign born population: 1,023 (4.9%) (21.7% of them are naturalized citizens)
Major facilities with environmental interests located in this zip code:
ASHLAND CHEMICAL COMPANY IC&S DIVISION (5263 NATIONAL DR in KNOXVILLE, TN)
AIR SYNTHETIC MINOR (AIRS/AFS) CRITERIA AND HAZARDOUS AIR POLLUTANT INVENTORY (Inventory of air pollution sources) HAZARDOUS WASTE BIENNIAL REPORTER (Resource Conservation and Recovery Act (tracking hazardous waste)) Large Quantity Generators, more that 1000 kg of hazardous waste/month (Resource Conservation and Recovery Act (tracking hazardous waste)) - notification TSD (Resource Conservation and Recovery Act (tracking hazardous waste)) - notification TRI REPORTER (Tracking of toxic chemicals releasing facilities) Business SIC classification: CHEMICALS AND ALLIED PRODUCTS Organizations: ASHLAND INC (CONTACT/OPERATOR)
Alternative names: ASHLAND DISTRIBUTION CO.
AMERICAN SAFETY RAZOR CO. (2820 MEDIA DRIVE in KNOXVILLE, TN)
AIR MAJOR (AIRS/AFS) CRITERIA AND HAZARDOUS AIR POLLUTANT INVENTORY (Inventory of air pollution sources) HAZARDOUS WASTE BIENNIAL REPORTER (Resource Conservation and Recovery Act (tracking hazardous waste)) Large Quantity Generators, more that 1000 kg of hazardous waste/month (Resource Conservation and Recovery Act (tracking hazardous waste)) - notification TRI REPORTER (Tracking of toxic chemicals releasing facilities) Business SIC and NAICS classification: CUTLERY Organizations: AMERICAN SAFETY RAZOR INC. (CONTACT/OPERATOR)
Alternative names: AMERICAN SAFETY RAZOR KNOXVILLE DIVISION
AUSTIN EAST HIGH / MAGNET (2800 ML KING, JR AV in KNOXVILLE, TN)
(National Center for Education Statistics) - STATE ID-0009 Organizations: KNOX COUNTY SCHOOL DISTRICT (SCHOOL DISTRICT)
CHILHOWEE INTERMEDIATE (5005 ASHEVILLE HW in KNOXVILLE, TN)
(National Center for Education Statistics) - STATE ID-0053 Organizations: KNOX COUNTY SCHOOL DISTRICT (SCHOOL DISTRICT)
AQUA-CHEM, INC. (3001 E. JOHN SEVIER HWY. in KNOXVILLE, TN)
AIR SYNTHETIC MINOR (AIRS/AFS) CRITERIA AND HAZARDOUS AIR POLLUTANT INVENTORY (Inventory of air pollution sources) National Pollutant Discharge Elimination System NON-MAJOR (Tracking pollutant discharge elimination systems) - permit Small Quantity Generators, between 100 kg and 1000 kg of hazardous waste/month (Resource Conservation and Recovery Act (tracking hazardous waste)) - notification TRI REPORTER (Tracking of toxic chemicals releasing facilities) Business SIC classification: FABRICATED PLATE WORK (BOILER SHOPS); TEXTILE MACHINERY Business NAICS classification: PLATE WORK MANUFACTURING.
BRIGGS INDUSTRIES INCORPORATED (5040 NATIONAL DR. in KNOXVILLE, TN)
AIR SYNTHETIC MINOR (AIRS/AFS) ENFORCEMENT/COMPLIANCE ACTIVITY (Integrated Compliance Information System) (Resource Conservation and Recovery Act (tracking hazardous waste)) TRI REPORTER (Tracking of toxic chemicals releasing facilities) Business SIC classification: ENAMELED IRON AND METAL SANITARY WARE; PLUMBING FIXTURE FITTINGS AND TRIM Business NAICS classification: ENAMELED IRON AND METAL SANITARY WARE MANUFACTURING.
C & S LAUNDRY COMPANY INC. (4108 ASHEVILLE HWY in KNOXVILLE, TN)
AIR MINOR (AIRS/AFS) Conditionally Exempt Small Quantity Generators, less than 100 kg/month of hazardous waste (Resource Conservation and Recovery Act (tracking hazardous waste)) - notification Business SIC classification: DRYCLEANING PLANTS, EXCEPT RUG CLEANING Organizations: PENNY CRAIG (CONTACT/OPERATOR)
, LATIF MOHAMMED (CONTACT/OWNER)
Alternative names: C & S QUALITY CLEANERS
APAC-TENNESSEE,, INC. (1301 SPRING HILL RKOAD in KNOXVILLE, TN)
ENFORCEMENT/COMPLIANCE ACTIVITY (Integrated Compliance Information System) COMPLIANCE ACTIVITY (Tracking inspections of insecticide, fungicide, and rodenticide, and toxic substances) (Resource Conservation and Recovery Act (tracking hazardous waste)) Business SIC classification: ASPHALT PAVING MIXTURES AND BLOCKS Alternative names: APAC-TENNESSEE, INC. : KNOXVILLE DIVISIO, APAC TENNESSEE KNOXVILLE SHOP
APAC-TN (MIDWAY RD in KNOXVILLE, TN)
AIR SYNTHETIC MINOR (AIRS/AFS) (Resource Conservation and Recovery Act (tracking hazardous waste)) Business SIC classification: ASPHALT PAVING MIXTURES AND BLOCKS Alternative names: APAC-TENNESSEE, INC.: KNOXVILLE DIVISION
CHEROKEE PORCELAIN ENAMEL (2717 INDEPENDENCE LANE - PO BOX 11144 in KNOXVILLE, TN)
ENFORCEMENT/COMPLIANCE ACTIVITY (Integrated Compliance Information System) (Resource Conservation and Recovery Act (tracking hazardous waste))
ACME DIESEL INC. (4724 RUTLEDGE PIKE in KNOXVILLE, TN)
Conditionally Exempt Small Quantity Generators, less than 100 kg/month of hazardous waste (Resource Conservation and Recovery Act (tracking hazardous waste)) - notification Business NAICS classification: GENERAL AUTOMOTIVE REPAIR. Organizations: LARRY LEDFORD, PRESIDENT (CONTACT/OPERATOR)
, LARRY LEDFORD (CONTACT/OWNER)
APAC-TENNESSEE INC :KNOXVILLE DIVISION - (0405 ASPHALT PLANT GOV. JOHN S in KNOXVILLE, TN)
(Resource Conservation and Recovery Act (tracking hazardous waste))
APAC-TENNESSEE, INC.:KNOXVILLE DIVISION- (0401 ASPHALT PLANT CENTENARY R in KNOXVILLE, TN)
(Resource Conservation and Recovery Act (tracking hazardous waste))
Housing units lacking complete plumbing facilities: 3.5% Housing units lacking complete kitchen facilities: 3.8%
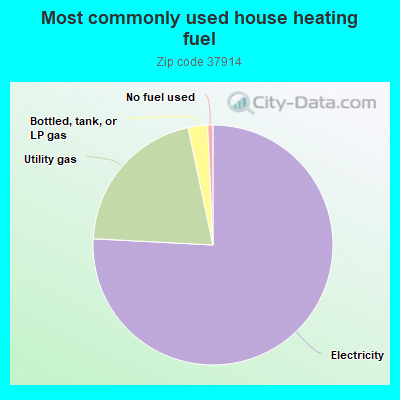
75.3%Electricity
20.7%Utility gas
2.6%Bottled, tank, or LP gas
0.7%No fuel used
Population in 1990: 19,867. Population change in the 1990s: +253 (+1.3%).
Place of birth for U.S.-born residents:
This state: 14,491
Northeast: 723
Midwest: 1,285
South: 2,700
West: 482
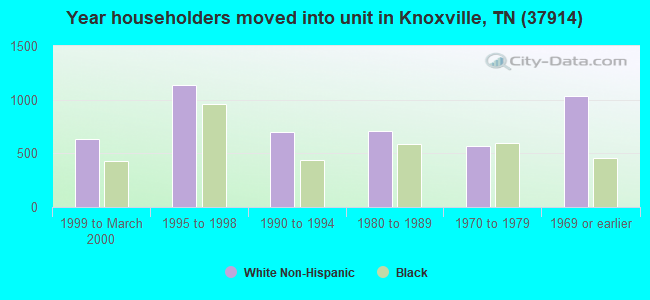
61% of the 37914 zip code residents lived in the same house 5 years ago. Out of people who lived in different houses, 73% lived in this county. Out of people who lived in different counties, 50% lived in Tennessee.
90% of the 37914 zip code residents lived in the same house 1 year ago. Out of people who lived in different houses, 57% moved from this county. Out of people who lived in different houses, 28% moved from different county within same state. Out of people who lived in different houses, 9% moved from different state. Out of people who lived in different houses, 4% moved from abroad.
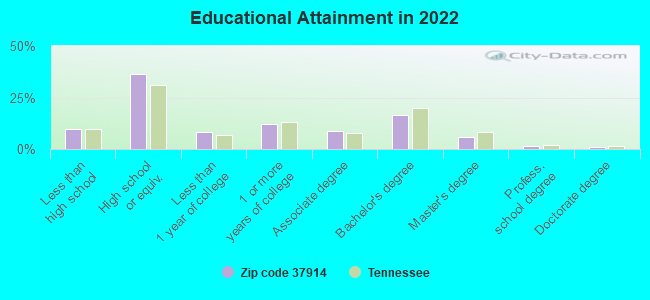
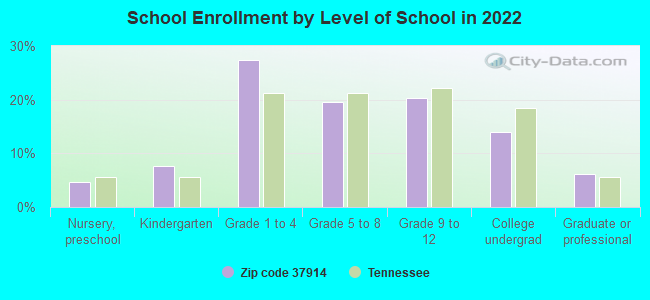
Private vs. public school enrollment:
Students in private schools in grades 1 to 8 (elementary and middle school): 346
Here:
17.5%
Tennessee:
15.0%
Students in private schools in grades 9 to 12 (high school): 163
Here:
19.0%
Tennessee:
16.2%
Students in private undergraduate colleges: 151
Here:
25.5%
Tennessee:
23.5%
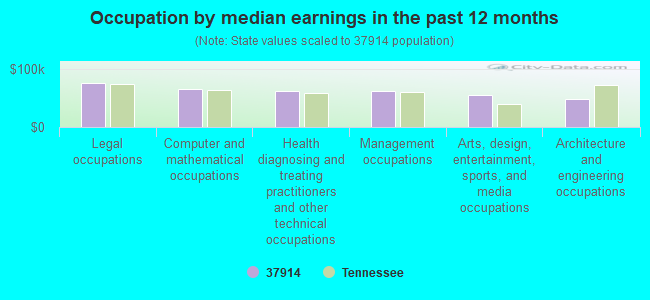
Occupation by median earnings in the past 12 months ($)
76,453Legal occupations
65,358Computer and mathematical occupations
62,926Health diagnosing and treating practitioners and other technical occupations
62,240Management occupations
55,980Arts, design, entertainment, sports, and media occupations
49,404Architecture and engineering occupations
Companies with federal contracts located in this zip code (KNOXVILLE, TN):
AQUA-CHEM, INC (3001 E JOHN SEVIER HWY) : $20,748,065 in 202 contractsfrom 1999 to 2006
Contracts for Miscellaneous Ship and Marine Equipment, Nuclear Reactors, Refrigeration Equipment, Compressors and Vacuum Pumps, and moreby Navy, U.S. Coast Guard, Defense Logistics Agency, Air Force, and others Signed by year:2000: $2,455,718; 2001: $1,660,191; 2002: $3,621,123; 2003: $4,525,915; 2004: $1,854,005; 2005: $2,657,838; 2006: $3,710,812.
Biggest contracts:
$1,944,744 with Navy for Miscellaneous Ship and Marine Equipment. Signed on 2006-03-31. Completion date: 2006-09-30.
$1,568,290, same as above.Signed on 2003-12-12. Completion date: 2004-06-19.
$1,296,496, same as above.Signed on 2006-04-20. Completion date: 2007-03-31.
$958,611, same as above.Signed on 2005-12-02. Completion date: 2006-09-30.
PIONEER BUILDERS, INC (2918 MAGNOLIA AVENUE; small business) : $4,056,447 in 7 contractsfrom 2004 to 2006
Contracts for Maintenance, Repair or Alteration of Real Property -- Office Buildings, Maintenance, Repair or Alteration of Real Property -- Hospitals and Infirmaries, Construction of Structures and Facilities -- Hospitals and Infirmaries, Maintenance, Repair or Alteration of Real Property -- Miscellaneous Buildings by Public Buildings Service, Department of Veterans Affairs, Navy Signed by year:2000: $0; 2001: $0; 2002: $0; 2003: $0; 2004: $885,898; 2005: $714,042; 2006: $2,456,507.
Biggest contracts:
$1,167,421 with Public Buildings Service for Maintenance, Repair or Alteration of Real Property -- Office Buildings. Signed on 2006-06-29. Effective on 2006-06-27. Completion date: 2007-07-17.
$720,500, same as above.Signed on 2006-02-21. Completion date: 2007-03-31.
$714,042, same as above.Signed on 2005-06-03. Completion date: 2005-06-03.
$568,586, same as above.Signed on 2006-05-11. Completion date: 2007-05-30.
WATER TECH ACQUISITION INC (3001 E JOHN SEVIER HWY) : $47,552 in 4 contractsin 2006
$27,312 with Navy for Heat Exchangers and Steam Condensers. Signed on 2006-05-25. Completion date: 2006-11-21.
$14,765 with Navy for Power and Hand Pumps. Signed on 2006-03-23. Completion date: 2006-04-28.
$5,475 with Army for Blocks, Tackle, Rigging, and Slings. Signed on 2006-04-26. Completion date: 2006-05-30.
$0 with Navy for Power and Hand Pumps. Signed on 2006-03-23. Completion date: 2006-04-28.
WEO LLC (4006 E GOVERNOR JOHN SEVIE; small business)
$6,755 with Army for Miscellaneous Prefabricated Structures. Signed on 2003-04-03. Completion date: 2003-04-18.
HUGHES, O G & SONS INC (4816 RUTLEDGE PIKE)
$4,309 with Army for Miscellaneous Vehicular Components. Signed on 2005-01-05. Completion date: 2005-01-27.
READY MIX CONCRETE COMPANY OF (1104 SPRING HILL ROAD; small business) : -$9,613 in 7 contractsfrom 2003 to 2004
Contracts for Mineral Construction Materials, Bulk, Miscellaneous Items by Army Signed by year:2000: $0; 2001: $0; 2002: $0; 2003: $1,718; 2004: -$11,331; 2005: $0; 2006: $0.
Biggest contracts:
$1,718 with Army for Mineral Construction Materials, Bulk. Signed on 2003-10-28. Completion date: 2004-01-27.
$0 with Army for Miscellaneous Items. Signed on 2004-05-03. Completion date: 2003-09-17.
$0 with Army for Mineral Construction Materials, Bulk. Signed on 2004-05-04. Completion date: 2003-08-25.
$0, same as above.Signed on 2004-05-04. Completion date: 2004-01-27.
Top industries in this zip code by the number of employees in 2005:
2002 - 2018 National Fire Incident Reporting System (NFIRS) incidents
Based on the data from the years 2002 - 2018 the average number of fire incidents per year is 133. The highest number of reported fires - 196 took place in 2005, and the least - 87 in 2018. The data has a declining trend.
When looking into fire subcategories, the most incidents belonged to: Structure Fires (37.5%), and Outside Fires (35.2%).
Fire incident types reported to NFIRS in Zip Code 37914

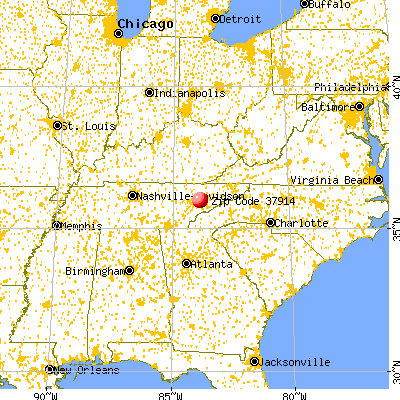


 Nearest zip codes: 37924, 37920, 37915, 37917, 37806, 37902.


 Based on the data from the years 2002 - 2018 the average number of fire incidents per year is 133. The highest number of reported fires - 196 took place in 2005, and the least - 87 in 2018. The data has a declining trend.
 When looking into fire subcategories, the most incidents belonged to: Structure Fires (37.5%), and Outside Fires (35.2%).