Estimated zip code population in 2022: 5,691 Zip code population in 2010: 5,207 Zip code population in 2000: 5,020
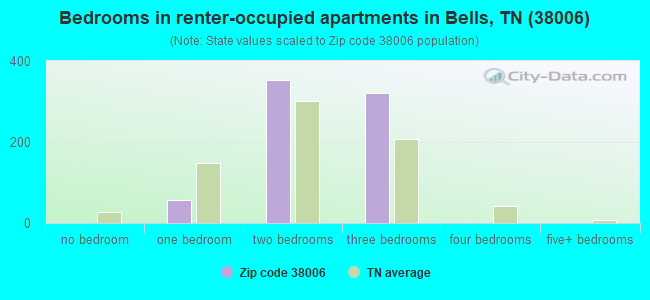
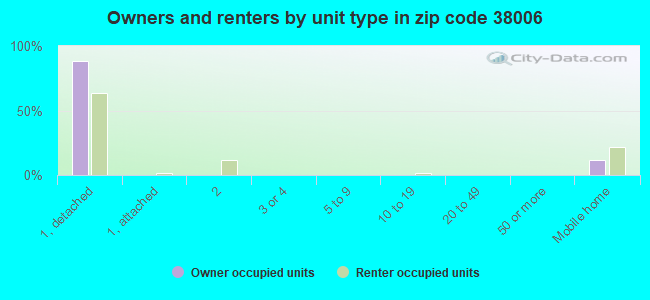
Houses and condos: 2,286 Renter-occupied apartments: 741
% of renters here:
35%
State:
33%
March 2022 cost of living index in zip code 38006: 79.5 (low, U.S. average is 100)
Land area: 101.0 sq. mi. Water area: 0.1 sq. mi.
Population density: 56 people per square mile
(very low).
OSM Map
General Map
Google Map
MSN Map
OSM Map
General Map
Google Map
MSN Map
OSM Map
General Map
Google Map
MSN Map
OSM Map
General Map
Google Map
MSN Map
Please wait while loading the map...
Real estate property taxes paid for housing units in 2022:
This zip code:
0.4% ($848)
Tennessee:
0.5% ($1,376)
Median real estate property taxes paid for housing units with mortgages in 2022: $997 (0.5%) Median real estate property taxes paid for housing units with no mortgage in 2022: $763 (0.5%)
Business Search- 14 Million verified businesses
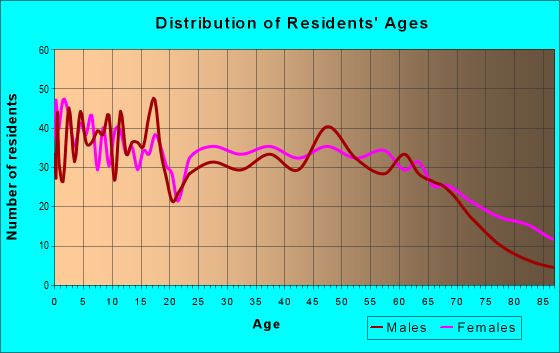
Males: 3,000
(52.7%)
Females: 2,691
(47.3%)
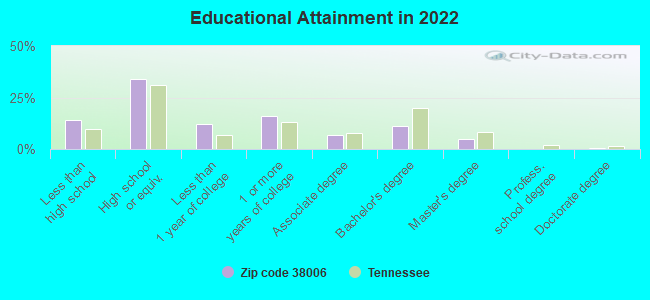
For population 25 years and over in 38006:
High school or higher: 84.8%
Bachelor's degree or higher: 16.1%
Graduate or professional degree: 5.2%
Unemployed: 3.8%
Mean travel time to work (commute): 21.5 minutes
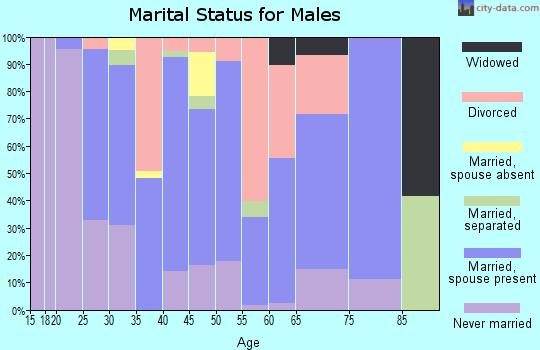
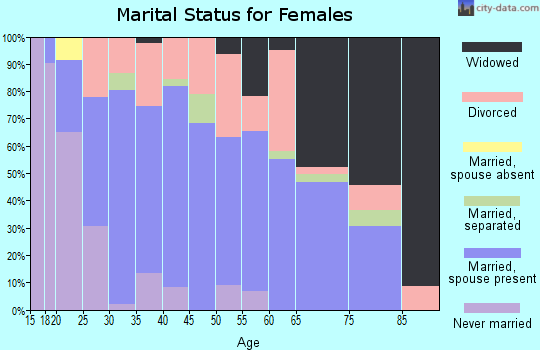
For population 15 years and over in 38006:
Never married: 26.5%
Now married: 53.8%
Separated: 0.7%
Widowed: 7.1%
Divorced: 12.0%
Zip code 38006 compared to state average:
Hispanic race population percentage above state average.
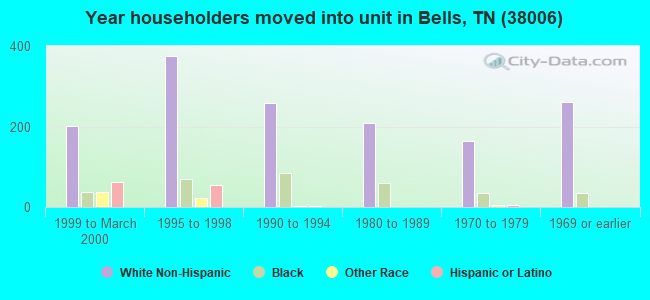
Length of stay since moving in significantly above state average.
Percentage of population with a bachelor's degree or higher below state average.
Averages for the 2020 tax year for zip code 38006, filed in 2021:
Average Adjusted Gross Income (AGI) in 2020: $55,692 (Individual Income Tax Returns)
Here:
$55,692
State:
$69,014
Salary/wage: $48,215 (reported on 85.8% of returns)
Here:
$48,215
State:
$55,872
(% of AGI for various income ranges: 1256.0% for AGIs below $25k, 3924.2% for AGIs $25k-50k, 6921.5% for AGIs $50k-75k, 9274.4% for AGIs $75k-100k, 14574.0% for AGIs $100k-200k)
Taxable interest for individuals: $955 (reported on 23.4% of returns)
This zip code:
$955
Tennessee:
$1,945
(% of AGI for various income ranges: 8.7% for AGIs below $25k, 10.2% for AGIs $25k-50k, 23.7% for AGIs $50k-75k, 23.8% for AGIs $75k-100k, 110.7% for AGIs $100k-200k)
Ordinary dividends: $3,850 (reported on 8.4% of returns)
Here:
$3,850
State:
$8,105
(% of AGI for various income ranges: 16.1% for AGIs below $25k, 8.8% for AGIs $25k-50k, 22.6% for AGIs $50k-75k, 10.0% for AGIs $75k-100k, 206.0% for AGIs $100k-200k)
Net capital gain/loss in AGI: +$14,191 (reported on 9.2% of returns)
Here:
+$14,191
State:
+$33,664
(% of AGI for various income ranges: 8.2% for AGIs below $25k, 17.7% for AGIs $25k-50k, 40.7% for AGIs $50k-75k, 86.9% for AGIs $75k-100k, 374.0% for AGIs $100k-200k)
Profit/loss from business: +$13,200 (reported on 14.2% of returns)
Here:
+$13,200
State:
+$18,991
(% of AGI for various income ranges: 120.6% for AGIs below $25k, 18.4% for AGIs $25k-50k, 148.9% for AGIs $50k-75k, 142.5% for AGIs $75k-100k, 470.0% for AGIs $100k-200k)
Taxable individual retirement arrangement distribution: $12,857 (reported on 5.9% of returns)
38006:
$12,857
Tennessee:
$20,036
(% of AGI for various income ranges: 64.8% for AGIs below $25k, 41.9% for AGIs $25k-50k, 183.3% for AGIs $50k-75k, 442.7% for AGIs $100k-200k)
Total itemized deductions: $40,100 (reported on 2.1% of returns)
Here:
$40,100
State:
$40,136
(% of AGI for various income ranges: 365.2% for AGIs $50k-75k, 679.3% for AGIs $100k-200k)
Charity contributions: $21,175 (reported on 1.7% of returns)
Here:
$21,175
State:
$19,852
(% of AGI for various income ranges: 28.9% for AGIs $25k-50k, 454.7% for AGIs $100k-200k)
Taxes paid: $4,820 (reported on 2.1% of returns)
38006:
$4,820
State:
$6,038
(% of AGI for various income ranges: 37.4% for AGIs $50k-75k, 93.3% for AGIs $100k-200k)
Earned income credit: $2,542 (reported on 21.8% of returns)
Here:
$2,542
State:
$2,391
(% of AGI for various income ranges: 133.9% for AGIs below $25k, 86.3% for AGIs $25k-50k)
Percentage of individuals using paid preparers for their 2020 taxes: 93.7%
Here:
94%
State:
93%
(% for various income ranges: 92.9% for AGIs below $25k, 93.0% for AGIs $25k-50k, 94.4% for AGIs $50k-75k, 95.2% for AGIs $75k-100k, 95.5% for AGIs $100k-200k, 100.0% for AGIs over 200k)
Averages for the 2012 tax year for zip code 38006, filed in 2013:
Average Adjusted Gross Income (AGI) in 2012: $43,774 (Individual Income Tax Returns)
Here:
$43,774
State:
$53,767
Salary/wage: $39,174 (reported on 85.2% of returns)
Here:
$39,174
State:
$45,421
(% of AGI for various income ranges: 80.3% for AGIs below $25k, 86.3% for AGIs $25k-50k, 83.0% for AGIs $50k-75k, 76.5% for AGIs $75k-100k, 69.5% for AGIs $100k-200k, 54.3% for AGIs over 200k)
Taxable interest for individuals: $1,358 (reported on 24.5% of returns)
This zip code:
$1,358
Tennessee:
$1,732
(% of AGI for various income ranges: 0.7% for AGIs below $25k, 0.5% for AGIs $25k-50k, 0.6% for AGIs $50k-75k, 0.5% for AGIs $75k-100k, 0.5% for AGIs $100k-200k, 2.1% for AGIs over 200k)
Ordinary dividends: $2,306 (reported on 7.9% of returns)
Here:
$2,306
State:
$6,739
(% of AGI for various income ranges: 0.1% for AGIs below $25k, 0.2% for AGIs $25k-50k, 0.5% for AGIs $50k-75k, 0.6% for AGIs $75k-100k, 1.0% for AGIs $100k-200k)
Net capital gain/loss in AGI: +$7,593 (reported on 6.9% of returns)
Here:
+$7,593
State:
+$19,082
(% of AGI for various income ranges: 0.3% for AGIs $25k-50k, 0.2% for AGIs $50k-75k, 0.9% for AGIs $75k-100k, 6.5% for AGIs $100k-200k)
Profit/loss from business: +$11,121 (reported on 13.4% of returns)
Here:
+$11,121
State:
+$15,240
(% of AGI for various income ranges: 5.2% for AGIs below $25k, 1.8% for AGIs $25k-50k, 0.9% for AGIs $50k-75k, 1.5% for AGIs $75k-100k, 13.0% for AGIs $100k-200k)
Taxable individual retirement arrangement distribution: $9,376 (reported on 7.9% of returns)
38006:
$9,376
Tennessee:
$15,505
(% of AGI for various income ranges: 2.1% for AGIs below $25k, 1.3% for AGIs $25k-50k, 4.2% for AGIs $50k-75k, 2.3% for AGIs $100k-200k)
Total itemized deductions: $19,555 (19% of AGI, reported on 13.4% of returns)
Here:
$19,555
State:
$21,976
Here:
18.9% of AGI
State:
17.8% of AGI
(% of AGI for various income ranges: 3.2% for AGIs below $25k, 5.6% for AGIs $25k-50k, 5.1% for AGIs $50k-75k, 7.7% for AGIs $75k-100k, 14.2% for AGIs $100k-200k)
Charity contributions: $6,561 (reported on 10.6% of returns)
Here:
$6,561
State:
$6,709
(% of AGI for various income ranges: 1.3% for AGIs $25k-50k, 0.9% for AGIs $50k-75k, 2.0% for AGIs $75k-100k, 5.4% for AGIs $100k-200k)
Taxes paid: $3,521 (reported on 13.0% of returns)
38006:
$3,521
State:
$4,829
(% of AGI for various income ranges: 0.5% for AGIs below $25k, 0.9% for AGIs $25k-50k, 0.7% for AGIs $50k-75k, 1.4% for AGIs $75k-100k, 2.8% for AGIs $100k-200k)
Earned income credit: $2,464 (reported on 26.9% of returns)
Here:
$2,464
State:
$2,404
(% of AGI for various income ranges: 8.8% for AGIs below $25k, 1.6% for AGIs $25k-50k)
Percentage of individuals using paid preparers for their 2012 taxes: 57.9%
Here:
58%
State:
52%
(% for various income ranges: 56.8% for AGIs below $25k, 55.9% for AGIs $25k-50k, 56.7% for AGIs $50k-75k, 61.1% for AGIs $75k-100k, 72.7% for AGIs $100k-200k, 66.7% for AGIs over 200k)
Averages for the 2004 tax year for zip code 38006, filed in 2005:
Average Adjusted Gross Income (AGI) in 2004: $32,648 (Individual Income Tax Returns)
Here:
$32,648
State:
$44,088
Salary/wage: $30,969 (reported on 86.8% of returns)
Here:
$30,969
State:
$38,825
(% of AGI for various income ranges: 174.7% for AGIs below $10k, 82.5% for AGIs $10k-25k, 86.7% for AGIs $25k-50k, 84.7% for AGIs $50k-75k, 81.6% for AGIs $75k-100k, 63.9% for AGIs over 100k)
Taxable interest for individuals: $1,260 (reported on 30.1% of returns)
This zip code:
$1,260
Tennessee:
$1,802
(% of AGI for various income ranges: 10.2% for AGIs below $10k, 1.6% for AGIs $10k-25k, 1.0% for AGIs $25k-50k, 1.0% for AGIs $50k-75k, 0.5% for AGIs $75k-100k, 0.8% for AGIs over 100k)
Taxable dividends: $1,436 (reported on 10.4% of returns)
Here:
$1,436
State:
$3,727
(% of AGI for various income ranges: 1.9% for AGIs below $10k, 0.5% for AGIs $10k-25k, 0.4% for AGIs $25k-50k, 0.3% for AGIs $50k-75k, 0.7% for AGIs $75k-100k, 0.5% for AGIs over 100k)
Net capital gain/loss: +$1,846 (reported on 8.1% of returns)
Here:
+$1,846
State:
+$15,776
(% of AGI for various income ranges: -1.2% for AGIs below $10k, 0.3% for AGIs $10k-25k, 0.3% for AGIs $25k-50k, 1.3% for AGIs $50k-75k, -0.1% for AGIs $75k-100k, 0.4% for AGIs over 100k)
Profit/loss from business: +$8,057 (reported on 15.2% of returns)
Here:
+$8,057
State:
+$12,882
(% of AGI for various income ranges: 9.0% for AGIs below $10k, 4.7% for AGIs $10k-25k, 2.7% for AGIs $25k-50k, 2.6% for AGIs $50k-75k, 0.2% for AGIs $75k-100k, 8.1% for AGIs over 100k)
Profit/loss from farming: +$596 (reported on 4.3% of returns)
Here:
+$596
State:
-$6,038
(% of AGI for various income ranges: -0.5% for AGIs below $10k, -0.4% for AGIs $10k-25k, 0.0% for AGIs $25k-50k, -0.4% for AGIs $50k-75k, 1.9% for AGIs $75k-100k)
IRA payment deduction: $3,340 (reported on 2.3% of returns)
38006:
$3,340
Tennessee:
$2,934
Total itemized deductions: $14,834 (21% of AGI, reported on 13.8% of returns)
Here:
$14,834
State:
$18,035
Here:
21.5% of AGI
State:
19.9% of AGI
(% of AGI for various income ranges: 5.7% for AGIs $10k-25k, 5.8% for AGIs $25k-50k, 7.6% for AGIs $50k-75k, 8.0% for AGIs $75k-100k, 5.4% for AGIs over 100k)
Charity contributions deductions: $4,416 (6% of AGI, reported on 10.8% of returns)
Here:
$4,416
State:
$5,167
Here:
5.8% of AGI
State:
5.3% of AGI
(% of AGI for various income ranges: 0.9% for AGIs $10k-25k, 1.0% for AGIs $25k-50k, 1.6% for AGIs $50k-75k, 1.9% for AGIs $75k-100k, 2.3% for AGIs over 100k)
Total tax: $4,752 (reported on 66.9% of returns)
38006:
$4,752
State:
$7,482
(% of AGI for various income ranges: 6.0% for AGIs below $10k, 3.8% for AGIs $10k-25k, 5.9% for AGIs $25k-50k, 8.1% for AGIs $50k-75k, 11.4% for AGIs $75k-100k, 22.9% for AGIs over 100k)
Earned income credit: $1,926 (reported on 26.6% of returns)
Here:
$1,926
State:
$1,826
Percentage of individuals using paid preparers for their 2004 taxes: 67.9%
Here:
68%
State:
60%
(% for various income ranges: 65.2% for AGIs below $10k, 69.8% for AGIs $10k-25k, 66.9% for AGIs $25k-50k, 65.2% for AGIs $50k-75k, 67.7% for AGIs $75k-100k, 87.7% for AGIs over 100k)
Household received Food Stamps/SNAP in the past 12 months: 265 Household did not receive Food Stamps/SNAP in the past 12 months: 1,845
Women who had a birth in the past 12 months: 56 (42 now married, 14 unmarried) Women who did not have a birth in the past 12 months: 1,068 (543 now married, 525 unmarried)
Housing units in zip code 38006 with a mortgage: 630 (41 second mortgage, 41 both second mortgage and home equity loan) Median monthly owner costs for units with a mortgage: $1,086 Median monthly owner costs for units without a mortgage: $446
Residents with income below the poverty level in 2022:
This zip code:
16.1%
Whole state:
13.3%
Residents with income below 50% of the poverty level in 2022:
This zip code:
10.0%
Whole state:
7.1%
Median number of rooms in houses and condos:
Here:
6.4
State:
6.5
Median number of rooms in apartments:
Here:
5.0
State:
4.4
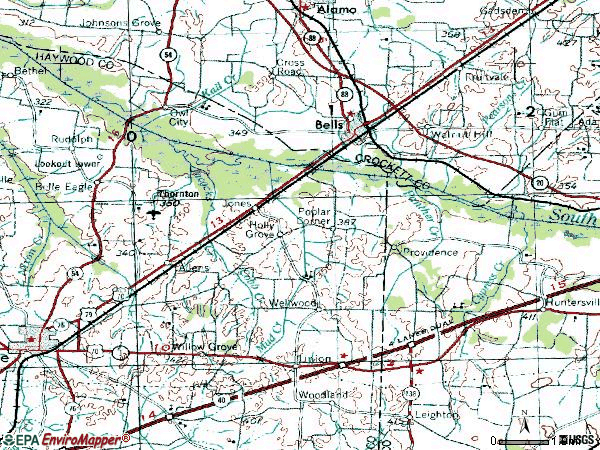
Notable locations in this zip code not listed on our city pages
Notable locations in zip code 38006: Brownsville - Haywood County Fire Department District 8 (A), Bells Fire Department (B). Display/hide their locations on the map
Churches in zip code 38006 include: Faith Church (A), Walnut Hill Baptist Church (B), Midway Baptist Church (C), Cross Roads Baptist Church (D), Bells First Baptist Church (E), Antioch Baptist Church (F), Bluff Creek Church (G), Holly Grove Baptist Church (H), Wortham Chapel (I). Display/hide their locations on the map
Cemeteries: Randolph Family Cemetery (1), Walnut Hill Cemetery (2), Lacy Cemetery (3), Williams Cemetery (4), Lawrence Cemetery (5), Wortham Chapel Cemetery (6), Belleview Cemetery (7). Display/hide their locations on the map
Lakes and reservoirs: Big Eddy (A), Moody Lake (B), Mud Creek Lake (C), Lewis Lake (D), Byrd Lake (E), Bells Aerated Lagoon Number One Lake (F), Bells Aerated Lagoon Number Two Lake (G), Bells Aerobic Lagoon Number One Lake (H). Display/hide their locations on the map
Streams, rivers, and creeks: Kail Creek (A), Jacocks Creek (B), Connley Creek (C), Cobb Creek (D), Whitson Creek (E), Pearsons Creek (F), Panther Creek (G), Sandy Slough (H), Mud Creek (I). Display/hide their locations on the map
In group quarters: 111 (-1 institutionalized population)
Size of family households: 542 2-persons, 506 3-persons, 347 4-persons, 63 5-persons, 44 6-persons, 66 7-or-more-persons
Size of nonfamily households: 394 1-person, 152 2-persons
713 married couples with children.
631 single-parent households (231 men, 400 women).
87.3% of residents of 38006 zip code speak English at home.
12.6% of residents speak Spanish at home (65% very well, 25% well, 9% not at all).
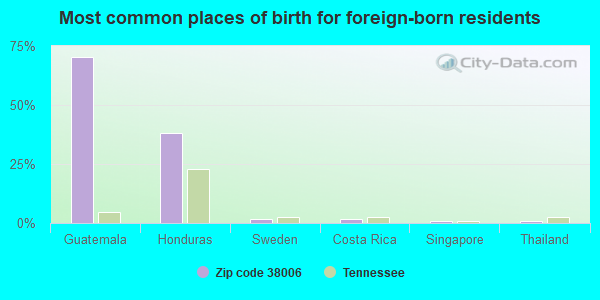
Foreign born population: 381 (6.7%) (43.5% of them are naturalized citizens)
This zip code:
6.7%
Whole state:
5.6%
70%Guatemala
38%Honduras
2%Sweden
2%Costa Rica
1%Singapore
1%Thailand
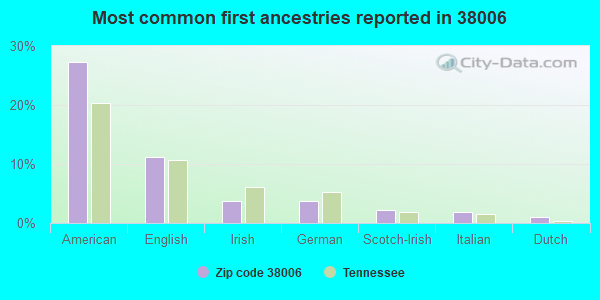
27%American
11%English
4%Irish
4%German
2%Scotch-Irish
2%Italian
1%Dutch
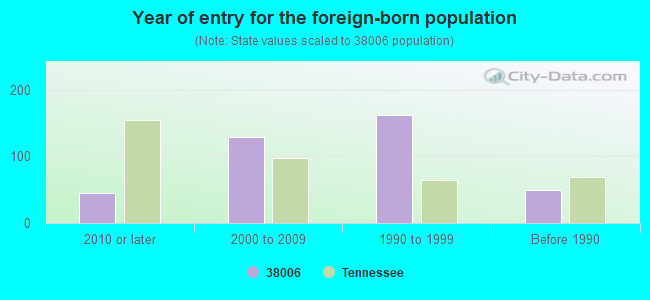
Year of entry for the foreign-born population
452010 or later
1292000 to 2009
1621990 to 1999
49Before 1990
Facilities with environmental interests located in this zip code:
CLASSIC COACH CORPORATION (102 SULLIVAN ROAD in BELLS, TN)
(Resource Conservation and Recovery Act (tracking hazardous waste)) Business NAICS classification: MOTOR VEHICLE BODY MANUFACTURING.
CSX TRANSPORTATION INC (10179 US HWY 79 in BELLS, TN)
(Resource Conservation and Recovery Act (tracking hazardous waste)) Business NAICS classification: LINE-HAUL RAILROADS.
Housing units lacking complete plumbing facilities: 2.1% Housing units lacking complete kitchen facilities: 1.9%
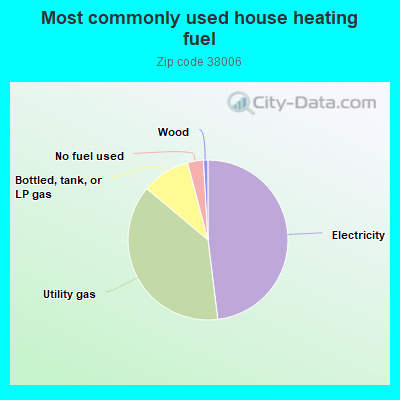
48.1%Electricity
38.1%Utility gas
9.8%Bottled, tank, or LP gas
3.2%No fuel used
0.9%Wood
Population in 1990: 3,092. Population change in the 1990s: +1,928 (+62.4%).
Place of birth for U.S.-born residents:
This state: 4,430
Northeast: 32
Midwest: 260
South: 413
West: 96
61% of the 38006 zip code residents lived in the same house 5 years ago. Out of people who lived in different houses, 42% lived in this county. Out of people who lived in different counties, 50% lived in Tennessee.
97% of the 38006 zip code residents lived in the same house 1 year ago. Out of people who lived in different houses, 83% moved from this county. Out of people who lived in different houses, 26% moved from different county within same state.
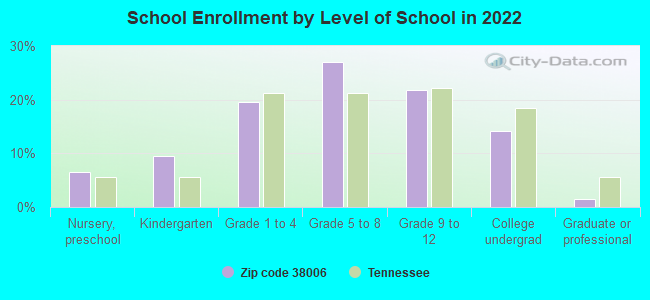
Private vs. public school enrollment:
Students in private schools in grades 1 to 8 (elementary and middle school): 78
Here:
11.3%
Tennessee:
15.0%
Students in private schools in grades 9 to 12 (high school): 24
Here:
7.7%
Tennessee:
16.2%
Students in private undergraduate colleges: 41
Here:
19.6%
Tennessee:
23.5%
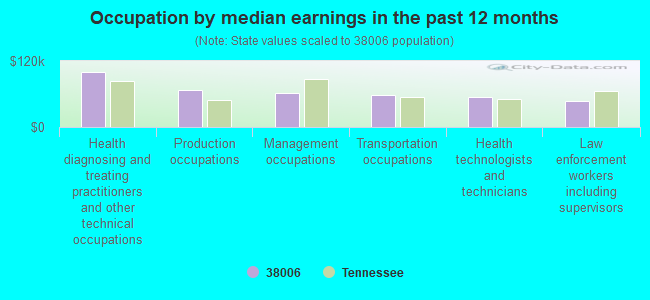
Occupation by median earnings in the past 12 months ($)
99,447Health diagnosing and treating practitioners and other technical occupations
67,966Production occupations
61,326Management occupations
59,023Transportation occupations
54,896Health technologists and technicians
46,715Law enforcement workers including supervisors
Companies with federal contracts located in this zip code:
THE PICTSWEET COMPANY (10 PICTSWEET DR in BELLS, TN) : $15,071,388 in 30 contractsfrom 1999 to 2005
Contracts for Food Items For Resale, Non-Food Items For Resale by Defense Commissary Agency, Department of Defense Signed by year:2000: $526,947; 2001: $401,370; 2002: $761,696; 2003: $346,233; 2004: $3,685,468; 2005: $9,092,434; 2006: $0.
Biggest contracts:
$3,925,788 with Defense Commissary Agency for Food Items For Resale. Signed on 2005-04-01. Completion date: 2005-08-31.
$2,621,304 with Defense Commissary Agency for Non-Food Items For Resale. Signed on 2005-10-01. Completion date: 2005-12-31.
$2,177,874 with Defense Commissary Agency for Food Items For Resale. Signed on 2004-10-01. Completion date: 2005-02-28.
$1,714,253, same as above.Signed on 2005-01-01. Completion date: 2005-03-31.
MID SOUTH INDUSTRIAL INC (13994 HWY 79 in BELLS, TN; small business) : $886,363 in 10 contractsfrom 2003 to 2005
Contracts for Maintenance, Repair or Alteration of Real Property -- Miscellaneous Buildings, Construction of Structures and Facilities -- Other Non-Building Facilities, Construction of Structures and Facilities -- Other Industrial Buildings, Miscellaneous Special Industry Machinery by Air Force Signed by year:2000: $0; 2001: $0; 2002: $0; 2003: $286,637; 2004: $589,781; 2005: $9,945; 2006: $0.
Biggest contracts:
$411,365 with Air Force for Maintenance, Repair or Alteration of Real Property -- Miscellaneous Buildings. Signed on 2004-09-28. Completion date: 2005-04-29.
$173,937 with Air Force for Construction of Structures and Facilities -- Other Non-Building Facilities. Signed on 2003-09-29. Completion date: 2003-12-29.
$112,700 with Air Force for Construction of Structures and Facilities -- Other Industrial Buildings. Signed on 2003-09-26. Completion date: 2003-11-23.
$89,400 with Air Force for Miscellaneous Special Industry Machinery. Signed on 2004-07-12. Completion date: 2004-11-08.
Top industries in this zip code by the number of employees in 2005:
Health Care and Social Assistance: Nursing Care Facilities (100-249 employees: 1 establishment)
Construction: Plumbing, Heating, and Air-Conditioning Contractors (20-49: 2, 1-4: 1)
Other Services (except Public Administration): Religious Organizations (5-9: 3, 1-4: 10)
Information: Radio Stations (20-49: 1)
Administrative and Support and Waste Management and Remediation Services: Solid Waste Collection (20-49: 1)
Administrative and Support and Waste Management and Remediation Services: Security Guards and Patrol Services (20-49: 1)
Finance and Insurance: Commercial Banking (10-19: 2)
People in group quarters in 2010:
98 people in nursing facilities/skilled-nursing facilities
People in group quarters in 2000:
122 people in nursing homes
Fatal accident statistics in 2014:
Fatal accident count: 1
Vehicles involved in fatal accidents: 2
Fatal accidents caused by drunken drivers: 0
Fatalities: 1
Persons involved in fatal accidents: 2
Pedestrians involved in fatal accidents: 0
Fatal accident statistics in 2013:
Fatal accident count: 4
Vehicles involved in fatal accidents: 5
Fatal accidents caused by drunken drivers: 2
Fatalities: 4
Persons involved in fatal accidents: 6
Pedestrians involved in fatal accidents: 0
2003 - 2018 National Fire Incident Reporting System (NFIRS) incidents
According to the data from the years 2003 - 2018 the average number of fires per year is 13. The highest number of fire incidents - 23 took place in 2005, and the least - 1 in 2003. The data has a rising trend.
When looking into fire subcategories, the most incidents belonged to: Outside Fires (44.6%), and Structure Fires (19.3%).
Fire incident types reported to NFIRS in Zip Code 38006


+$596
-$6,038
(% of AGI for various income ranges: -0.5% for AGIs below $10k, -0.4% for AGIs $10k-25k, 0.0% for AGIs $25k-50k, -0.4% for AGIs $50k-75k, 1.9% for AGIs $75k-100k) Nearest zip codes: 38337, 38001, 38391, 38021, 38050, 38012.
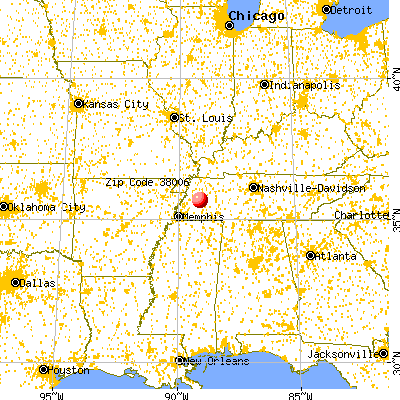


 According to the data from the years 2003 - 2018 the average number of fires per year is 13. The highest number of fire incidents - 23 took place in 2005, and the least - 1 in 2003. The data has a rising trend.
 When looking into fire subcategories, the most incidents belonged to: Outside Fires (44.6%), and Structure Fires (19.3%).